| Table of Contents | |||||
| Page | |||||
| Glossary of Terms | |||||
| Company Overview | |||||
| Financial and Portfolio Overview | |||||
| Financial and Operating Results | |||||
| Financial Summary | |||||
| Consolidated Balance Sheets | |||||
| Consolidated Statements of Operations | |||||
| Reconciliation of Non-GAAP Measures | |||||
| Debt Summary | |||||
| Portfolio Summary | |||||
| Property Summary | |||||
| Top Ten Tenants by Annualized Base Rent and Lease Expiration Schedules | |||||
| Leasing Summary | |||||
WHLR | Financial & Operating Data | 2 | ||||
WHLR | Financial & Operating Data | 3 | ||||
| Term | Definition | |||||||
| Adjusted FFO ("AFFO") | We believe the computation of funds from operations ("FFO") in accordance with the National Association of Real Estate Investment Trusts' ("Nareit") definition includes certain items that are not indicative of the results provided by our operating portfolio and affect the comparability of our period-over-period performance. These items include, but are not limited to, legal settlements, non-cash share-based compensation expense, non-cash amortization on loans and acquisition costs. Therefore, in addition to FFO, management uses Adjusted FFO ("AFFO"), a non-GAAP measure, for REITs, which we define to exclude such items. Management believes that these adjustments are appropriate in determining AFFO as they are not indicative of the operating performance of our assets. In addition, we believe that AFFO is a useful supplemental measure for the investing community to use in comparing us to other REITs as many REITs provide some form of adjusted or modified FFO. However, there can be no assurance that AFFO presented by us is comparable to the adjusted or modified FFO of other REITs. | |||||||
| Anchor | Lease occupying 20,000 square feet or more. | |||||||
| Annualized Base Rent ("ABR") | Monthly base rent on occupied space as of the end of the current reporting period multiplied by twelve months, excluding the impact of tenant concessions and rent abatements. | |||||||
| Earnings Before Interest, Taxes, Depreciation and Amortization ("EBITDA") | A widely-recognized non-GAAP financial measure that the Company believes, when considered with financial statements prepared in accordance with GAAP, is useful to investors and lenders in understanding financial performance and providing a relevant basis for comparison against other companies, including other REITs. While EBITDA should not be considered as a substitute for net income attributable to the Company’s common stockholders, net operating income, cash flow from operating activities, or other income or cash flow data prepared in accordance with GAAP, the Company believes that EBITDA may provide additional information with respect to the Company’s performance or ability to meet its future debt service requirements, capital expenditures and working capital requirements. The Company computes EBITDA by excluding interest expense, net loss attributable to noncontrolling interests, depreciation and amortization, and impairment of long-lived assets and notes receivable from income from continuing operations. The Company also presents Adjusted EBITDA, which excludes items affecting the comparability of the periods presented, including but not limited to, costs associated with acquisitions and capital related activities. | |||||||
| Funds from Operations ("FFO") | We use FFO, a non-GAAP measure, as an alternative measure of our operating performance, specifically as it relates to results of operations and liquidity. We compute FFO in accordance with standards established by the Board of Governors of Nareit in its March 1995 White Paper (as amended in November 1999, April 2002 and December 2018). As defined by Nareit, FFO represents net income (computed in accordance with GAAP), excluding gains (or losses) from sales of property, plus real estate-related depreciation and amortization (excluding amortization of loan origination costs), plus impairment of real estate related long-lived assets and after adjustments for unconsolidated partnerships and joint ventures. Most industry analysts and equity REITs, including us, consider FFO to be an appropriate supplemental measure of operating performance because, by excluding gains or losses on dispositions and excluding depreciation, FFO is a helpful tool that can assist in the comparison of the operating performance of a company’s real estate between periods, or as compared to different companies. Management uses FFO as a supplemental measure to conduct and evaluate our business because there are certain limitations associated with using GAAP net income alone as the primary measure of our operating performance. Historical cost accounting for real estate assets in accordance with GAAP implicitly assumes that the value of real estate assets diminishes predictably over time, while historically real estate values have risen or fallen with market conditions. Accordingly, we believe FFO provides a valuable alternative measurement tool to GAAP when presenting our operating results. | |||||||
| Gross Leasable Area ("GLA") | The total amount of leasable space in an investment property. | |||||||
| Ground Lease | A lease in which the tenant owns the building but not the land it is built on. | |||||||
WHLR | Financial & Operating Data | 4 | ||||
| Term | Definition | |||||||
| Leased Rate / % Leased | The space committed to lessee under a signed lease agreement as of December 31, 2025, expressed as a percentage of Gross Leasable Area. | |||||||
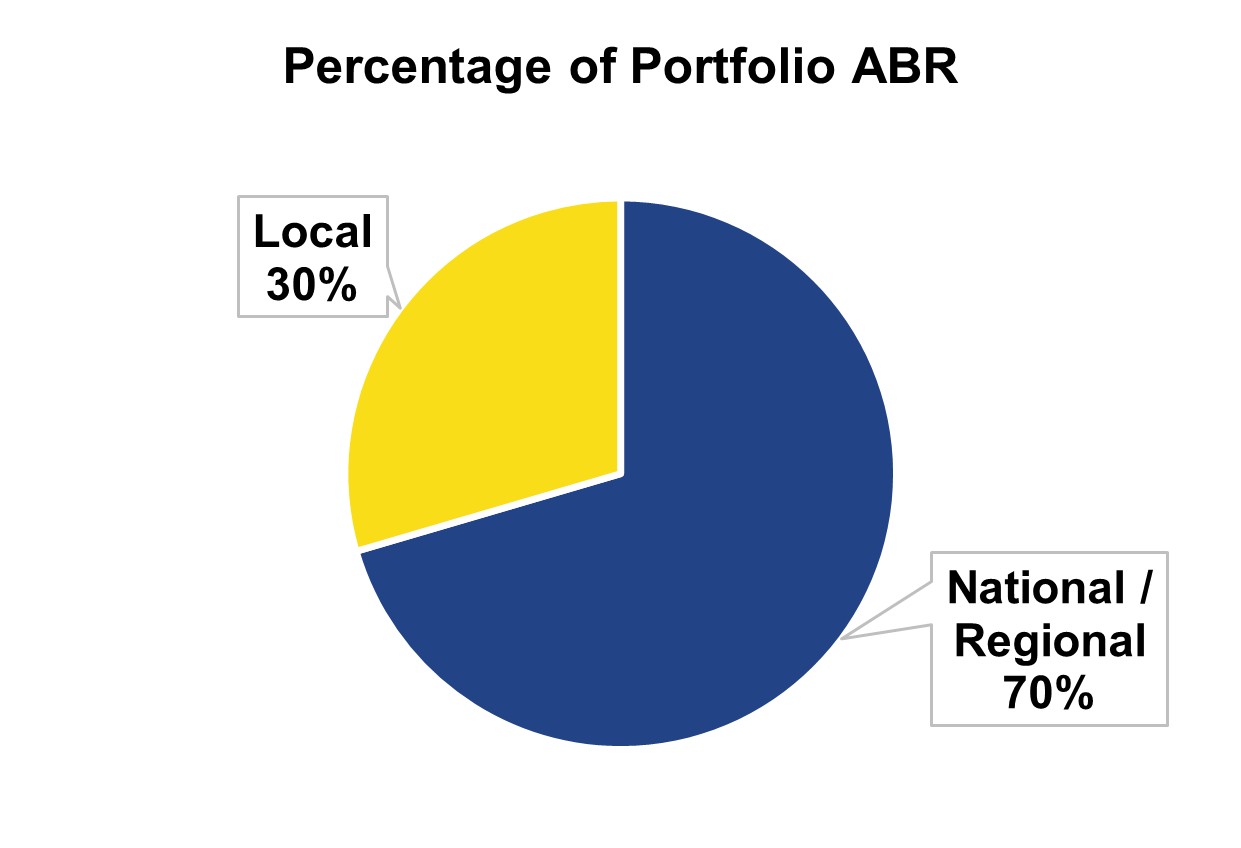
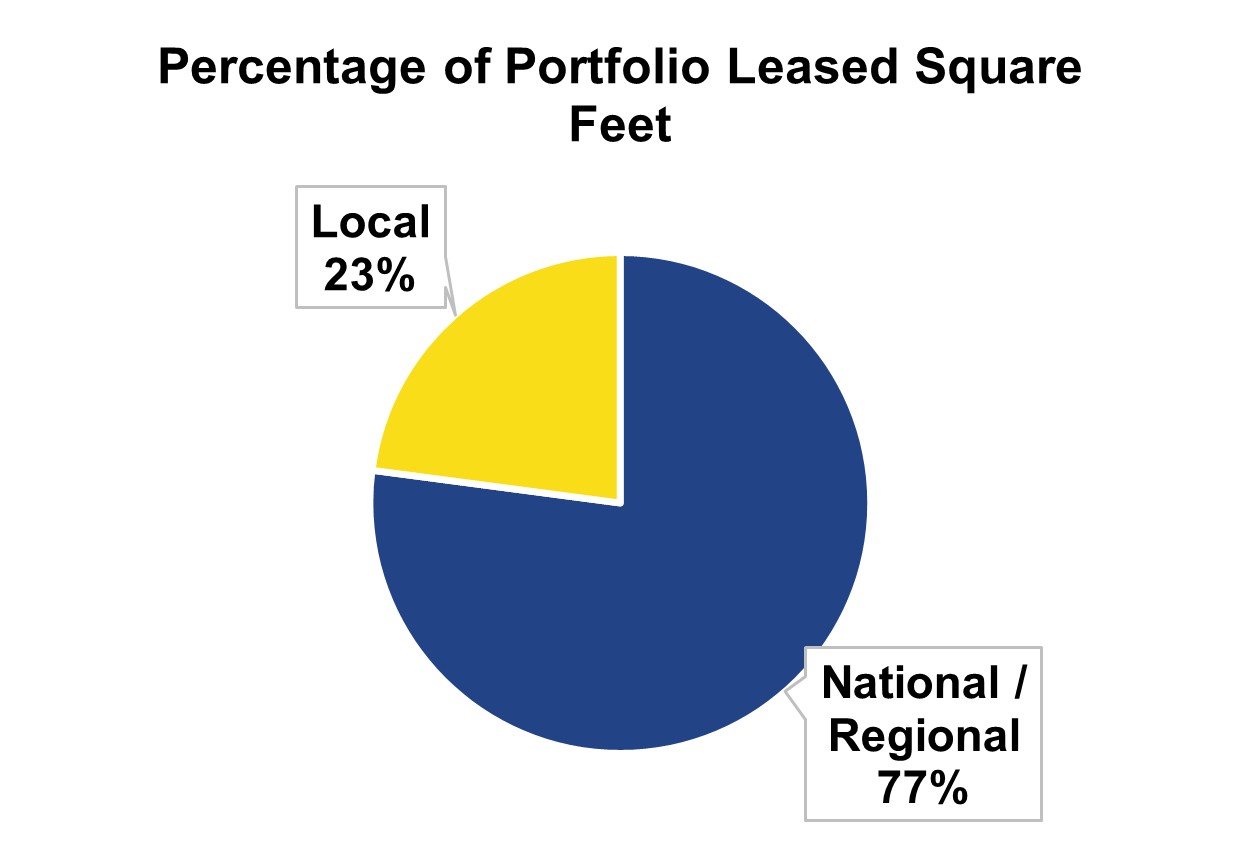
| Local Tenant | Tenant with presence in one state with 10 or less locations. | |||||||
| National / Regional Tenant | Tenant with presence in multiple states or a single state presence with more than 10 locations. | |||||||
| Occupancy Rate / % Occupied | The space delivered to a tenant under a signed lease agreement as a percentage of gross leasable area through December 31, 2025. | |||||||
| Rent Spread: | ||||||||
| New Rent Spread | Weighted average change over the gross value of a new lease, annualized per square foot, compared to the annualized base rent per square foot of the prior tenant. | |||||||
Renewal Rent Spread | Weighted average change over the gross value of a renewed lease, annualized per square foot, compared to the annualized base rent per square foot of the prior rate. | |||||||
| Same-Property | Properties owned during all periods presented herein. | |||||||
Same-Property Net Operating Income ("Same-Property NOI") | Same-Property net operating income ("Same-Property NOI") is a widely-used non-GAAP financial measure for REITs. The Company believes that Same-Property NOI is a useful measure of the Company's property operating performance. The Company defines Same-Property NOI as property revenues (rental and other revenues) less property and related expenses (property operation and maintenance and real estate taxes). Because Same-Property NOI excludes above (below) market lease amortization, straight-line rents, general and administrative expenses, depreciation and amortization, gain or loss on sale or capital expenditures and leasing costs and impairment charges, it provides a performance measure, that when compared year over year, reflects the revenues and expenses directly associated with owning and operating commercial real estate properties and the impact to operations from trends in occupancy rates, rental rates and operating costs, providing perspective not immediately apparent from operating income. The Company uses Same-Property NOI to evaluate its operating performance since Same-Property NOI allows the Company to evaluate the impact of factors, such as occupancy levels, lease structure, lease rates and tenant base, have on the Company's results, margins and returns. Properties are included in Same-Property NOI if they are owned and operated for the entirety of both periods being compared. Consistent with the capital treatment of such costs under GAAP, tenant improvements, leasing commissions and other direct leasing costs are excluded from Same-Property NOI. The most directly comparable GAAP financial measure is consolidated operating income. Same-Property NOI should not be considered as an alternative to consolidated operating income prepared in accordance with GAAP or as a measure of liquidity. Further, Same-Property NOI is a measure for which there is no standard industry definition and, as such, it is not consistently defined or reported on among the Company's peers, and thus may not provide an adequate basis for comparison among REITs. | |||||||
| SOFR | Secured Overnight Financing Rate | |||||||
| Undeveloped Property | Vacant land without GLA. | |||||||
WHLR | Financial & Operating Data | 5 | ||||
| Corporate Headquarters | ||||||||
| Wheeler Real Estate Investment Trust, Inc. | ||||||||
| 2529 Virginia Beach Boulevard Virginia Beach, VA 23452 | ||||||||
| Phone: (757) 627-9088 Toll Free: (866) 203-4864 | ||||||||
| Website: www.whlr.us | ||||||||
| Executive Management | ||||||||
| M. Andrew Franklin - CEO and President | ||||||||
| Crystal Plum - CFO | ||||||||
 |  | |||||||
| Board of Directors | Board of Directors | |||||||
Stefani D. Carter (Chair) | Kerry G. Campbell (Chair) | |||||||
E.J. Borrack | E.J. Borrack | |||||||
Robert Brady | M. Andrew Franklin | |||||||
Kerry G. Campbell | Crystal Plum | |||||||
| Gregory P. Hannon | Paula Poskon | |||||||
| Rebecca Musser | Gary Skoien | |||||||
| Megan Parisi | ||||||||
| Joseph D. Stilwell | ||||||||
| Stock Transfer Agent and Registrar | ||||||||
| Computershare Trust Company, N.A. 150 Royall Street, Suite 101 Canton, MA 02021 www.computershare.com | ||||||||
| Investor Relations Representative | ||||||||
| investorrelations@whlr.us Office: (757) 627-9088 | ||||||||
WHLR | Financial & Operating Data | 6 | ||||
Financial Results | |||||
Net loss attributable to Wheeler REIT common stockholders (in 000s) | $ | (866) | |||
Basic and diluted loss per share | $ | (2.67) | |||
| FFO available to common stockholders (in 000s) | $ | (103) | |||
| FFO per common share | $ | (0.32) | |||
| AFFO (in 000s) | $ | 3,229 | |||
| AFFO per common share | $ | 9.96 | |||
Assets and Leverage | |||||
Real Estate, net of $122.8 million accumulated depreciation (in 000s) | $ | 484,675 | |||
| Cash and Cash Equivalents (in 000s) | $ | 23,656 | |||
| Total Assets (in 000s) | $ | 601,734 | |||
| Total Debt (in 000s) | $ | 482,841 | |||
| Debt to Total Assets | 80.2 | % | |||
| Debt to Gross Asset Value | 66.7 | % | |||
| Ticker | Shares Outstanding at December 31, 2025 | Fourth Quarter stock price range | Stock price as of December 31, 2025 | ||||||||||||||
| WHLR | 631,866 | $4.74-$38.40 | $ | 5.10 | |||||||||||||
| WHLRP | 2,714,618 | $3.34-$5.19 | $ | 5.19 | |||||||||||||
| WHLRD | 1,507,205 | $34.06-$42.00 | $ | 38.05 | |||||||||||||
| CDRpB | 857,237 | $17.20-$19.24 | $ | 17.84 | |||||||||||||
| CDRpC | 2,229,222 | $15.67-$18.08 | $ | 17.19 | |||||||||||||
| Common Stock market capitalization (in 000s) | $ | 3,223 | |||
Portfolio Summary | | | |||||||||
| GLA in sq. ft. | 5,075,661 | 1,943,176 | |||||||||
| Occupancy Rate | 93.7 | % | 92.4 | % | |||||||
| Leased Rate | 95.1 | % | 92.4 | % | |||||||
| Annualized Base Rent (in 000s) | $ | 50,449 | $ | 19,559 | |||||||
| Total number of leases signed or renewed | 40 | 5 | |||||||||
| Total sq. ft. leases signed or renewed | 229,491 | 17,061 | |||||||||
WHLR | Financial & Operating Data | as of 12/31/2025 unless otherwise stated | 7 | ||||
WHLR | Financial & Operating Data | as of 12/31/2025 unless otherwise stated | 8 | ||||
| % Leased | % Occupied | |||||||||||||||||||
| Real Estate Portfolio | 2025 | 2024 | 2025 | 2024 | ||||||||||||||||
| Company | 94.3 | % | 94.2 | % | 93.3 | % | 94.1 | % | ||||||||||||
WHLR(1) | 95.1 | % | 94.8 | % | 93.7 | % | 94.7 | % | ||||||||||||
| CDR | 92.4 | % | 92.4 | % | 92.4 | % | 92.3 | % | ||||||||||||
WHLR | Financial & Operating Data | as of 12/31/2025 unless otherwise stated | 9 | ||||
WHLR | Financial & Operating Data | as of 12/31/2025 unless otherwise stated | 10 | ||||
| December 31, 2025 | September 30, 2025 | June 30, 2025 | March 31, 2025 | December 31, 2024 | |||||||||||||||||||||||||||||||||||||||||||
| Stock class | Number of shares | Liquidation value (1) | Number of shares | Liquidation value (1) | Number of shares | Liquidation value (1) | Number of shares | Liquidation value (1) | Number of shares | Liquidation value (1) | |||||||||||||||||||||||||||||||||||||
| WHLR | 631,866 | 157,820 | 36,484 | 2,804 | 311 | ||||||||||||||||||||||||||||||||||||||||||
| WHLRP | 2,714,618 | $67.9 | 2,887,818 | $72.2 | 3,096,018 | $77.4 | 3,218,718 | $80.5 | 3,357,142 | $83.9 | |||||||||||||||||||||||||||||||||||||
WHLRD | 1,507,205 | $63.2 | 1,576,557 | $66.0 | 1,776,179 | $72.7 | 1,903,921 | $77.3 | 2,236,046 | $88.7 | |||||||||||||||||||||||||||||||||||||
| CDRpB | 857,237 | $21.4 | 857,237 | $21.4 | 857,237 | $21.4 | 1,449,609 | $36.2 | 1,449,609 | $36.2 | |||||||||||||||||||||||||||||||||||||
| CDRpC | 2,229,222 | $55.7 | 2,287,466 | $57.2 | 2,907,535 | $72.7 | 2,907,535 | $72.7 | 4,208,694 | $105.2 | |||||||||||||||||||||||||||||||||||||
WHLR | Financial & Operating Data | as of 12/31/2025 unless otherwise stated | 11 | ||||
WHLR | Financial & Operating Data | as of 12/31/2025 unless otherwise stated | 12 | ||||
| December 31, | |||||||||||
| 2025 | 2024 | ||||||||||
| ASSETS: | |||||||||||
| Real estate: | |||||||||||
| Land and land improvements | $ | 123,444 | $ | 138,177 | |||||||
| Buildings and improvements | 484,068 | 508,957 | |||||||||
| 607,512 | 647,134 | ||||||||||
| Less accumulated depreciation | (122,837) | (112,209) | |||||||||
| Real estate, net | 484,675 | 534,925 | |||||||||
| Cash and cash equivalents | 23,656 | 42,964 | |||||||||
| Restricted cash | 24,973 | 17,752 | |||||||||
| Receivables, net | 15,759 | 14,692 | |||||||||
| Investment securities - related party | 24,406 | 12,025 | |||||||||
| Assets held for sale | 4,549 | — | |||||||||
| Above market lease intangibles, net | 706 | 1,285 | |||||||||
| Operating lease right-of-use assets | 7,546 | 9,235 | |||||||||
| Deferred costs and other assets, net | 15,464 | 20,824 | |||||||||
| Total Assets | $ | 601,734 | $ | 653,702 | |||||||
| LIABILITIES: | |||||||||||
| Loans payable, net | $ | 468,157 | $ | 482,609 | |||||||
| Liabilities associated with assets held for sale | 1,383 | — | |||||||||
| Below market lease intangible, net | 7,370 | 11,121 | |||||||||
| Derivative liabilities | 7,243 | 11,985 | |||||||||
| Operating lease liabilities | 8,221 | 10,128 | |||||||||
| Series D Preferred Stock redemptions | 30 | 4,074 | |||||||||
| Accounts payable, accrued expenses and other liabilities | 14,639 | 17,131 | |||||||||
| Total Liabilities | 507,043 | 537,048 | |||||||||
| Commitments and contingencies | |||||||||||
| Series D Cumulative Convertible Preferred Stock | 63,204 | 84,625 | |||||||||
| EQUITY: | |||||||||||
Series A Preferred Stock (no par value, 4,500 shares authorized, 562 shares issued and outstanding; $0.6 million in aggregate liquidation value) | 453 | 453 | |||||||||
Series B Convertible Preferred Stock (no par value, 5,000,000 authorized, 2,714,618 and 3,357,142 shares, respectively, issued and outstanding; $67.9 million and $83.9 million aggregate liquidation preference, respectively) | 36,296 | 44,791 | |||||||||
Common Stock ($0.01 par value, 200,000,000 shares authorized, 631,866 and 311 shares, respectively, issued and outstanding) | 6 | — | |||||||||
| Additional paid-in capital | 311,977 | 276,416 | |||||||||
| Accumulated deficit | (350,879) | (347,029) | |||||||||
| Accumulated other comprehensive income | 2,381 | — | |||||||||
| Total Stockholders’ Equity (Deficit) | 234 | (25,369) | |||||||||
| Noncontrolling interests | 31,253 | 57,398 | |||||||||
| Total Equity | 31,487 | 32,029 | |||||||||
| Total Liabilities and Equity | $ | 601,734 | $ | 653,702 | |||||||
WHLR | Financial & Operating Data | as of 12/31/2025 unless otherwise stated | 13 | ||||
| Three Months Ended December 31, | Years Ended December 31, | ||||||||||||||||||||||
| 2025 | 2024 | 2025 | 2024 | ||||||||||||||||||||
| REVENUE: | |||||||||||||||||||||||
| Rental revenues | $ | 24,151 | $ | 26,483 | $ | 97,694 | $ | 102,408 | |||||||||||||||
| Other revenues | 1,018 | 1,110 | 1,751 | 2,166 | |||||||||||||||||||
| Total Revenue | 25,169 | 27,593 | 99,445 | 104,574 | |||||||||||||||||||
| OPERATING EXPENSES: | |||||||||||||||||||||||
| Property operations | 8,547 | 8,996 | 33,044 | 35,286 | |||||||||||||||||||
| Depreciation and amortization | 5,323 | 6,104 | 22,944 | 25,316 | |||||||||||||||||||
| Impairment charges | 390 | — | 2,880 | 1,195 | |||||||||||||||||||
| Corporate general & administrative | 3,756 | 3,440 | 11,709 | 10,796 | |||||||||||||||||||
| Total Operating Expenses | 18,016 | 18,540 | 70,577 | 72,593 | |||||||||||||||||||
| Gain (loss) on disposal of properties, net | 3,480 | (4,416) | 14,354 | 5,550 | |||||||||||||||||||
| Operating Income | 10,633 | 4,637 | 43,222 | 37,531 | |||||||||||||||||||
| Interest income | 230 | 204 | 964 | 460 | |||||||||||||||||||
| Unrealized gain on investment securities, net - related party | — | 61 | — | 840 | |||||||||||||||||||
| Interest expense | (9,120) | (8,568) | (33,758) | (32,602) | |||||||||||||||||||
| Net changes in fair value of derivative liabilities | (1,510) | 41,442 | 4,742 | (8,332) | |||||||||||||||||||
| Loss on conversion of Convertible Notes | — | (44) | (902) | (412) | |||||||||||||||||||
| Gain on preferred stock redemptions | 301 | 1,977 | 1,523 | 4,716 | |||||||||||||||||||
| Other expense | (52) | (3) | (928) | (1,489) | |||||||||||||||||||
| Net Income Before Income Taxes | 482 | 39,706 | 14,863 | 712 | |||||||||||||||||||
| Income tax expense | — | — | (26) | (1) | |||||||||||||||||||
| Net Income | 482 | 39,706 | 14,837 | 711 | |||||||||||||||||||
| Less: Net income attributable to noncontrolling interests | 1,301 | 2,255 | 6,067 | 10,343 | |||||||||||||||||||
| Net (Loss) Income Attributable to Wheeler REIT | (819) | 37,451 | 8,770 | (9,632) | |||||||||||||||||||
| Preferred Stock dividends - undeclared | (1,539) | (2,132) | (6,640) | (8,267) | |||||||||||||||||||
| Deemed contribution (distribution) related to issuance of Series D Preferred Stock | 855 | 158 | 1,408 | (552) | |||||||||||||||||||
| Deemed contribution related to preferred stock exchanges | 1,031 | 56 | 9,558 | 56 | |||||||||||||||||||
| Deemed distribution related to noncontrolling interests | (394) | (3,496) | (16,946) | (3,780) | |||||||||||||||||||
| Net (Loss) Income Attributable to Wheeler REIT Common Shareholders | $ | (866) | $ | 32,037 | $ | (3,850) | $ | (22,175) | |||||||||||||||
| Per common share: | |||||||||||||||||||||||
| Net (Loss) Income Attributable to Wheeler REIT Common Shareholders | |||||||||||||||||||||||
| Basic | $ | (2.67) | $ | 186,261.63 | $ | (36.01) | $ | (346,484.38) | |||||||||||||||
| Diluted | $ | (2.67) | $ | (3,983.84) | $ | (36.01) | $ | (346,484.38) | |||||||||||||||
| Weighted-average number of shares: | |||||||||||||||||||||||
| Basic | 324,250 | 172 | 106,902 | 64 | |||||||||||||||||||
| Diluted | 324,250 | 1,918 | 106,902 | 64 | |||||||||||||||||||
WHLR | Financial & Operating Data | as of 12/31/2025 unless otherwise stated | 14 | ||||
| Three Months Ended December 31, | Years Ended December 31, | ||||||||||||||||||||||
| 2025 | 2024 | 2025 | 2024 | ||||||||||||||||||||
| Operating Income | $ | 10,633 | $ | 4,637 | $ | 43,222 | $ | 37,531 | |||||||||||||||
| Add (deduct): | |||||||||||||||||||||||
| (Gain) loss on disposal of properties | (3,480) | 4,416 | (14,354) | (5,550) | |||||||||||||||||||
| Corporate general & administrative | 3,756 | 3,440 | 11,709 | 10,796 | |||||||||||||||||||
| Impairment charges | 390 | — | 2,880 | 1,195 | |||||||||||||||||||
| Depreciation and amortization | 5,323 | 6,104 | 22,944 | 25,316 | |||||||||||||||||||
| Straight-line rents | (282) | (449) | (1,895) | (1,334) | |||||||||||||||||||
| Above (below) market lease amortization, net | (483) | (827) | (2,466) | (3,434) | |||||||||||||||||||
| Other non-property revenue | (877) | (912) | (945) | (1,043) | |||||||||||||||||||
| NOI related to properties not defined as Same-Property | (3) | (951) | (900) | (4,242) | |||||||||||||||||||
| Same-Property Net Operating Income | $ | 14,977 | $ | 15,458 | $ | 60,195 | $ | 59,235 | |||||||||||||||
| Property revenues | $ | 23,193 | $ | 23,255 | $ | 90,556 | $ | 88,503 | |||||||||||||||
| Property expenses | 8,216 | 7,797 | 30,361 | 29,268 | |||||||||||||||||||
| Same-Property Net Operating Income | $ | 14,977 | $ | 15,458 | $ | 60,195 | $ | 59,235 | |||||||||||||||
WHLR | Financial & Operating Data | as of 12/31/2025 unless otherwise stated | 15 | ||||
Three Months Ended December 31, | Years Ended December 31, | ||||||||||||||||||||||
| 2025 | 2024 | 2025 | 2024 | ||||||||||||||||||||
| Net Income | $ | 482 | $ | 39,706 | $ | 14,837 | $ | 711 | |||||||||||||||
| Depreciation and amortization of real estate assets | 5,323 | 6,104 | 22,944 | 25,316 | |||||||||||||||||||
| Impairment charges | 390 | — | 2,880 | 1,195 | |||||||||||||||||||
| (Gain) loss on disposal of properties, net | (3,480) | 4,416 | (14,354) | (5,550) | |||||||||||||||||||
| FFO | 2,715 | 50,226 | 26,307 | 21,672 | |||||||||||||||||||
| Preferred stock dividends - undeclared | (1,539) | (2,132) | (6,640) | (8,267) | |||||||||||||||||||
| Dividends on noncontrolling interests preferred stock | (1,301) | (2,245) | (6,067) | (10,295) | |||||||||||||||||||
| Preferred stock accretion adjustments | 22 | 22 | 87 | 87 | |||||||||||||||||||
| FFO available to common stockholders and common unitholders | (103) | 45,871 | 13,687 | 3,197 | |||||||||||||||||||
Other non-recurring and non-cash expenses (1) | 687 | — | 1,256 | 368 | |||||||||||||||||||
| Unrealized gain on investment securities, net - related party | — | (61) | — | (840) | |||||||||||||||||||
| Net changes in fair value of derivative liabilities | 1,510 | (41,442) | (4,742) | 8,332 | |||||||||||||||||||
| Loss on conversion of Convertible Notes | — | 44 | 902 | 412 | |||||||||||||||||||
| Gain on Preferred Stock redemptions | (301) | (1,977) | (1,523) | (4,716) | |||||||||||||||||||
| Straight-line rental revenue, net straight-line expense | (301) | (466) | (1,970) | (1,402) | |||||||||||||||||||
| Deferred financing cost amortization | 656 | 516 | 2,694 | 2,673 | |||||||||||||||||||
| Paid-in-kind interest | 1,853 | 2,102 | 3,859 | 4,133 | |||||||||||||||||||
| Above (below) market lease amortization, net | (483) | (827) | (2,466) | (3,434) | |||||||||||||||||||
| Recurring capital expenditures tenant improvement reserves | (289) | (349) | (1,404) | (1,532) | |||||||||||||||||||
| AFFO | $ | 3,229 | $ | 3,411 | $ | 10,293 | $ | 7,191 | |||||||||||||||
| Weighted Average Common Shares | 324,250 | 172 | 106,902 | 64 | |||||||||||||||||||
| FFO per Common Share | $ | (0.32) | $ | 266,691.86 | $ | 128.03 | $ | 49,953.13 | |||||||||||||||
| AFFO per Common Share | $ | 9.96 | $ | 19,831.40 | $ | 96.28 | $ | 112,359.38 | |||||||||||||||
WHLR | Financial & Operating Data | as of 12/31/2025 unless otherwise stated | 16 | ||||
| Three Months Ended December 31, | Years Ended December 31, | |||||||||||||||||||||||||
| 2025 | 2024 | 2025 | 2024 | |||||||||||||||||||||||
Net Income | $ | 482 | $ | 39,706 | $ | 14,837 | $ | 711 | ||||||||||||||||||
Add back: | ||||||||||||||||||||||||||
Depreciation and amortization (1) | 4,840 | 5,277 | 20,478 | 21,882 | ||||||||||||||||||||||
Interest Expense (2) | 9,120 | 8,568 | 33,758 | 32,602 | ||||||||||||||||||||||
Income tax expense | — | — | 26 | 1 | ||||||||||||||||||||||
EBITDA | 14,442 | 53,551 | 69,099 | 55,196 | ||||||||||||||||||||||
| Adjustments for items affecting comparability: | ||||||||||||||||||||||||||
| Net change in FMV of derivative liabilities | 1,510 | (41,442) | (4,742) | 8,332 | ||||||||||||||||||||||
| Impairment charges | 390 | — | 2,880 | 1,195 | ||||||||||||||||||||||
| Loss on conversion of Convertible Notes | — | 44 | 902 | 412 | ||||||||||||||||||||||
| Gain on preferred stock redemptions | (301) | (1,977) | (1,523) | (4,716) | ||||||||||||||||||||||
Unrealized gain on investment securities, net - related party | — | (61) | — | (840) | ||||||||||||||||||||||
| (Gain) loss on disposal of properties, net | (3,480) | 4,416 | (14,354) | (5,550) | ||||||||||||||||||||||
Adjusted EBITDA | $ | 12,561 | $ | 14,531 | $ | 52,262 | $ | 54,029 | ||||||||||||||||||
WHLR | Financial & Operating Data | as of 12/31/2025 unless otherwise stated | 17 | ||||
| Property/Description | Monthly Payment | Interest Rate | Maturity | December 31, 2025 | December 31, 2024 | |||||||||||||||||||||||||||
| Variable-rate: | ||||||||||||||||||||||||||||||||
| August 2025 Cedar Credit Facility | Interest only | 6.7% | August 2027 | $ | — | $ | — | |||||||||||||||||||||||||
| April 2025 Cedar Bridge Loan | Interest only | 5.1% | February 2028 | 5,966 | — | |||||||||||||||||||||||||||
| Fixed-rate: | ||||||||||||||||||||||||||||||||
| Winslow Plaza | $ | 24,295 | 4.8% | December 2025 | — | 4,250 | ||||||||||||||||||||||||||
| Tuckernuck | $ | 32,202 | 5.0% | March 2026 | 4,460 | 4,619 | ||||||||||||||||||||||||||
| Timpany Plaza | $ | 79,858 | 7.3% | September 2028 | 11,415 | 11,527 | ||||||||||||||||||||||||||
| Village of Martinsville | $ | 89,664 | 4.3% | July 2029 | 13,849 | 14,313 | ||||||||||||||||||||||||||
| Laburnum Square | $ | 37,842 | 4.3% | September 2029 | 7,499 | 7,625 | ||||||||||||||||||||||||||
Rivergate (1) | $ | 100,222 | 4.3% | September 2031 | 16,605 | 17,091 | ||||||||||||||||||||||||||
| Convertible Notes | Interest only | 7.0% | December 2031 | 29,353 | 30,865 | |||||||||||||||||||||||||||
| June 2022 Term Loan | Interest only | 4.3% | July 2032 | 72,030 | 75,000 | |||||||||||||||||||||||||||
| JANAF | Interest only | 5.3% | July 2032 | 60,000 | 60,000 | |||||||||||||||||||||||||||
| October 2022 Cedar Term Loan | Interest only | 5.3% | November 2032 | 100,441 | 109,571 | |||||||||||||||||||||||||||
| Patuxent Crossing/Coliseum Marketplace | Interest only | 6.4% | January 2033 | 25,000 | 25,000 | |||||||||||||||||||||||||||
| May 2023 Term Loan 1 | $ | 373,981 | 6.2% | June 2033 | 60,744 | 61,100 | ||||||||||||||||||||||||||
| May 2023 Term Loan 2 | Interest only | 6.2% | June 2033 | 53,070 | 53,070 | |||||||||||||||||||||||||||
| June 2024 Term Loan | Interest only | 6.8% | July 2034 | 22,409 | 25,500 | |||||||||||||||||||||||||||
| Total Principal Balance | 482,841 | 499,531 | ||||||||||||||||||||||||||||||
| Unamortized deferred financing cost | (14,684) | (16,922) | ||||||||||||||||||||||||||||||
| Total Loans Payable, net | $ | 468,157 | $ | 482,609 | ||||||||||||||||||||||||||||
| Three Months Ended December 31, | Years Ended December 31, | Three Months Ended Changes | Years Ended Changes | ||||||||||||||||||||||||||||||||||||||||||||
| 2025 | 2024 | 2025 | 2024 | Dollar | Percent | Dollar | Percent | ||||||||||||||||||||||||||||||||||||||||
| Property debt interest - excluding Cedar debt | $ | 4,273 | $ | 4,403 | $ | 17,275 | $ | 17,118 | $ | (130) | (3.0) | % | $ | 157 | 0.9 | % | |||||||||||||||||||||||||||||||
Convertible Notes interest (1) | 1,340 | 1,561 | 3,859 | 4,133 | (221) | (14.2) | % | (274) | (6.6) | % | |||||||||||||||||||||||||||||||||||||
| Loan prepayment premium | 687 | — | 1,256 | 368 | 687 | n/a | 888 | 241.3 | % | ||||||||||||||||||||||||||||||||||||||
| Amortization of deferred financing costs | 656 | 516 | 2,694 | 2,673 | 140 | 27.1 | % | 21 | 0.8 | % | |||||||||||||||||||||||||||||||||||||
Variable-rate lines of credit (2) | 203 | — | 551 | — | 203 | n/a | 551 | n/a | |||||||||||||||||||||||||||||||||||||||
| Property debt interest - Cedar | 1,961 | 2,088 | 8,123 | 8,310 | (127) | (6.1) | % | (187) | (2.3) | % | |||||||||||||||||||||||||||||||||||||
| Total Interest Expense | $ | 9,120 | $ | 8,568 | $ | 33,758 | $ | 32,602 | $ | 552 | 6.4 | % | $ | 1,156 | 3.5 | % | |||||||||||||||||||||||||||||||
WHLR | Financial & Operating Data | as of 12/31/2025 unless otherwise stated | 18 | ||||
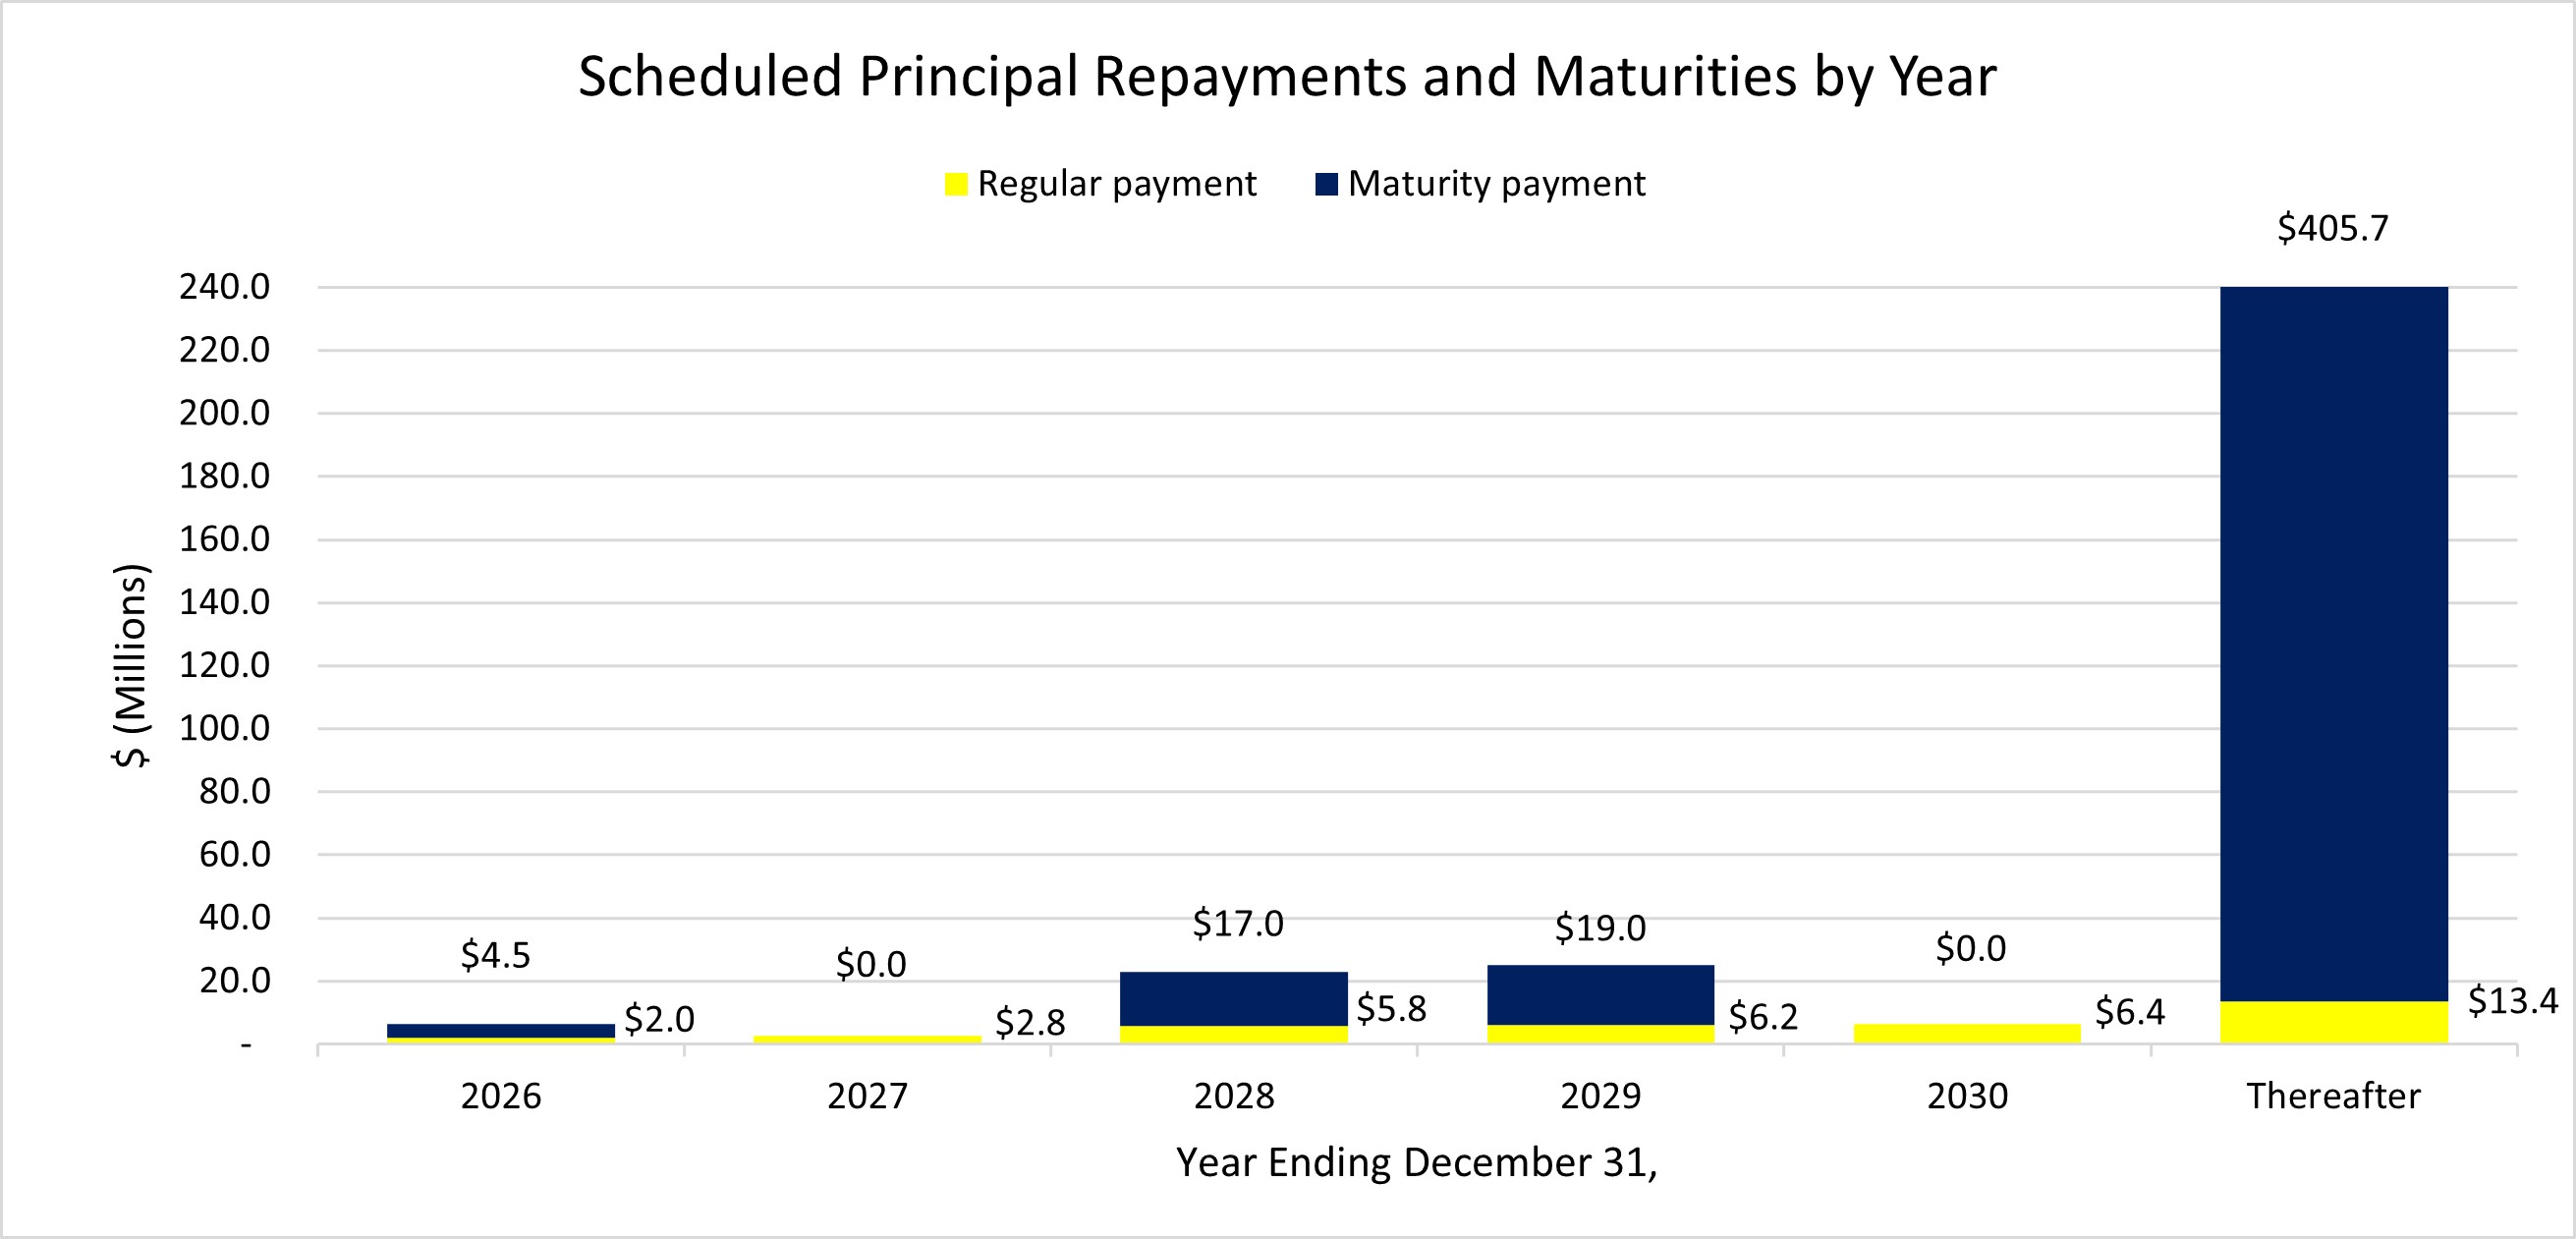
| Scheduled principal repayments and maturities by year | Amount | % Total Principal Payments and Maturities | ||||||||||||
| December 31, 2026 | $ | 6,450 | 1.3 | % | ||||||||||
| December 31, 2027 | 2,811 | 0.6 | % | |||||||||||
| December 31, 2028 | 22,824 | 4.7 | % | |||||||||||
| December 31, 2029 | 25,216 | 5.2 | % | |||||||||||
| December 31, 2030 | 6,387 | 1.3 | % | |||||||||||
| Thereafter | 419,153 | 86.9 | % | |||||||||||
| Total principal repayments and debt maturities | $ | 482,841 | 100.0 | % | ||||||||||
WHLR | Financial & Operating Data | as of 12/31/2025 unless otherwise stated | 19 | ||||
Property | Location | # of Tenants | Total Leasable SF | % Leased | % Occupied | Total SF Occupied | ABR (in 000's) | ABR per Occupied SF | ||||||||||||||||||||||||
| WHLR | ||||||||||||||||||||||||||||||||
| Alex City Marketplace | Alexander City, AL | 20 | 151,843 | 100.0 | % | 100.0 | % | 151,843 | $ | 1,341 | $ | 8.83 | ||||||||||||||||||||
| Beaver Ruin Village | Lilburn, GA | 27 | 74,038 | 91.4 | % | 91.4 | % | 67,637 | 1,317 | 19.47 | ||||||||||||||||||||||
| Beaver Ruin Village II | Lilburn, GA | 4 | 34,925 | 100.0 | % | 100.0 | % | 34,925 | 506 | 14.48 | ||||||||||||||||||||||
| Brook Run Shopping Center | Richmond, VA | 14 | 147,738 | 81.5 | % | 81.5 | % | 120,391 | 915 | 7.60 | ||||||||||||||||||||||
| Bryan Station | Lexington, KY | 9 | 54,277 | 94.5 | % | 94.5 | % | 51,275 | 629 | 12.27 | ||||||||||||||||||||||
| Cardinal Plaza | Henderson, NC | 10 | 50,000 | 100.0 | % | 100.0 | % | 50,000 | 541 | 10.81 | ||||||||||||||||||||||
| Chesapeake Square | Onley, VA | 13 | 108,982 | 90.9 | % | 90.9 | % | 99,006 | 774 | 7.81 | ||||||||||||||||||||||
| Clover Plaza | Clover, SC | 10 | 45,575 | 100.0 | % | 100.0 | % | 45,575 | 520 | 11.40 | ||||||||||||||||||||||
| Conyers Crossing | Conyers, GA | 14 | 170,475 | 100.0 | % | 100.0 | % | 170,475 | 1,103 | 6.47 | ||||||||||||||||||||||
| Crockett Square | Morristown, TN | 4 | 107,122 | 100.0 | % | 100.0 | % | 107,122 | 993 | 9.27 | ||||||||||||||||||||||
| Cypress Shopping Center | Boiling Springs, SC | 19 | 80,435 | 100.0 | % | 100.0 | % | 80,435 | 817 | 10.16 | ||||||||||||||||||||||
| Darien Shopping Center | Darien, GA | 1 | 26,001 | 100.0 | % | 100.0 | % | 26,001 | 140 | 5.38 | ||||||||||||||||||||||
| Folly Road | Charleston, SC | 5 | 47,794 | 100.0 | % | 100.0 | % | 47,794 | 780 | 16.31 | ||||||||||||||||||||||
| Forrest Gallery | Tullahoma, TN | 28 | 214,451 | 91.2 | % | 91.2 | % | 195,642 | 1,523 | 7.78 | ||||||||||||||||||||||
| Fort Howard Shopping Center | Rincon, GA | 20 | 113,652 | 100.0 | % | 100.0 | % | 113,652 | 1,319 | 11.60 | ||||||||||||||||||||||
| Freeway Junction | Stockbridge, GA | 17 | 156,834 | 97.3 | % | 97.3 | % | 152,543 | 1,411 | 9.25 | ||||||||||||||||||||||
| Franklin Village | Kittanning, PA | 22 | 151,821 | 72.9 | % | 72.9 | % | 110,619 | 1,228 | 11.10 | ||||||||||||||||||||||
| Franklinton Square | Franklinton, NC | 14 | 65,366 | 95.3 | % | 95.3 | % | 62,300 | 617 | 9.91 | ||||||||||||||||||||||
| Georgetown | Georgetown, SC | 1 | 29,572 | 74.5 | % | 74.5 | % | 22,032 | 215 | 9.75 | ||||||||||||||||||||||
| Grove Park Shopping Center | Orangeburg, SC | 14 | 93,265 | 94.8 | % | 94.8 | % | 88,375 | 736 | 8.33 | ||||||||||||||||||||||
| Harrodsburg Marketplace | Harrodsburg, KY | 9 | 60,048 | 94.0 | % | 94.0 | % | 56,448 | 501 | 8.88 | ||||||||||||||||||||||
| JANAF | Norfolk, VA | 110 | 796,624 | 90.6 | % | 89.8 | % | 715,712 | 9,851 | 13.76 | ||||||||||||||||||||||
| Laburnum Square | Richmond, VA | 20 | 109,387 | 97.4 | % | 97.4 | % | 106,587 | 1,055 | 9.90 | ||||||||||||||||||||||
| Ladson Crossing | Ladson, SC | 16 | 52,607 | 100.0 | % | 100.0 | % | 52,607 | 575 | 10.94 | ||||||||||||||||||||||
| LaGrange Marketplace | LaGrange, GA | 13 | 76,594 | 92.2 | % | 92.2 | % | 70,600 | 486 | 6.88 | ||||||||||||||||||||||
| Lake Greenwood Crossing | Greenwood, SC | 8 | 43,618 | 100.0 | % | 100.0 | % | 43,618 | 417 | 9.56 | ||||||||||||||||||||||
| Litchfield Market Village | Pawleys Island, SC | 27 | 86,717 | 100.0 | % | 100.0 | % | 86,717 | 1,227 | 14.15 | ||||||||||||||||||||||
| Lumber River Village | Lumberton, NC | 11 | 66,781 | 100.0 | % | 100.0 | % | 66,781 | 526 | 7.88 | ||||||||||||||||||||||
| Moncks Corner | Moncks Corner, SC | 1 | 26,800 | 100.0 | % | 100.0 | % | 26,800 | 330 | 12.31 | ||||||||||||||||||||||
| Nashville Commons | Nashville, NC | 12 | 56,100 | 100.0 | % | 100.0 | % | 56,100 | 695 | 12.38 | ||||||||||||||||||||||
| New Market Crossing | Mt. Airy, NC | 13 | 117,076 | 100.0 | % | 100.0 | % | 117,076 | 1,069 | 9.13 | ||||||||||||||||||||||
| Parkway Plaza | Brunswick, GA | 5 | 52,365 | 84.8 | % | 84.8 | % | 44,385 | 485 | 10.93 | ||||||||||||||||||||||
| Pierpont Centre | Morgantown, WV | 15 | 111,162 | 98.4 | % | 98.4 | % | 109,433 | 1,182 | 10.80 | ||||||||||||||||||||||
| Port Crossing | Harrisonburg, VA | 8 | 65,365 | 100.0 | % | 100.0 | % | 65,365 | 876 | 13.40 | ||||||||||||||||||||||
| Ridgeland | Ridgeland, SC | 1 | 20,029 | 100.0 | % | 100.0 | % | 20,029 | 140 | 7.00 | ||||||||||||||||||||||
| Riverbridge Shopping Center | Carrollton, GA | 11 | 91,188 | 96.9 | % | 96.9 | % | 88,375 | 767 | 8.68 | ||||||||||||||||||||||
| Rivergate Shopping Center | Macon, GA | 25 | 193,960 | 93.6 | % | 68.9 | % | 133,688 | 2,401 | 17.96 | ||||||||||||||||||||||
| Sangaree Plaza | Summerville, SC | 10 | 66,948 | 100.0 | % | 100.0 | % | 66,948 | 761 | 11.36 | ||||||||||||||||||||||
| Shoppes at Myrtle Park | Bluffton, SC | 14 | 56,609 | 99.3 | % | 99.3 | % | 56,189 | 709 | 12.62 | ||||||||||||||||||||||
| South Park | Mullins, SC | 4 | 60,734 | 96.9 | % | 96.9 | % | 58,834 | 401 | 6.82 | ||||||||||||||||||||||
| South Square | Lancaster, SC | 6 | 44,350 | 81.0 | % | 81.0 | % | 35,900 | 313 | 8.71 | ||||||||||||||||||||||
| St. George Plaza | St. George, SC | 9 | 59,174 | 100.0 | % | 100.0 | % | 59,174 | 493 | 8.34 | ||||||||||||||||||||||
| Sunshine Plaza | Lehigh Acres, FL | 22 | 111,189 | 100.0 | % | 100.0 | % | 111,189 | 1,175 | 10.57 | ||||||||||||||||||||||
| Surrey Plaza | Hawkinsville, GA | 4 | 42,680 | 100.0 | % | 100.0 | % | 42,680 | 267 | 6.26 | ||||||||||||||||||||||
| Tampa Festival | Tampa, FL | 22 | 141,580 | 100.0 | % | 100.0 | % | 141,580 | 1,327 | 9.37 | ||||||||||||||||||||||
| Tuckernuck | Richmond, VA | 18 | 93,391 | 100.0 | % | 98.9 | % | 92,391 | 1,110 | 12.01 | ||||||||||||||||||||||
| Twin City Commons | Batesburg-Leesville, SC | 5 | 47,680 | 100.0 | % | 100.0 | % | 47,680 | 491 | 10.31 | ||||||||||||||||||||||
| Village of Martinsville | Martinsville, VA | 22 | 288,254 | 100.0 | % | 94.8 | % | 273,297 | 2,284 | 8.36 | ||||||||||||||||||||||
| Waterway Plaza | Little River, SC | 10 | 49,750 | 100.0 | % | 100.0 | % | 49,750 | 560 | 11.25 | ||||||||||||||||||||||
| Westland Square | West Columbia, SC | 12 | 62,735 | 100.0 | % | 100.0 | % | 62,735 | 550 | 8.76 | ||||||||||||||||||||||
| WHLR TOTAL | 729 | 5,075,661 | 95.1 | % | 93.7 | % | 4,756,310 | $ | 50,449 | $ | 10.61 | |||||||||||||||||||||
WHLR | Financial & Operating Data | as of 12/31/2025 unless otherwise stated | 20 | ||||
Property | Location | # of Tenants | Total Leasable SF | % Leased | % Occupied | Total SF Occupied | ABR (in 000's) | ABR per Occupied SF | ||||||||||||||||||||||||
| CDR | ||||||||||||||||||||||||||||||||
| Brickyard Plaza | Berlin, CT | 11 | 227,598 | 100.0 | % | 100.0 | % | 227,598 | $ | 2,106 | $ | 9.25 | ||||||||||||||||||||
| Coliseum Marketplace | Hampton, VA | 10 | 106,648 | 100.0 | % | 100.0 | % | 106,648 | 1,301 | 12.20 | ||||||||||||||||||||||
| Fairview Commons | New Cumberland, PA | 10 | 50,485 | 80.3 | % | 80.3 | % | 40,555 | 514 | 12.66 | ||||||||||||||||||||||
| Gold Star Plaza | Shenandoah, PA | 6 | 71,720 | 97.8 | % | 97.8 | % | 70,120 | 664 | 9.46 | ||||||||||||||||||||||
| Golden Triangle | Lancaster, PA | 19 | 202,790 | 90.0 | % | 90.0 | % | 182,440 | 2,780 | 15.24 | ||||||||||||||||||||||
| Hamburg Square | Hamburg, PA | 7 | 102,058 | 100.0 | % | 100.0 | % | 102,058 | 735 | 7.20 | ||||||||||||||||||||||
| Patuxent Crossing | California, MD | 27 | 264,068 | 78.2 | % | 78.2 | % | 206,609 | 1,866 | 9.03 | ||||||||||||||||||||||
| Pine Grove Plaza | Brown Mills, NJ | 17 | 79,306 | 89.9 | % | 89.9 | % | 71,306 | 886 | 12.43 | ||||||||||||||||||||||
| Southington Center | Southington, CT | 7 | 155,842 | 89.8 | % | 89.8 | % | 139,903 | 1,000 | 7.15 | ||||||||||||||||||||||
| Timpany Plaza | Gardner, MA | 18 | 182,820 | 82.9 | % | 82.9 | % | 151,460 | 1,571 | 10.37 | ||||||||||||||||||||||
| Trexler Mall | Trexlertown, PA | 24 | 342,541 | 99.7 | % | 99.7 | % | 341,544 | 4,016 | 11.76 | ||||||||||||||||||||||
| Washington Center Shoppes | Sewell, NJ | 31 | 157,300 | 98.1 | % | 98.1 | % | 154,300 | 2,120 | 13.74 | ||||||||||||||||||||||
| CDR TOTAL | 187 | 1,943,176 | 92.4 | % | 92.4 | % | 1,794,541 | $ | 19,559 | $ | 10.90 | |||||||||||||||||||||
| COMBINED TOTAL | 916 | 7,018,837 | 94.3 | % | 93.3 | % | 6,550,851 | $ | 70,008 | $ | 10.69 | |||||||||||||||||||||
| Undeveloped Land | Company | Location | Parcel Size (in acres) | |||||||||||||||||
| Brook Run Properties | WHLR | Richmond, VA | 2.00 | |||||||||||||||||
| Courtland Commons | WHLR | Courtland, VA | 1.04 | |||||||||||||||||
| St. George Land | WHLR | St. George, SC | 2.51 | |||||||||||||||||
| South Philadelphia parcel | CDR | Philadelphia, PA | 1.35 | |||||||||||||||||
| Three Months Ended | ||||||||||||||||||||||||||||||||
| December 31, 2025 | September 30, 2025 | June 30, 2025 | March 31, 2025 | December 31, 2024 | ||||||||||||||||||||||||||||
| Number of Centers | 62 | 66 | 66 | 69 | 72 | |||||||||||||||||||||||||||
| Leasable Square Feet | 7,018,837 | 7,436,018 | 7,436,018 | 7,517,677 | 7,660,979 | |||||||||||||||||||||||||||
| Percentage Leased | 94.3% | 92.4% | 92.0% | 92.0% | 93.1% | |||||||||||||||||||||||||||
| Percentage Occupied | 93.3% | 91.8% | 91.6% | 91.3% | 92.3% | |||||||||||||||||||||||||||
| ABR (in 000's) | $70,008 | $72,104 | $71,606 | $71,757 | $73,448 | |||||||||||||||||||||||||||
| Renewal Rent Spread | 11.2% | 10.6% | 12.9% | 12.5% | 14.5% | |||||||||||||||||||||||||||
| New Rent Spread | 30.4% | 19.7% | 14.2% | 38.1% | 52.5% | |||||||||||||||||||||||||||
| Capital and Tenant Improvements (in 000's) | $4,563 | $6,335 | $4,131 | $2,077 | $3,868 | |||||||||||||||||||||||||||
WHLR | Financial & Operating Data | as of 12/31/2025 unless otherwise stated | 21 | ||||
 |  | ||||
 |  | ||||
WHLR | Financial & Operating Data | as of 12/31/2025 unless otherwise stated | 22 | ||||
| Tenants | Category | Annualized Base Rent ($ in 000s) | % of Total Annualized Base Rent | Total Occupied Square Feet | Percent Total Leasable Square Feet | Annualized Base Rent Per Occupied Square Foot | |||||||||||||||||||||||||||||||||||
| Food Lion | Grocery | $ | 4,179 | 6.0 | % | 484,000 | 6.9 | % | $ | 8.63 | |||||||||||||||||||||||||||||||
Kroger Co (1) | Grocery | 2,137 | 3.1 | % | 239,000 | 3.4 | % | 8.94 | |||||||||||||||||||||||||||||||||
| Dollar Tree | Discount Retailer | 1,440 | 2.1 | % | 177,000 | 2.5 | % | 8.14 | |||||||||||||||||||||||||||||||||
| Planet Fitness | Gym | 1,268 | 1.8 | % | 134,000 | 1.9 | % | 9.46 | |||||||||||||||||||||||||||||||||
TJX Companies (2) | Discount Retailer | 1,245 | 1.8 | % | 195,000 | 2.8 | % | 6.38 | |||||||||||||||||||||||||||||||||
Lowes Foods (3) | Grocery | 1,236 | 1.8 | % | 130,000 | 1.9 | % | 9.51 | |||||||||||||||||||||||||||||||||
| Piggly Wiggly | Grocery | 1,183 | 1.7 | % | 135,000 | 1.9 | % | 8.76 | |||||||||||||||||||||||||||||||||
Aldi (4) | Grocery | 1,072 | 1.5 | % | 106,000 | 1.5 | % | 10.11 | |||||||||||||||||||||||||||||||||
| Kohl's | Discount Retailer | 1,049 | 1.5 | % | 147,000 | 2.1 | % | 7.14 | |||||||||||||||||||||||||||||||||
| Lehigh Valley Health | Health | 819 | 1.2 | % | 43,000 | 0.6 | % | 19.05 | |||||||||||||||||||||||||||||||||
| $ | 15,628 | 22.5 | % | 1,790,000 | 25.5 | % | $ | 8.73 | |||||||||||||||||||||||||||||||||
| Lease Expiration Period | Number of Expiring Leases | Total Expiring Square Footage | % of Total Expiring Square Footage | % of Total Occupied Square Footage Expiring | Expiring Annualized Base Rent (in 000s) | % of Total Annualized Base Rent | Expiring Base Rent Per Occupied Square Foot | |||||||||||||||||||||||||||||||||||||
| Available | — | 467,986 | 6.7 | % | — | % | $ | — | — | % | $ | — | ||||||||||||||||||||||||||||||||
| MTM | 11 | 16,648 | 0.2 | % | 0.3 | % | 240 | 0.3 | % | 14.42 | ||||||||||||||||||||||||||||||||||
| 2026 | 113 | 501,955 | 7.2 | % | 7.7 | % | 5,700 | 8.1 | % | 11.36 | ||||||||||||||||||||||||||||||||||
| 2027 | 160 | 672,461 | 9.6 | % | 10.3 | % | 8,237 | 11.8 | % | 12.25 | ||||||||||||||||||||||||||||||||||
| 2028 | 151 | 1,062,417 | 15.1 | % | 16.2 | % | 10,138 | 14.5 | % | 9.54 | ||||||||||||||||||||||||||||||||||
| 2029 | 142 | 883,802 | 12.6 | % | 13.5 | % | 9,996 | 14.3 | % | 11.31 | ||||||||||||||||||||||||||||||||||
| 2030 | 130 | 1,198,083 | 17.1 | % | 18.3 | % | 11,074 | 15.8 | % | 9.24 | ||||||||||||||||||||||||||||||||||
| 2031 | 73 | 695,611 | 9.9 | % | 10.6 | % | 7,633 | 10.9 | % | 10.97 | ||||||||||||||||||||||||||||||||||
| 2032 | 34 | 421,972 | 6.0 | % | 6.4 | % | 3,904 | 5.6 | % | 9.25 | ||||||||||||||||||||||||||||||||||
| 2033 | 21 | 251,521 | 3.6 | % | 3.8 | % | 2,844 | 4.1 | % | 11.31 | ||||||||||||||||||||||||||||||||||
| 2034 | 33 | 338,791 | 4.8 | % | 5.2 | % | 3,675 | 5.3 | % | 10.85 | ||||||||||||||||||||||||||||||||||
| 2035 & thereafter | 48 | 507,590 | 7.2 | % | 7.7 | % | 6,567 | 9.3 | % | 12.94 | ||||||||||||||||||||||||||||||||||
| Total | 916 | 7,018,837 | 100.0 | % | 100.0 | % | $ | 70,008 | 100.0 | % | $ | 10.69 | ||||||||||||||||||||||||||||||||
WHLR | Financial & Operating Data | as of 12/31/2025 unless otherwise stated | 23 | ||||
| No Option | Option | ||||||||||||||||||||||||||||||||||
| Lease Expiration Period | Number of Expiring Leases | Expiring Occupied Square Footage | Expiring Annualized Based Rent (in 000s) | % of Total Annualized Base Rent | Expiring Base Rent per Square Foot | Number of Expiring Leases | Expiring Occupied Square Footage | Expiring Annualized Based Rent (in 000s) | % of Total Annualized Base Rent | Expiring Base Rent per Square Foot | |||||||||||||||||||||||||
| Available | — | 63,174 | $ | — | — | % | $ | — | — | — | $ | — | — | % | $ | — | |||||||||||||||||||
| MTM | — | — | — | — | % | — | — | — | — | — | % | — | |||||||||||||||||||||||
| 2026 | 2 | 42,321 | 533 | 20.3 | % | 12.59 | 6 | 214,883 | 1,517 | 5.4 | % | 7.06 | |||||||||||||||||||||||
| 2027 | 2 | 49,769 | 459 | 17.5 | % | 9.22 | 5 | 149,546 | 1,221 | 4.4 | % | 8.16 | |||||||||||||||||||||||
| 2028 | 2 | 55,876 | 241 | 9.2 | % | 4.31 | 16 | 637,301 | 4,187 | 14.9 | % | 6.57 | |||||||||||||||||||||||
| 2029 | 2 | 48,789 | 517 | 19.7 | % | 10.60 | 11 | 380,008 | 3,063 | 10.9 | % | 8.06 | |||||||||||||||||||||||
| 2030 | — | — | — | — | % | — | 17 | 851,248 | 5,396 | 19.2 | % | 6.34 | |||||||||||||||||||||||
| 2031 | 1 | 20,858 | 60 | 2.3 | % | — | 11 | 418,970 | 4,045 | 14.4 | % | 9.65 | |||||||||||||||||||||||
| 2032 | — | — | — | — | % | — | 9 | 289,853 | 1,993 | 7.1 | % | 6.88 | |||||||||||||||||||||||
| 2033 | 1 | 43,416 | 819 | 31.0 | % | — | 4 | 152,484 | 1,152 | 4.1 | % | 7.55 | |||||||||||||||||||||||
| 2034 | — | — | — | — | % | — | 7 | 256,453 | 2,159 | 7.7 | % | 8.42 | |||||||||||||||||||||||
| 2035 & thereafter | — | — | — | — | % | — | 10 | 375,632 | 3,329 | 11.9 | % | 8.86 | |||||||||||||||||||||||
| Total | 10 | 324,203 | $ | 2,629 | 100.0 | % | $ | 10.07 | 96 | 3,726,378 | $ | 28,062 | 100.0 | % | $ | 7.53 | |||||||||||||||||||
| No Option | Option | ||||||||||||||||||||||||||||||||||
| Lease Expiration Period | Number of Expiring Leases | Expiring Occupied Square Footage | Expiring Annualized Based Rent (in 000s) | % of Total Annualized Base Rent | Expiring Base Rent per Square Foot | Number of Expiring Leases | Expiring Occupied Square Footage | Expiring Annualized Based Rent (in 000s) | % of Total Annualized Base Rent | Expiring Base Rent per Square Foot | |||||||||||||||||||||||||
| Available | — | 404,812 | $ | — | — | % | $ | — | — | — | $ | — | — | % | $ | — | |||||||||||||||||||
| MTM | 8 | 16,648 | 213 | 1.1 | % | 12.79 | 3 | — | 27 | 0.1 | % | — | |||||||||||||||||||||||
| 2026 | 76 | 155,902 | 2,135 | 11.1 | % | 13.69 | 29 | 88,849 | 1,515 | 7.5 | % | 17.05 | |||||||||||||||||||||||
| 2027 | 110 | 268,597 | 4,233 | 22.0 | % | 15.76 | 43 | 204,549 | 2,324 | 11.6 | % | 11.36 | |||||||||||||||||||||||
| 2028 | 84 | 192,241 | 3,071 | 16.0 | % | 15.97 | 49 | 176,999 | 2,639 | 13.1 | % | 14.91 | |||||||||||||||||||||||
| 2029 | 74 | 216,560 | 3,239 | 16.8 | % | 14.96 | 55 | 238,445 | 3,177 | 15.8 | % | 13.32 | |||||||||||||||||||||||
| 2030 | 71 | 150,794 | 2,765 | 14.4 | % | 18.34 | 42 | 196,041 | 2,913 | 14.5 | % | 14.86 | |||||||||||||||||||||||
| 2031 | 28 | 75,768 | 1,201 | 6.2 | % | 15.85 | 33 | 180,015 | 2,327 | 11.6 | % | 12.93 | |||||||||||||||||||||||
| 2032 | 13 | 35,707 | 555 | 2.9 | % | 15.54 | 12 | 96,412 | 1,356 | 6.7 | % | 14.06 | |||||||||||||||||||||||
| 2033 | 9 | 16,108 | 280 | 1.5 | % | 17.38 | 7 | 39,513 | 593 | 3.0 | % | 15.01 | |||||||||||||||||||||||
| 2034 | 14 | 35,274 | 663 | 3.4 | % | 18.80 | 12 | 47,064 | 853 | 4.2 | % | 18.12 | |||||||||||||||||||||||
| 2035 & thereafter | 13 | 30,683 | 872 | 4.6 | % | 28.42 | 25 | 101,275 | 2,366 | 11.9 | % | 23.36 | |||||||||||||||||||||||
| Total | 500 | 1,599,094 | $ | 19,227 | 100.0 | % | $ | 16.10 | 310 | 1,369,162 | $ | 20,090 | 100.0 | % | $ | 14.67 | |||||||||||||||||||
WHLR | Financial & Operating Data | as of 12/31/2025 unless otherwise stated | 24 | ||||
| WHLR Leasing Renewals and New Leases | | |||||||||||||
| Three Months Ended December 31, | Years Ended December 31, | ||||||||||||||||||||||
| 2025 | 2024 | 2025 | 2024 | ||||||||||||||||||||
Renewals(1): | |||||||||||||||||||||||
| Leases renewed with rate increase (sq feet) | 133,144 | 128,801 | 438,406 | 577,006 | |||||||||||||||||||
| Leases renewed with rate decrease (sq feet) | — | — | — | 41,985 | |||||||||||||||||||
| Leases renewed with no rate change (sq feet) | — | 11,041 | 152,586 | 136,446 | |||||||||||||||||||
| Total leases renewed (sq feet) | 133,144 | 139,842 | 590,992 | 755,437 | |||||||||||||||||||
| Leases renewed with rate increase (count) | 28 | 27 | 110 | 128 | |||||||||||||||||||
| Leases renewed with rate decrease (count) | — | — | — | 2 | |||||||||||||||||||
| Leases renewed with no rate change (count) | — | 1 | 7 | 8 | |||||||||||||||||||
| Total leases renewed (count) | 28 | 28 | 117 | 138 | |||||||||||||||||||
| Option exercised (count) | 8 | 5 | 23 | 26 | |||||||||||||||||||
| Weighted average on rate increases (per sq foot) | $ | 1.23 | $ | 1.48 | $ | 1.70 | $ | 1.23 | |||||||||||||||
| Weighted average on rate decreases (per sq foot) | $ | — | $ | — | $ | — | $ | (0.65) | |||||||||||||||
| Weighted average rate on all renewals (per sq foot) | $ | 1.23 | $ | 1.36 | $ | 1.26 | $ | 0.91 | |||||||||||||||
| Weighted average change over prior rates | 11.0 | % | 11.4 | % | 12.0 | % | 8.8 | % | |||||||||||||||
New Leases(1) (2): | |||||||||||||||||||||||
| New leases (sq feet) | 96,347 | 24,025 | 200,575 | 162,206 | |||||||||||||||||||
| New leases (count) | 12 | 7 | 35 | 36 | |||||||||||||||||||
| Weighted average rate (per sq foot) | $ | 11.97 | $ | 14.91 | $ | 13.01 | $ | 13.84 | |||||||||||||||
| New Rent Spread | 30.4 | % | 37.8 | % | 33.6 | % | 31.5 | % | |||||||||||||||
WHLR | Financial & Operating Data | as of 12/31/2025 unless otherwise stated | 25 | ||||
| CDR Leasing Renewals and New Leases | | |||||||||||||
| Three Months Ended December 31, | Years Ended December 31, | ||||||||||||||||||||||
| 2025 | 2024 | 2025 | 2024 | ||||||||||||||||||||
Renewals(1): | |||||||||||||||||||||||
| Leases renewed with rate increase (sq feet) | 14,861 | 41,230 | 203,979 | 191,280 | |||||||||||||||||||
| Leases renewed with rate decrease (sq feet) | — | — | — | 1,375 | |||||||||||||||||||
| Leases renewed with no rate change (sq feet) | 2,200 | 5,400 | 5,222 | 21,058 | |||||||||||||||||||
| Total leases renewed (sq feet) | 17,061 | 46,630 | 209,201 | 213,713 | |||||||||||||||||||
| Leases renewed with rate increase (count) | 4 | 8 | 25 | 28 | |||||||||||||||||||
| Leases renewed with rate decrease (count) | — | — | — | 1 | |||||||||||||||||||
| Leases renewed with no rate change (count) | 1 | 1 | 3 | 3 | |||||||||||||||||||
| Total leases renewed (count) | 5 | 9 | 28 | 32 | |||||||||||||||||||
| Option exercised (count) | — | 2 | 10 | 8 | |||||||||||||||||||
| Weighted average on rate increases (per sq foot) | $ | 2.67 | $ | 3.57 | $ | 1.10 | $ | 1.72 | |||||||||||||||
| Weighted average on rate decreases (per sq foot) | $ | — | $ | — | $ | — | $ | (7.32) | |||||||||||||||
| Weighted average rate on all renewals (per sq foot) | $ | 2.33 | $ | 3.15 | $ | 1.07 | $ | 1.50 | |||||||||||||||
| Weighted average change over prior rates | 12.4 | % | 22.3 | % | 10.9 | % | 11.3 | % | |||||||||||||||
New Leases(1) (2): | |||||||||||||||||||||||
| New leases (sq feet) | — | 9,976 | 51,799 | 68,747 | |||||||||||||||||||
| New leases (count) | — | 5 | 9 | 19 | |||||||||||||||||||
| Weighted average rate (per sq foot) | $ | — | $ | 31.31 | $ | 13.22 | $ | 15.92 | |||||||||||||||
| New Rent Spread | — | % | 79.7 | % | 4.9 | % | 3.9 | % | |||||||||||||||
WHLR | Financial & Operating Data | as of 12/31/2025 unless otherwise stated | 26 | ||||