| | | | | |
| Table of Contents | |
| Page |
| Company Overview | |
| Financial and Portfolio Overview | |
| Financial and Operating Results | |
| Financial Summary | |
| Consolidated Balance Sheets | |
| Consolidated Statements of Operations | |
| Reconciliation of Non-GAAP Measures | |
| Debt Summary | |
| Portfolio Summary | |
| Property Summary | |
| Top Ten Tenants by Annualized Base Rent and Lease Expiration Schedules | |
| Leasing Summary | |
| Definitions | |
Forward-Looking Statements
This document contains forward-looking statements that are within the meaning of Section 27A of the Securities Act of 1933, as amended, and Section 21E of the Securities Exchange Act of 1934, as amended, and such statements are intended to be covered by the safe harbor. When used in this presentation, the words "continue," "may," "approximately," "potentially," or similar expressions, are intended to identify forward-looking statements. These forward-looking statements are based on current expectations, forecasts and assumptions that involve risks and uncertainties that could cause actual outcomes and results to differ materially. These risks include, without limitation: the adverse effect of any future pandemic, endemic or outbreak of infectious disease, and mitigation efforts to control their spread, the use of and demand for retail space; the level of rental revenue we achieve from our assets and our ability to collect rents; the state of the U.S. economy generally, or specifically in the Southeast, Mid-Atlantic and Northeast where our properties are geographically concentrated; consumer spending and confidence trends; tenant bankruptcies; availability, terms and deployment of capital; anticipated substantial dilution of our common stock, and steep decline in their market value, after September 21, 2023 that may result from the exercise by the holders of our Series D Cumulative Convertible Preferred Stock of their redemption rights; the degree and nature of our competition; changes in governmental regulations, accounting rules, tax rates and similar matters; the ability and willingness of the tenants of Wheeler Real Estate Trust, Inc. (the "Company" or "WHLR") and other third parties to satisfy their obligations under their respective contractual arrangements with the Company; the ability and willingness of the Company's tenants of to renew their leases with the Company upon expiration, the Company’s ability to re-lease its properties on the similar or better terms in the event of nonrenewal or in the event the Company exercises its right to replace an existing tenant, and obligations the Company may incur in connection with the replacement of an existing tenant; litigation risks; increases in the Company’s financing and other costs as a result of changes in interest rates and other factors; The Company’s ability to maintain listing on Nasdaq Capital Market and the effects of the one-for-ten reverse stock split announced on August 7, 2023 on our price per share and the trading market of our common stock; inability to successfully integrate the acquisition of Cedar Realty Trust, Inc.; changes in our ability to obtain and maintain financing; damage to the Company’s properties from catastrophic weather and other natural events, and the physical effects of climate change; information technology security breaches; the Company’s ability and
| | | | | |
WHLR | Financial & Operating Data | 2 |
willingness to maintain its qualification as a real estate investment trust (“REIT”); the ability of our operating partnership, Wheeler REIT, L.P. and each of our other partnerships and limited liability companies to be classified as partnerships or disregarded entities for federal income tax purposes; the impact of e-commerce on our tenants’ business; and inability to generate sufficient cash flows due to market conditions, competition, uninsured losses, changes in tax or other applicable laws.
The forward-looking statements are based on management's beliefs, assumptions and expectations of future performance, taking into account all information currently available to the Company. Forward-looking statements are not predictions of future events. For a description of the risks and uncertainties that could impact the Company's future results, performance or transactions, see the reports filed by the Company with the Securities and Exchange Commission, including its quarterly reports on Form 10-Q and annual reports on Form 10-K. The Company disclaims any responsibility to update or revise any forward-looking statements, whether as a result of new information, future events or otherwise.
| | | | | |
WHLR | Financial & Operating Data | 3 |
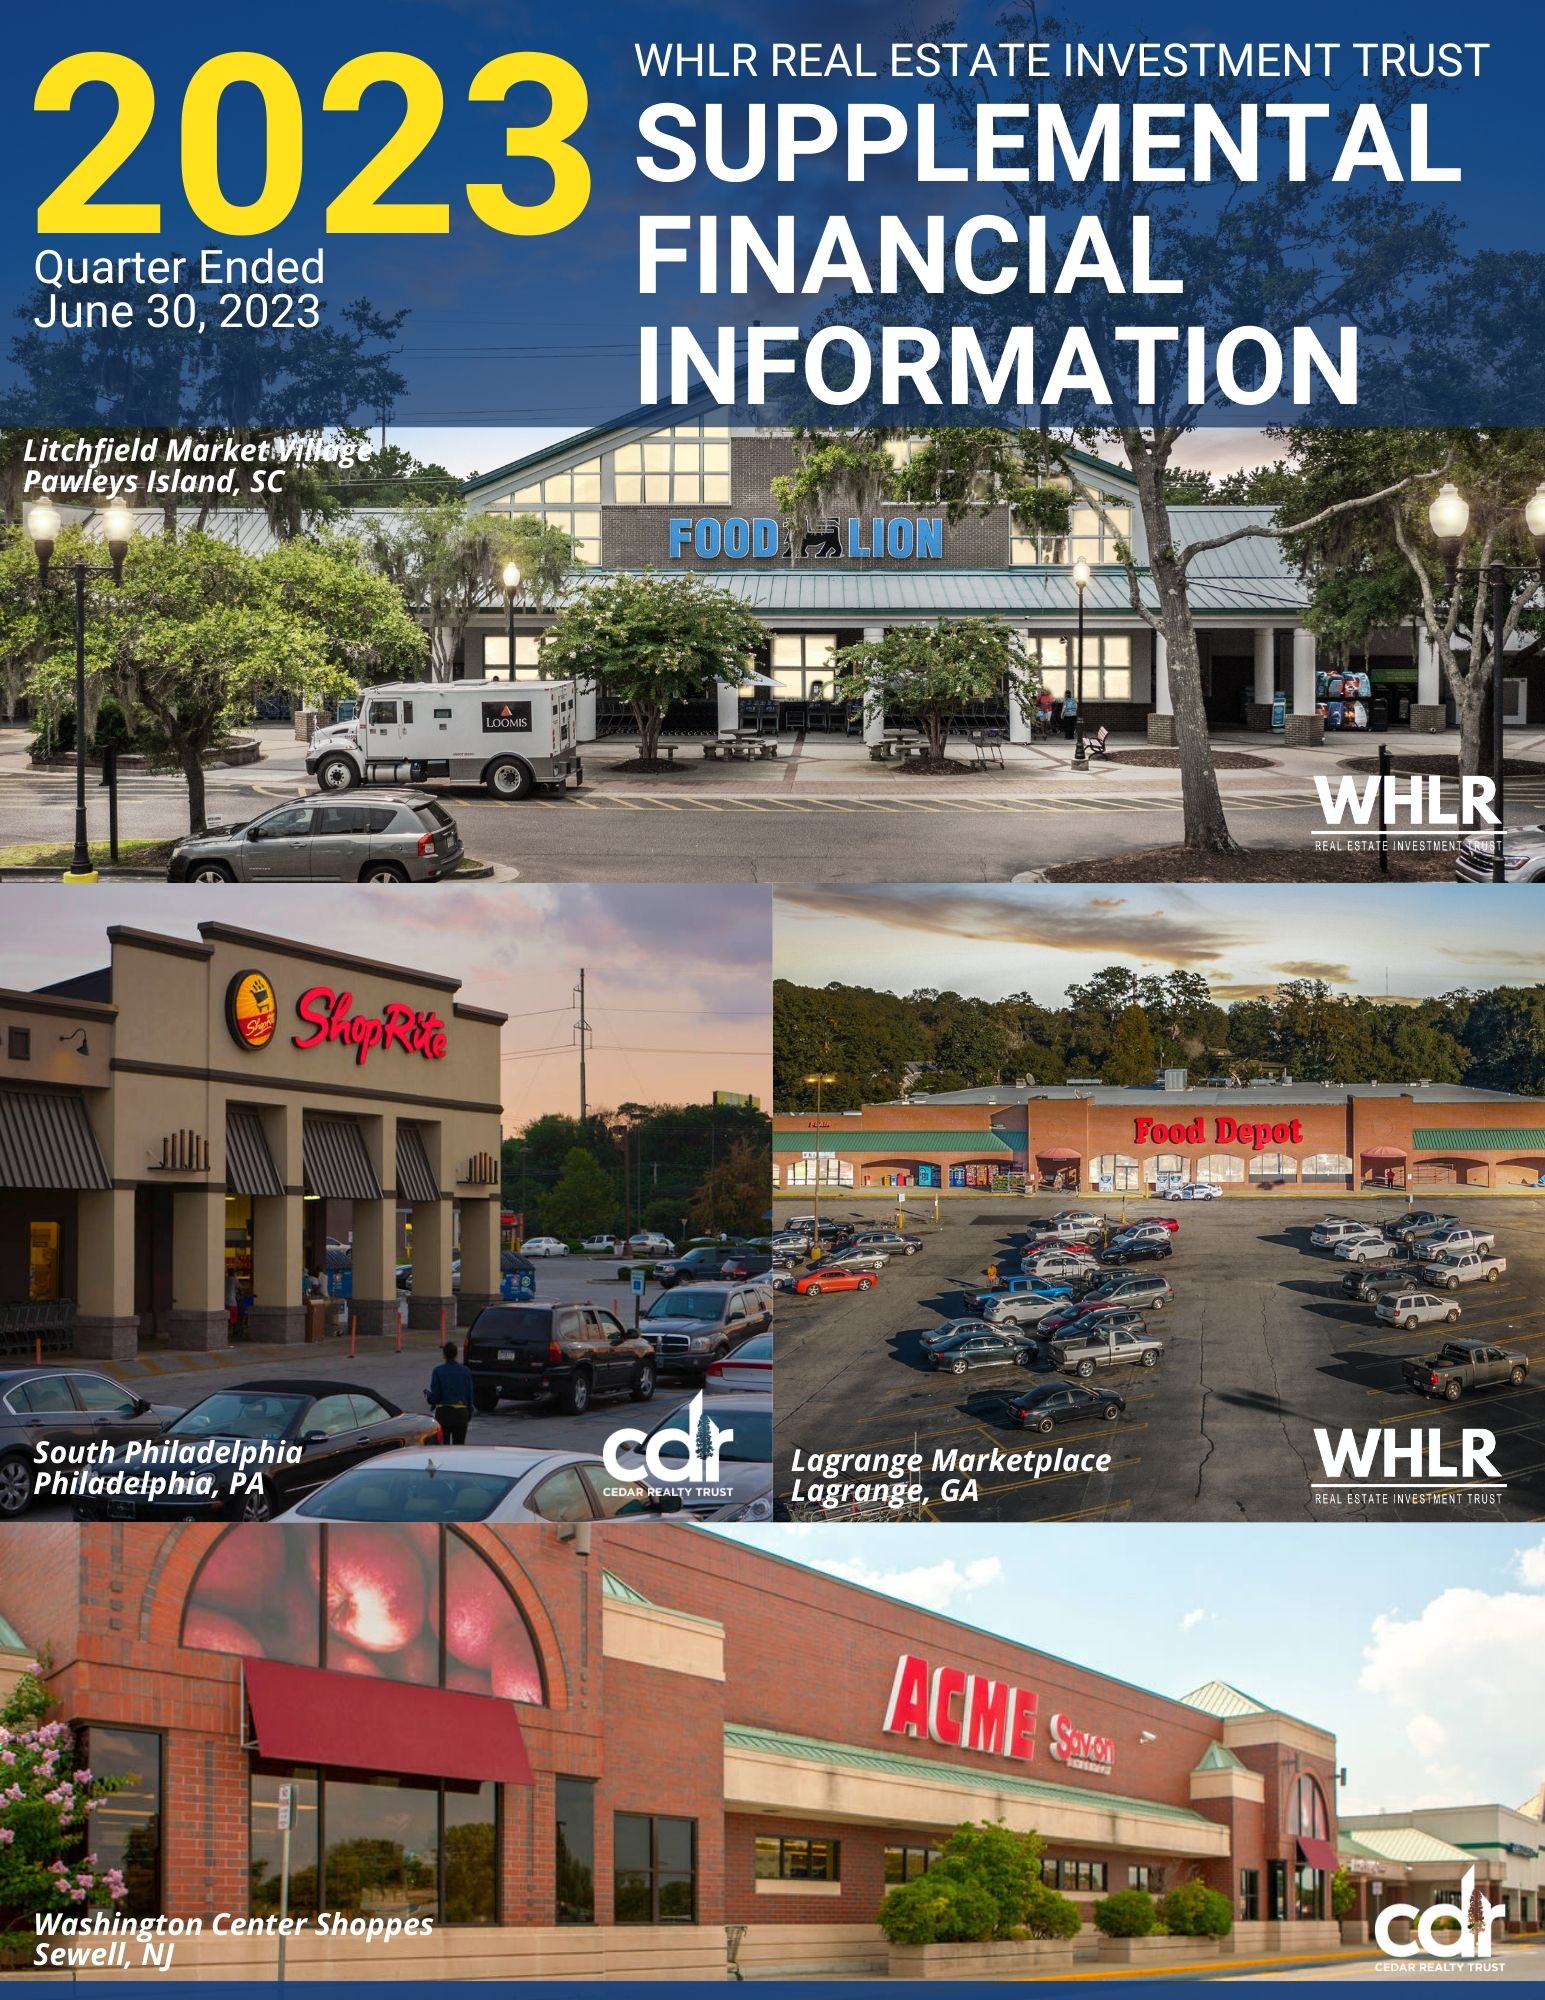
Company Overview
Headquartered in Virginia Beach, Virginia, Wheeler Real Estate Investment Trust, Inc. (NASDAQ: WHLR) is a fully-integrated, self-managed commercial real estate investment company focused on owning, leasing and operating income-producing retail properties with a primary focus on grocery-anchored centers. WHLR’s portfolio contains well-located, potentially dominant retail properties in secondary and tertiary markets that generate attractive, risk-adjusted returns. WHLR’s common stock, Series B convertible preferred stock, Series D cumulative convertible preferred stock, and 7% Subordinated Convertible Notes due 2031, trade publicly on NASDAQ under the symbols “WHLR”, “WHLRP”, "WHLRD", and "WHLRL", respectively.
Cedar Realty Trust, Inc. ("CDR" or "Cedar") is a subsidiary of WHLR. CDR's 7-1/4% Series B cumulative redeemable preferred stock ("CDR Series B Preferred") and 6-1/2% Series C cumulative redeemable preferred stock ("CDR Series C Preferred") trade publicly on the New York Stock Exchange ("NYSE") under the symbols "CDRpB" and "CDRpC", respectively and represent a noncontrolling interest to WHLR.
Accordingly, the use of the word "Company" refers to WHLR and its consolidated subsidiaries, which includes Cedar, except where the context otherwise requires.
| | | | | | | | |
| Corporate Headquarters | | |
| Wheeler Real Estate Investment Trust, Inc. | | |
2529 Virginia Beach Boulevard
Virginia Beach, VA 23452 | | |
Phone: (757) 627-9088
Toll Free: (866) 203-4864 | | |
| Website: www.whlr.us | | |
| | |
| Executive Management | | |
| M. Andrew Franklin - CEO and President | | |
| Crystal Plum - CFO | | |
| | |
| | |
| Board of Directors | | Board of Directors |
Stefani D. Carter (Chair) | | Kerry G. Campbell (Chair) |
E. J. Borrack | | E. J. Borrack |
Kerry G. Campbell | | M. Andrew Franklin |
Saverio M. Flemma | | Paula Poskon |
| Megan Parisi | | Crystal Plum |
| Joseph D. Stilwell | | |
| | |
| | |
| Stock Transfer Agent and Registrar | | Stock Transfer Agent and Registrar |
Computershare Trust Company, N.A.
150 Royall Street, Suite 101
Canton, MA 02021
www.computershare.com | | American Stock Transfer & Trust Co.
6201 15th Ave
Brooklyn, NY 11219
www.amstock.com |
| | |
| Investor Relations Representative | | |
investorrelations@whlr.us
Office: (757) 627-9088 | | |
| | | | | |
WHLR | Financial & Operating Data | 4 |
Financial and Portfolio Overview
For the Three Months Ended June 30, 2023 (consolidated amounts unless otherwise noted)
| | | | | |
Financial Results | |
| Net loss attributable to Wheeler REIT common stockholders (in 000s) | $ | (6,231) | |
| Net loss per basic and diluted shares | $ | (0.64) | |
Funds from operations available to common stockholders and Operating Partnership (OP) unitholders (FFO) (in 000s) (1) | $ | 1,203 | |
| FFO per common share and OP unit | $ | 0.12 | |
Adjusted FFO (AFFO) (in 000s) (1) | $ | 1,268 | |
| AFFO per common share and OP unit | $ | 0.13 | |
| |
Assets and Leverage | |
Investment Properties, net of $86.7 million accumulated depreciation (in 000s) | $ | 558,423 | |
| Cash and Cash Equivalents (in 000s) | $ | 28,735 | |
| Total Assets (in 000s) | $ | 673,362 | |
| Total Debt (in 000s) | $ | 488,101 | |
| Debt to Total Assets | 72.49 | % |
| Debt to Gross Asset Value | 63.51 | % |
| |
Market Capitalization | |
| Common shares outstanding | 9,800,211 | |
| OP units outstanding | 144,942 | |
| Total common shares and OP units | 9,945,153 | |
| | | | | | | | | | | | | | | | | |
Ticker | Shares Outstanding at June 30, 2023 | | Second Quarter stock price range | | Stock price as of June 30, 2023 |
| WHLR | 9,800,211 | | | $0.39-$1.42 | | $ | 0.62 | |
| WHLRP | 3,379,142 | | | $1.18-$2.09 | | $ | 1.60 | |
| WHLRD | 3,308,603 | | | $11.50-$14.30 | | $ | 12.50 | |
| CDRpB | 1,450,000 | | | $13.22-$16.85 | | $ | 15.40 | |
| CDRpC | 5,000,000 | | | $10.80-$12.97 | | $ | 12.96 | |
| | | | | |
| Common Stock market capitalization (in 000s) | | 6,076 | |
| | | | | | | | | | | |
Portfolio Summary | | | |
| Total Leasable Area (GLA) in sq. ft. | 5,309,985 | | | 2,862,550 | |
| Occupancy Rate | 94.3 | % | | 84.5 | % |
Leased Rate (2) | 95.2 | % | | 87.7 | % |
| Annualized Base Rent (in 000s) | $ | 49,498 | | | $ | 25,408 | |
| Total number of leases signed or renewed | 32 | | | 8 | |
| Total sq. ft. leases signed or renewed | 232,192 | | | 45,488 | |
(1) See page 24 for the Company's definition of this non-GAAP measurement and reasons for using it.
(2) Reflects leases executed through June 30, 2023 that commence subsequent to the end of the current reporting period.
| | | | | |
WHLR | Financial & Operating Data | as of 6/30/2023 unless otherwise stated | 5 |
Financial and Operating Results
Today, WHLR reported its financial and operating results for the three and six months ended June 30, 2023. For the three months ended June 30, 2023 and 2022, WHLR's net loss attributable to WHLR's common stock, $0.01 par value per share ("Common Stock") stockholders was $(0.64) per share and $(0.24) per share, respectively. For the six months ended June 30, 2023 and 2022, WHLR's net loss attributable to WHLR's common stock, $0.01 par value per share ("Common Stock") stockholders was $(1.18) per share and $(0.94) per share, respectively.
2023 SECOND QUARTER HIGHLIGHTS
(All comparisons are to the same prior year period unless otherwise noted)
LEASING
•The Company's real estate portfolio, excluding Cedar was 94.3% occupied, a 20 basis point increase from 94.1%.
•The Company's real estate portfolio, excluding Cedar was 95.2% leased, a 50 basis point decrease from 95.7%.
•The Company invested $6.8 million in tenant improvements and capital expenditures into the properties.
•The Company's real estate portfolio includes 36 properties that are 100% leased.
•WHLR Quarter-To-Date Leasing Activity
•Executed 19 lease renewals totaling 206,295 square feet at a weighted average increase of $0.58 per square foot, representing an increase of 7.46% over in-place rental rates.
•Signed 13 new leases totaling 25,897 square feet with a weighted average rental rate of $13.06 per square foot.
•CDR Quarter-To-Date Leasing Activity
•Executed 5 lease renewals totaling 19,223 square feet at a weighted average increase of $1.00 per square foot, representing an increase of 6.55% over in-place rental rates.
•Signed 3 new leases totaling 26,265 square feet with a weighted average rental rate of $13.69 per square foot.
•The Cedar portfolio was 87.7% leased, a 150 basis point increase from 86.2% as of December 31, 2022.
•The Cedar portfolio was 84.5% occupied, a 220 basis point increase from 82.3% occupied as of December 31, 2022.
•The Company’s gross leasable area ("GLA"), which is subject to leases that expire over the next six months and includes month-to-month leases, decreased to approximately 2.68%, compared to 2.70%. At June 30, 2023, 36.8% of this expiring GLA is subject to renewal options (a lease expiration schedule can be found on page 18 and provides additional details on the Company's leases).
•As of June 30, 2023, the Company signed leases representing $2.3 million of annualized base rent ("ABR"), whereby rent will commence within the next twelve months.
OPERATIONS
•Total revenue increased by 60.5% or $9.4 million, which is primarily a result of the $7.7 million increase in non-same store property revenues due to the Cedar Acquisition, $0.3 million increase in same store revenues and a $1.2 million increase in market lease amortization.
•Total operating expenses increased by 82.2% or $8.3 million, primarily a result of the Cedar Acquisition.
FINANCIAL
•Funds from operations ("FFO") of $1.2 million, or $0.12 per share of the Company's Common Stock and common unit ("Common Unit") in our operating partnership, Wheeler REIT, L.P., as compared to FFO of $1.6 million, or $0.16 per share.
•Adjusted Funds from Operations ("AFFO") of $0.13 per share of the Company's Common Stock and Common Unit in our operating partnership, Wheeler REIT, L.P., as compared to $0.30 per share.
SAME STORE
•Same store Net Operating Income ("NOI"), which excludes the impact of the Cedar portfolio, decreased by 2.3% or $0.2 million, a result of a $0.3 million increase in property revenues offset by a $0.5 million increase in property expenses.
CAPITAL MARKETS
•The Company completed two loans in the current quarter resulting in refinancing loans on 20 properties:
•On May 5, 2023, the Company entered into a loan agreement (the "Term Loan Agreement, 12 properties") for $61.1 million at a fixed rate of 6.194% and interest-only payments due monthly through June 2025. Commencing in July 2025, until the maturity date of June 1, 2033, monthly
| | | | | |
WHLR | Financial & Operating Data | as of 6/30/2023 unless otherwise stated | 6 |
principal and interest payments will be $0.4 million. Loan proceeds were used to refinance 12 properties, including $1.1 million in defeasance.
•On May 18, 2023, the Company entered into a loan agreement (the "Term Loan Agreement, 8 properties") for $53.1 million at a fixed rate of 6.24% and interest-only payments due monthly through June 2028. Commencing in July 2028, until the maturity date of June 10, 2033, monthly principal and interest payments will be $0.3 million. Loan proceeds were used to refinance 8 properties, including $0.7 million in defeasance.
•Interest expense was $10.2 million and $7.5 million for the three months ended June 30, 2023 and 2022, respectively, representing an increase of 35.7%, see page 16 for further details. Interest payment on the Convertible Notes included $0.9 million adjustment to fair value for interest paid with the shares of Series D Preferred.
•Recognized a non-operating gain of $3.0 million in net changes in fair value of derivative liabilities primarily due to adjustments in valuation assumptions associated with the embedded derivatives within the Convertible Notes.
•On August 7, 2023, the Company announced that its Board of Directors approved a reverse stock split of one-for-ten to be effective August 17, 2023 and begin trading on a split-adjusted basis on the Nasdaq Capital Market at the market open on August 18, 2023.
Other
•On June 8, 2023, the Company paid down $0.6 million of the Convertible Notes through an open market purchase of 23,784 units totaling $1.2 million resulting in a $0.6 million loss included in non-operating expenses.
•On June 1, 2023 the Company subscribed for limited partnership interest in Stilwell Activist Investments, L.P. ("SAI"), a Delaware limited partnership in exchange for a $3.0 million capital contribution:
•The investment objective of SAI is to seek long-term capital appreciation through investing primarily in publicly-traded undervalued financial institutions, or businesses with a strong financial component, or the securities of any of them, and pursuing an activist shareholder agenda with respect to those institutions.
•Stilwell Value, LLC ("Value") is the general partner of SAI. Joseph Stilwell, a member of the Company's Board of Directors, is the managing member of Value and a limited partner in funds advised by Value. Additionally, E.J. Borrack, a member of the Company’s Board of Directors, serves as the General Counsel to Value and its affiliated entities, including SAI and related funds, and is a limited partner in one of the funds advised by Value. Megan Parisi, a member of the Company’s Board of Directors, serves as the Director of Communications to Value and its affiliated entities, including SAI and related funds, is a non-managing member of Value and is a limited partner in one of the funds advised by Value.
•The Company’s subscription for SAI’s limited partnership interest was approved by the disinterested directors of the Company.
•A portion of SAI's underlying investments are in the Company's own equity and debt securities.
•The Company may not withdraw its capital from SAI for a period of one year measured from the date of the Company's initial contribution, subject to certain exceptions.
•The Company’s SAI investment is accounted for under the equity method and measured at net asset value as a practical expedient and has not been classified within the fair value hierarchy. All gains and losses, realized and unrealized, and fees are recorded through "gains (losses) on investment securities, net" on the condensed consolidated statements of operations. As of June 30, 2023, the fair value of the Company’s SAI investment was $3.0 million which includes the $3.0 million subscription, $10 thousand in fees and $41 thousand in unrealized gains.
2023 YEAR-TO-DATE HIGHLIGHTS
(All comparisons are to the same prior year period unless otherwise noted)
LEASING
•WHLR Year-To-Date Leasing Activity
•Executed 57 lease renewals totaling 469,082 square feet at a weighted average increase of $0.62 per square foot, representing an increase of 7.11% over in-place rental rates.
•Signed 22 new leases totaling 75,117 square feet with a weighted average rental rate of $15.08 per square foot.
•CDR Year-To-Date Leasing Activity
•Executed 11 lease renewals totaling 77,394 square feet at a weighted average increase of $0.55 per square foot, representing an increase of 4.82% over in-place rental rates.
| | | | | |
WHLR | Financial & Operating Data | as of 6/30/2023 unless otherwise stated | 7 |
•Signed 6 new leases totaling 68,665 square feet with a weighted average rental rate of $13.30 per square foot.
OPERATIONS
•Total revenue increased by 64.3% or $19.9 million, primarily a result of the $15.9 million increase in non-same store property revenues due to the Cedar Acquisition, $0.7 million increase in same store revenues and a $2.7 million increase in market lease amortization.
•Total operating expenses increased by 81.4% or $17.0 million, primarily a result of the Cedar Acquisition.
FINANCIAL
•Funds from operations ("FFO") of $3.5 million, or $0.35 per share of the Company's Common Stock and common unit ("Common Unit") in our operating partnership, Wheeler REIT, L.P., as compared to FFO of $(0.8) million, or $(0.09) per share.
•Adjusted Funds from Operations ("AFFO") of $0.32 per share of the Company's Common Stock and Common Unit in our operating partnership, Wheeler REIT, L.P., as compared to $0.59 per share.
SAME STORE
•Same store Net Operating Income ("NOI"), which excludes the impact of the Cedar portfolio, increased by 0.9% or $0.2 million a result of a $0.7 million increase in property revenues partially offset by a $0.5 million increase in property expenses.
CAPITAL MARKETS
•Interest expense was $16.7 million and $12.1 million for the six months ended June 30, 2023 and 2022, respectively, representing an increase of 37.3%, see page 16 for further details.
•Recognized a non-operating gain of $4.9 million in net changes in fair value of derivative liabilities primarily due to adjustments in valuation assumptions associated with the embedded derivatives within the Convertible Notes.
•Loans payable increased $5.7 million compared to December 31, 2022 and were impacted by:
•$7.3 million net increase from the two term loan agreements completed in the second quarter; partially offset by
•$0.6 million repurchase of debt securities;
•$1.1 million monthly principal payments.
Other
•The Company recognized non-operating expenses of $3.0 million, a result of costs incurred on the Exchange Offer that expired in January 2023 and loss on repurchase of Convertible Notes.
BALANCE SHEET
•Cash and cash equivalents totaled $28.7 million, compared to $28.5 million at December 31, 2022.
•Restricted cash totaled $22.4 million, compared to $27.4 million at December 31, 2022. The funds at June 30, 2023 are held in lender reserves primarily for the purpose of tenant improvements, lease commissions, real estate taxes and insurance expenses.
•Debt totaled $488.1 million, compared to $482.4 million at December 31, 2022.
•WHLR's weighted average interest rate on property level debt, excluding Cedar, was 5.20% with a term of 8.72 years, compared to 4.58% with a term of 6.2 years at December 31, 2022. The weighted average interest rate on all debt was 5.39% with a term of 8.97 years, compared to 4.99% with a term of 7.4 years at December 31, 2022.
•Net investment properties totaled $558.4 million compared to $561.0 million as of December 31, 2022.
DIVIDENDS
•Total cumulative dividends in arrears for WHLR's Series D Preferred were $11.73 per share as of June 30, 2023, with $0.64 and $1.28 per share attributable to the three and six months ended June 30, 2023, respectively.
•On July 20, 2023 Cedar declared dividends of $0.453125 and $0.406250 per share with respect to the CDR Series B Preferred and CDR Series C Preferred, respectively. The distributions are payable on August 21, 2023 to shareholders of record on August 10, 2023.
SUBSEQUENT EVENTS
•On July 11, 2023, the Company sold an outparcel adjacent to Carll's Corner, located in Bridgeton, New Jersey for $3.0 million.
| | | | | |
WHLR | Financial & Operating Data | as of 6/30/2023 unless otherwise stated | 8 |
ADDITIONAL INFORMATION
The enclosed information should be read in conjunction with the Company's filings with the Securities and Exchange Commission, including, but not limited to, its quarterly and annual filings on Forms 10-Q and 10-K. These documents are or will be available upon filing via the U.S. Securities and Exchange Commission website (www.sec.gov) or through WHLR’s website at www.whlr.us.
| | | | | |
WHLR | Financial & Operating Data | as of 6/30/2023 unless otherwise stated | 9 |
Consolidated Balance Sheets
$ in 000s, except par value and share data
| | | | | | | | | | | |
| | June 30, 2023 | | December 31, 2022 |
| | (unaudited) | | |
| ASSETS: | | | |
| Real estate: | | | |
| Land and land improvements | $ | 145,368 | | | $ | 144,537 | |
| Buildings and improvements | 499,740 | | | 494,668 | |
| 645,108 | | | 639,205 | |
| Less accumulated depreciation | (86,685) | | | (78,225) | |
| Real estate, net | 558,423 | | | 560,980 | |
| | | |
| Cash and cash equivalents | 28,735 | | | 28,491 | |
| Restricted cash | 22,410 | | | 27,374 | |
| Receivables, net | 11,048 | | | 13,544 | |
| | | |
| Assets held for sale | 878 | | | — | |
| Investment securities - related party | 3,031 | | | — | |
| Above market lease intangibles, net | 2,573 | | | 3,134 | |
| Operating lease right-of-use assets | 14,978 | | | 15,133 | |
| Deferred costs and other assets, net | 31,286 | | | 35,880 | |
| Total Assets | $ | 673,362 | | | $ | 684,536 | |
| | | |
| LIABILITIES: | | | |
| Loans payable, net | $ | 469,288 | | | $ | 466,029 | |
| Liabilities associated with assets held for sale | 297 | | | — | |
| Below market lease intangibles, net | 20,479 | | | 23,968 | |
| Derivative liabilities | 2,229 | | | 7,111 | |
| Operating lease liabilities | 16,380 | | | 16,478 | |
| Accounts payable, accrued expenses and other liabilities | 17,209 | | | 18,398 | |
| Total Liabilities | 525,882 | | | 531,984 | |
Series D Cumulative Convertible Preferred Stock (no par value, 6,000,000 shares authorized, 3,308,603 and 3,152,392 shares issued and outstanding, respectively; $121.5 million and $113.4 million aggregate liquidation value, respectively) | 107,866 | | | 101,518 | |
| | | |
| EQUITY: | | | |
Series A Preferred Stock (no par value, 4,500 shares authorized, 562 shares issued and outstanding; $0.6 million in aggregate liquidation value) | 453 | | | 453 | |
Series B Convertible Preferred Stock (no par value, 5,000,000 authorized, 3,379,142 shares issued and outstanding, respectively; $84.5 million aggregate liquidation preference) | 44,955 | | | 44,911 | |
Common Stock ($0.01 par value, 200,000,000 shares authorized 9,800,211 and 9,793,957 shares issued and outstanding, respectively) | 98 | | | 98 | |
| Additional paid-in capital | 235,120 | | | 234,993 | |
| Accumulated deficit | (307,213) | | | (295,617) | |
| Total Stockholders’ Deficit | (26,587) | | | (15,162) | |
| Noncontrolling interests | 66,201 | | | 66,196 | |
| Total Equity | 39,614 | | | 51,034 | |
| Total Liabilities and Equity | $ | 673,362 | | | $ | 684,536 | |
| | | | | |
WHLR | Financial & Operating Data | as of 6/30/2023 unless otherwise stated | 10 |
Consolidated Statements of Operations
$ in 000s, except share and per share data
| | | | | | | | | | | | | | | | | | | | | | | |
| | Three Months Ended
June 30, | | Six Months Ended
June 30, |
| | 2023 | | 2022 | | 2023 | | 2022 |
| REVENUE: | | | | | | | |
| Rental revenues | $ | 24,583 | | | $ | 15,324 | | | $ | 50,083 | | | $ | 30,656 | |
| Other revenues | 257 | | | 155 | | | 823 | | | 320 | |
| Total Revenue | 24,840 | | | 15,479 | | | 50,906 | | | 30,976 | |
| OPERATING EXPENSES: | | | | | | | |
| Property operations | 8,342 | | | 4,732 | | | 17,297 | | | 9,982 | |
| Depreciation and amortization | 7,301 | | | 3,625 | | | 14,767 | | | 7,241 | |
| Impairment of assets held for sale | — | | | 100 | | | — | | | 760 | |
| Corporate general & administrative | 2,818 | | | 1,673 | | | 5,889 | | | 2,937 | |
| Total Operating Expenses | 18,461 | | | 10,130 | | | 37,953 | | | 20,920 | |
| Loss on disposal of properties | — | | | — | | | — | | | (15) | |
| Operating Income | 6,379 | | | 5,349 | | | 12,953 | | | 10,041 | |
| Interest income | 126 | | | 14 | | | 173 | | | 27 | |
| Gain on investment securities, net | 31 | | | — | | | 31 | | | — | |
| Interest expense | (10,179) | | | (7,501) | | | (16,656) | | | (12,129) | |
| Net changes in fair value of derivative liabilities | 3,030 | | | 2,085 | | | 4,882 | | | (1,877) | |
| | | | | | | |
| Other expense | (635) | | | — | | | (3,040) | | | (691) | |
| Net Loss Before Income Taxes | (1,248) | | | (53) | | | (1,657) | | | (4,629) | |
| Income tax expense | (46) | | | — | | | (46) | | | — | |
| Net Loss | (1,294) | | | (53) | | | (1,703) | | | (4,629) | |
| Less: Net income (loss) attributable to noncontrolling interests | 2,676 | | | (1) | | | 5,368 | | | 3 | |
| Net Loss Attributable to Wheeler REIT | (3,970) | | | (52) | | | (7,071) | | | (4,632) | |
| Preferred Stock dividends - undeclared | (2,261) | | | (2,264) | | | (4,525) | | | (4,528) | |
| | | | | | | |
| Net Loss Attributable to Wheeler REIT Common Stockholders | $ | (6,231) | | | $ | (2,316) | | | $ | (11,596) | | | $ | (9,160) | |
| | | | | | | |
| Loss per share: | | | | | | | |
| Basic and Diluted | $ | (0.64) | | | $ | (0.24) | | | $ | (1.18) | | | $ | (0.94) | |
| Weighted average number of shares: | | | | | | | |
| Basic and Diluted | 9,800,211 | | | 9,734,755 | | | 9,797,136 | | | 9,727,711 | |
| | | | | | | |
| | | | | |
WHLR | Financial & Operating Data | as of 6/30/2023 unless otherwise stated | 11 |
Reconciliation of Non-GAAP Measures
FFO and AFFO (1)
$ in 000s, except share, unit and per share data
| | | | | | | | | | | | | | | | | | | | | | | | | | |
| Three Months Ended
June 30, | | Six Months Ended
June 30, |
| 2023 | | 2022 | | 2023 | | 2022 |
| Net Loss | $ | (1,294) | | | $ | (53) | | | $ | (1,703) | | | $ | (4,629) | |
| Depreciation and amortization of real estate assets | 7,301 | | | 3,625 | | | 14,767 | | | 7,241 | |
| Impairment of assets held for sale | — | | | 100 | | | — | | | 760 | |
| Loss on disposal of properties | — | | | — | | | — | | | 15 | |
| FFO | 6,007 | | | 3,672 | | | 13,064 | | | 3,387 | |
| Preferred stock dividends - undeclared | (2,261) | | | (2,264) | | | (4,525) | | | (4,528) | |
| Dividends on noncontrolling interests preferred stock | (2,688) | | | — | | | (5,376) | | | — | |
| | | | | | | |
| Preferred stock accretion adjustments | 145 | | | 146 | | | 292 | | | 292 | |
| FFO available to common stockholders and common unitholders | 1,203 | | | 1,554 | | | 3,455 | | | (849) | |
Other non-recurring and non-cash expenses (2) | 2,402 | | | 1,470 | | | 5,075 | | | 2,147 | |
| Gain on investment securities, net | (31) | | | — | | | (31) | | | — | |
| Net changes in fair value of derivative liabilities | (3,030) | | | (2,085) | | | (4,882) | | | 1,877 | |
| | | | | | | |
| Straight-line rental revenue, net straight-line expense | (301) | | | (148) | | | (704) | | | (217) | |
| Deferred financing cost amortization | 1,242 | | | 928 | | | 1,721 | | | 1,348 | |
| Paid-in-kind interest | 1,428 | | | 1,521 | | | 2,006 | | | 2,099 | |
| Above (below) market lease amortization | (1,237) | | | (7) | | | (2,633) | | | 16 | |
| Recurring capital expenditures and tenant improvement reserves | (408) | | | (269) | | | (817) | | | (539) | |
| AFFO | $ | 1,268 | | | $ | 2,964 | | | $ | 3,190 | | | $ | 5,882 | |
| | | | | | | |
| Weighted Average Common Shares | 9,800,211 | | | 9,734,755 | | | 9,797,136 | | | 9,727,711 | |
| Weighted Average Common Units | 144,942 | | | 204,420 | | | 144,942 | | | 209,851 | |
| Total Common Shares and Units | 9,945,153 | | | 9,939,175 | | | 9,942,078 | | | 9,937,562 | |
| FFO per Common Share and Common Units | $ | 0.12 | | | $ | 0.16 | | | $ | 0.35 | | | $ | (0.09) | |
| AFFO per Common Share and Common Units | $ | 0.13 | | | $ | 0.30 | | | $ | 0.32 | | | $ | 0.59 | |
(1) See page 24 for the Company's definition of this non-GAAP measurement and reasons for using it.
(2) Other non-recurring expenses are described in "Management's Discussion and Analysis of Financial Condition and Results of Operations" included in our Quarterly Report on Form 10-Q for the three and six months ended June 30, 2023.
| | | | | |
WHLR | Financial & Operating Data | as of 6/30/2023 unless otherwise stated | 12 |
Reconciliation of Non-GAAP Measures (continued)
Same Store Property Net Operating Income (1)
$ in 000s
| | | | | | | | | | | | | | | | | | | | | | | |
| | Three Months Ended June 30, | | Six Months Ended June 30, |
| | 2023 | | 2022 | | 2023 | | 2022 |
| | | | | | | |
| Operating Income | $ | 6,379 | | | $ | 5,349 | | | $ | 12,953 | | | $ | 10,041 | |
| Adjustments: | | | | | | | |
| Loss on disposal of properties | — | | | — | | | — | | | 15 | |
| Corporate general & administrative | 2,818 | | | 1,673 | | | 5,889 | | | 2,937 | |
| Impairment of assets held for sale | — | | | 100 | | | — | | | 760 | |
| Depreciation and amortization | 7,301 | | | 3,625 | | | 14,767 | | | 7,241 | |
| Straight-line rents | (373) | | | (156) | | | (719) | | | (233) | |
| Above (below) market lease amortization | (1,237) | | | (7) | | | (2,633) | | | 16 | |
| Other non-property revenue | 114 | | | (9) | | | (131) | | | (16) | |
NOI related to non-same store properties (2) | (4,875) | | | (210) | | | (9,610) | | | (428) | |
| Same Store Property Net Operating Income | $ | 10,127 | | | $ | 10,365 | | | $ | 20,516 | | | $ | 20,333 | |
| | | | | | | |
| Property revenues | $ | 15,341 | | | $ | 15,026 | | | $ | 30,903 | | | $ | 30,169 | |
| Property expenses | 5,214 | | | 4,661 | | | 10,387 | | | 9,836 | |
| Same Store Property Net Operating Income | $ | 10,127 | | | $ | 10,365 | | | $ | 20,516 | | | $ | 20,333 | |
(1) See page 25 for the Company's definition of this non-GAAP measurement and reasons for using it.
(2) The Company excluded the CDR portfolio and sold properties from the calculation of same store property NOI since they were not owned during all periods presented in their entirety.
| | | | | |
WHLR | Financial & Operating Data | as of 6/30/2023 unless otherwise stated | 13 |
Reconciliation of Non-GAAP Measures (continued)
EBITDA (4)
$ in 000s
| | | | | | | | | | | | | | | | | | | | | | | | | | |
| Three Months Ended
June 30, | | Six Months Ended
June 30, |
| 2023 | | 2022 | | 2023 | | 2022 |
Net Loss | $ | (1,294) | | | $ | (53) | | | $ | (1,703) | | | $ | (4,629) | |
Add back: | Depreciation and amortization (1) | 6,064 | | | 3,618 | | | 12,134 | | | 7,257 | |
| Interest expense (2) | 10,179 | | | 7,501 | | | 16,656 | | | 12,129 | |
| Income tax expense | 46 | | | — | | | 46 | | | — | |
EBITDA | 14,995 | | | 11,066 | | | 27,133 | | | 14,757 | |
| Adjustments for items affecting comparability: | | | | | | | |
| | | | | | | | |
| Net changes in FMV of derivative liabilities | (3,030) | | | (2,085) | | | (4,882) | | | 1,877 | |
| Other non-recurring and non-cash expenses (3) | 2,393 | | | 2 | | | 5,058 | | | 669 | |
| Impairment of assets held for sale | — | | | 100 | | | — | | | 760 | |
| Gain on investment securities, net | (31) | | | — | | | (31) | | | — | |
| Loss on disposal of properties | — | | | — | | | — | | | 15 | |
Adjusted EBITDA | $ | 14,327 | | | $ | 9,083 | | | $ | 27,278 | | | $ | 18,078 | |
(1) Includes above (below) market lease amortization.
(2) Includes loan cost amortization.
(3) Other non-recurring expenses are described in "Management's Discussion and Analysis of Financial Condition and Results of Operations" included in our Annual Report on Form 10-Q for the period ended June 30, 2023.
(4) See page 24 for the Company's definition of this non-GAAP measurement and reasons for using it.
| | | | | |
WHLR | Financial & Operating Data | as of 6/30/2023 unless otherwise stated | 14 |
Debt Summary
$ in 000s
| | | | | | | | | | | | | | | | | | | | | | | | | | | | | | | | |
| Property/Description | | Monthly Payment | | Interest
Rate | | Maturity | | June 30, 2023 | | December 31,
2022 |
| Cypress Shopping Center | | $ | 34,360 | | | 4.70% | | July 2024 | | $ | 5,837 | | | $ | 5,903 | |
| Conyers Crossing | | Interest only | | 4.67% | | October 2025 | | 5,960 | | | 5,960 | |
| Winslow Plaza | | $ | 24,295 | | | 4.82% | | December 2025 | | 4,370 | | | 4,409 | |
| Tuckernuck | | $ | 32,202 | | | 5.00% | | March 2026 | | 4,844 | | | 4,915 | |
| Chesapeake Square | | $ | 23,857 | | | 4.70% | | August 2026 | | 4,060 | | | 4,106 | |
| Sangaree/Tri-County | | $ | 32,329 | | | 4.78% | | December 2026 | | 6,038 | | | 6,086 | |
| Village of Martinsville | | $ | 89,664 | | | 4.28% | | July 2029 | | 14,970 | | | 15,181 | |
| Laburnum Square | | Interest only | | 4.28% | | September 2029 | | 7,665 | | | 7,665 | |
| Rivergate (1) | | $ | 100,222 | | | 4.25% | | September 2031 | | 17,782 | | | 18,003 | |
| Convertible Notes | | Interest only | | 7.00% | | December 2031 | | 32,405 | | | 33,000 | |
| Guggenheim Loan Agreement (2) | | Interest only | | 4.25% | | July 2032 | | 75,000 | | | 75,000 | |
| JANAF Loan Agreement (3) | | Interest only | | 5.31% | | July 2032 | | 60,000 | | | 60,000 | |
| Guggenheim-Cedar Loan Agreement (4) | | Interest only | | 5.25% | | November 2032 | | 110,000 | | | 110,000 | |
| Patuxent Crossing/Coliseum Marketplace Loan Agreement | | Interest only | | 6.35% | | January 2033 | | 25,000 | | | 25,000 | |
| Term loan, 12 properties | | Interest only | | 6.19% | | June 2033 | | 61,100 | | | — | |
| Term loan, 8 properties | | Interest only | | 6.24% | | June 2033 | | 53,070 | | | — | |
| Term loans - fixed interest rate | | various | | 4.47% (5) | | various | | — | | | 107,219 | |
| | | | | | | | | | |
| | | | | | | | | | |
| | | | | | | | | | |
| | | | | | | | | | |
| Total Principal Balance | | | | | | | | 488,101 | | | 482,447 | |
| Unamortized deferred financing cost | | | | | | | | (18,813) | | | (16,418) | |
| Total Loans Payable, net | | | | | | | | $ | 469,288 | | | $ | 466,029 | |
(1) October 2026 the interest rate changes to variable interest rate equal to the 5 years U.S. Treasury Rate plus 2.70%, with a floor of 4.25%.
(2) Collateralized by 22 properties.
(3) Collateralized by JANAF properties.
(4) Collateralized by 10 Cedar Properties.
(5) Contractual interest rate weighted average.
| | | | | |
WHLR | Financial & Operating Data | as of 6/30/2023 unless otherwise stated | 15 |
Debt Summary (continued)
Total Debt
$ in 000s
| | | | | | | | | | | | | | |
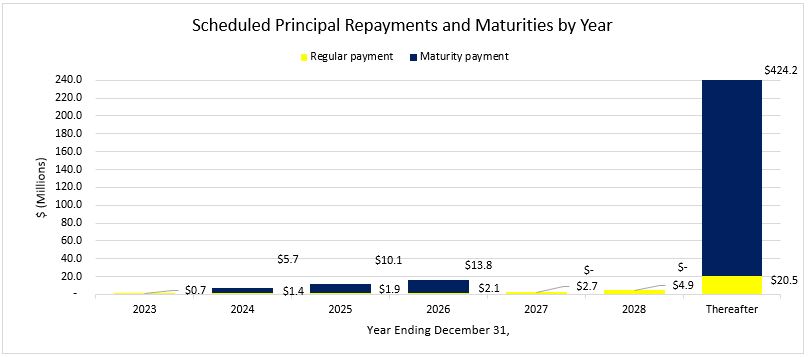
| Scheduled principal repayments and maturities by year | | Amount | | % Total Principal Payments and Maturities |
| For the remaining six months ended December 31, 2023 | | $ | 713 | | | 0.15 | % |
| December 31, 2024 | | 7,146 | | | 1.46 | % |
| December 31, 2025 | | 12,007 | | | 2.46 | % |
| December 31, 2026 | | 15,931 | | | 3.26 | % |
| December 31, 2027 | | 2,695 | | | 0.55 | % |
| December 31, 2028 | | 4,928 | | | 1.01 | % |
| Thereafter | | 444,681 | | | 91.11 | % |
| Total principal repayments and debt maturities | | $ | 488,101 | | | 100.00 | % |
| | | | |
Interest Expense
$ in 000s
| | | | | | | | | | | | | | | | | | | | | | | | | | | | | | | | | | | | | | | | | | | | | | | |
| Three Months Ended June 30, | | Six Months Ended June 30, | | Three Months Ended Changes | | Six Months Ended Changes |
| 2023 | | 2022 | | 2023 | | 2022 | | Change | | % Change | | Change | | % Change |
| Property debt interest - excluding Cedar debt | $ | 3,890 | | | $ | 3,594 | | | $ | 7,496 | | | $ | 7,224 | | | $ | 296 | | | 8.2 | % | | $ | 272 | | | 3.8 | % |
Convertible Notes interest (1) | 1,428 | | | 1,521 | | | 2,006 | | | 2,099 | | | (93) | | | (6.1) | % | | (93) | | | (4.4) | % |
| Defeasance paid | 1,758 | | | 1,458 | | | 1,758 | | | 1,458 | | | 300 | | | 20.6 | % | | 300 | | | 20.6 | % |
| Amortization of deferred financing costs | 1,242 | | | 928 | | | 1,721 | | | 1,348 | | | 314 | | | 33.8 | % | | 373 | | | 27.7 | % |
| Property debt interest - Cedar | 1,861 | | | — | | | 3,675 | | | — | | | 1,861 | | | 100.0 | % | | 3,675 | | | 100.0 | % |
| Total Interest Expense | $ | 10,179 | | | $ | 7,501 | | | $ | 16,656 | | | $ | 12,129 | | | $ | 2,678 | | | 35.7 | % | | $ | 4,527 | | | 37.3 | % |
(1) Includes the fair value adjustment for the paid-in-kind interest.
| | | | | |
WHLR | Financial & Operating Data | as of 6/30/2023 unless otherwise stated | 16 |
Property Summary
| | | | | | | | | | | | | | | | | | | | | | | | | | | | | | | | |
Property | | Location | | Number of
Tenants (1) | Total Leasable
Square Feet | Percentage
Leased (1) | Percentage Occupied | Total SF Occupied | Annualized
Base Rent (in 000's) (2) | Annualized Base Rent per Occupied Sq. Foot |
| WHLR | | | | | | | | | | |
| Alex City Marketplace | | Alexander City, AL | | 19 | | 151,843 | | 100.0 | % | 100.0 | % | 151,843 | | $ | 1,274 | | $ | 8.39 | |
| Amscot Building | | Tampa, FL | | 1 | | 2,500 | | 100.0 | % | 100.0 | % | 2,500 | | 83 | | 33.00 | |
| Beaver Ruin Village | | Lilburn, GA | | 29 | | 74,038 | | 94.7 | % | 94.7 | % | 70,148 | | 1,279 | | 18.24 | |
| Beaver Ruin Village II | | Lilburn, GA | | 4 | | 34,925 | | 100.0 | % | 100.0 | % | 34,925 | | 466 | | 13.34 | |
| Brook Run Shopping Center | | Richmond, VA | | 20 | | 147,738 | | 87.2 | % | 87.2 | % | 128,810 | | 1,126 | | 8.74 | |
| Brook Run Properties (3) | | Richmond, VA | | — | | — | | — | % | — | % | — | | — | | — | |
| Bryan Station | | Lexington, KY | | 9 | | 54,277 | | 94.5 | % | 94.5 | % | 51,275 | | 598 | | 11.67 | |
| Cardinal Plaza | | Henderson, NC | | 9 | | 50,000 | | 100.0 | % | 100.0 | % | 50,000 | | 508 | | 10.15 | |
| Chesapeake Square | | Onley, VA | | 13 | | 108,982 | | 89.9 | % | 89.9 | % | 98,006 | | 757 | | 7.72 | |
| Clover Plaza | | Clover, SC | | 10 | | 45,575 | | 100.0 | % | 100.0 | % | 45,575 | | 383 | | 8.40 | |
| Courtland Commons (3) | | Courtland, VA | | — | | — | | — | % | — | % | — | | — | | — | |
| Conyers Crossing | | Conyers, GA | | 14 | | 170,475 | | 99.4 | % | 99.4 | % | 169,425 | | 978 | | 5.77 | |
| Crockett Square | | Morristown, TN | | 4 | | 107,122 | | 100.0 | % | 100.0 | % | 107,122 | | 978 | | 9.13 | |
| Cypress Shopping Center | | Boiling Springs, SC | | 18 | | 80,435 | | 59.9 | % | 59.9 | % | 48,175 | | 613 | | 12.72 | |
| Darien Shopping Center | | Darien, GA | | 1 | | 26,001 | | 100.0 | % | 100.0 | % | 26,001 | | 140 | | 5.38 | |
| Devine Street | | Columbia, SC | | 1 | | 38,464 | | 89.1 | % | 89.1 | % | 34,264 | | 180 | | 5.25 | |
| Edenton Commons (3) | | Edenton, NC | | — | | — | | — | % | — | % | — | | — | | — | |
| Folly Road | | Charleston, SC | | 5 | | 47,794 | | 100.0 | % | 100.0 | % | 47,794 | | 735 | | 15.37 | |
| Forrest Gallery | | Tullahoma, TN | | 28 | | 214,451 | | 90.0 | % | 90.0 | % | 193,024 | | 1,437 | | 7.44 | |
| Fort Howard Shopping Center | | Rincon, GA | | 20 | | 113,652 | | 100.0 | % | 100.0 | % | 113,652 | | 1,273 | | 11.20 | |
| Freeway Junction | | Stockbridge, GA | | 18 | | 156,834 | | 98.2 | % | 98.2 | % | 154,034 | | 1,347 | | 8.75 | |
| Franklin Village | | Kittanning, PA | | 24 | | 151,821 | | 93.2 | % | 93.2 | % | 141,573 | | 1,347 | | 9.51 | |
| Franklinton Square | | Franklinton, NC | | 15 | | 65,366 | | 100.0 | % | 100.0 | % | 65,366 | | 599 | | 9.16 | |
| Georgetown | | Georgetown, SC | | 2 | | 29,572 | | 100.0 | % | 100.0 | % | 29,572 | | 267 | | 9.04 | |
| Grove Park Shopping Center | | Orangeburg, SC | | 14 | | 93,265 | | 100.0 | % | 100.0 | % | 93,265 | | 761 | | 8.16 | |
| Harbor Point (3) | | Grove, OK | | — | | — | | — | % | — | % | — | | — | | — | |
| Harrodsburg Marketplace | | Harrodsburg, KY | | 8 | | 60,048 | | 91.0 | % | 91.0 | % | 54,648 | | 465 | | 8.51 | |
| JANAF (4) | | Norfolk, VA | | 118 | | 798,086 | | 94.7 | % | 94.7 | % | 755,581 | | 9,106 | | 12.05 | |
| Laburnum Square | | Richmond, VA | | 20 | | 109,405 | | 99.1 | % | 99.1 | % | 108,445 | | 1,007 | | 9.29 | |
| Ladson Crossing | | Ladson, SC | | 16 | | 52,607 | | 100.0 | % | 100.0 | % | 52,607 | | 561 | | 10.66 | |
| LaGrange Marketplace | | LaGrange, GA | | 13 | | 76,594 | | 91.8 | % | 91.8 | % | 70,300 | | 433 | | 6.16 | |
| Lake Greenwood Crossing | | Greenwood, SC | | 8 | | 43,618 | | 100.0 | % | 100.0 | % | 43,618 | | 365 | | 8.36 | |
| Lake Murray | | Lexington, SC | | 5 | | 39,218 | | 100.0 | % | 100.0 | % | 39,218 | | 274 | | 7.00 | |
| Litchfield Market Village | | Pawleys Island, SC | | 25 | | 86,740 | | 96.4 | % | 96.4 | % | 83,622 | | 1,050 | | 12.56 | |
| Lumber River Village | | Lumberton, NC | | 11 | | 66,781 | | 100.0 | % | 100.0 | % | 66,781 | | 501 | | 7.50 | |
| Moncks Corner | | Moncks Corner, SC | | 1 | | 26,800 | | 100.0 | % | 100.0 | % | 26,800 | | 330 | | 12.31 | |
| Nashville Commons | | Nashville, NC | | 12 | | 56,100 | | 100.0 | % | 100.0 | % | 56,100 | | 648 | | 11.55 | |
| New Market Crossing | | Mt. Airy, NC | | 13 | | 117,076 | | 100.0 | % | 100.0 | % | 117,076 | | 1,044 | | 8.92 | |
| Parkway Plaza | | Brunswick, GA | | 5 | | 52,365 | | 84.8 | % | 84.8 | % | 44,385 | | 454 | | 10.22 | |
| Pierpont Centre | | Morgantown, WV | | 15 | | 111,162 | | 98.4 | % | 98.4 | % | 109,437 | | 1,060 | | 9.68 | |
| Port Crossing | | Harrisonburg, VA | | 8 | | 65,365 | | 100.0 | % | 100.0 | % | 65,365 | | 864 | | 13.21 | |
| Ridgeland | | Ridgeland, SC | | 1 | | 20,029 | | 100.0 | % | 100.0 | % | 20,029 | | 140 | | 7.00 | |
| Riverbridge Shopping Center | | Carrollton, GA | | 10 | | 91,188 | | 95.4 | % | 95.4 | % | 86,975 | | 720 | | 8.28 | |
| Rivergate Shopping Center | | Macon, GA | | 23 | | 193,960 | | 85.9 | % | 85.5 | % | 165,788 | | 2,402 | | 14.49 | |
| Sangaree Plaza | | Summerville, SC | | 10 | | 66,948 | | 100.0 | % | 100.0 | % | 66,948 | | 716 | | 10.70 | |
| Shoppes at Myrtle Park | | Bluffton, SC | | 14 | | 56,609 | | 99.3 | % | 99.3 | % | 56,189 | | 684 | | 12.17 | |
| South Lake | | Lexington, SC | | 11 | | 44,318 | | 100.0 | % | 100.0 | % | 44,318 | | 258 | | 5.83 | |
| South Park | | Mullins, SC | | 4 | | 60,734 | | 96.9 | % | 96.9 | % | 58,834 | | 403 | | 6.86 | |
| South Square | | Lancaster, SC | | 6 | | 44,350 | | 80.9 | % | 80.9 | % | 35,900 | | 304 | | 8.46 | |
| St. George Plaza | | St. George, SC | | 8 | | 59,174 | | 100.0 | % | 100.0 | % | 59,174 | | 404 | | 6.83 | |
| Sunshine Plaza | | Lehigh Acres, FL | | 23 | | 111,189 | | 100.0 | % | 100.0 | % | 111,189 | | 1,104 | | 9.93 | |
| Surrey Plaza | | Hawkinsville, GA | | 4 | | 42,680 | | 100.0 | % | 100.0 | % | 42,680 | | 258 | | 6.05 | |
| | | | | |
WHLR | Financial & Operating Data | as of 6/30/2023 unless otherwise stated | 17 |
Property Summary (continued)
| | | | | | | | | | | | | | | | | | | | | | | | | | | | | | | | |
Property | | Location | | Number of Tenants (1) | Total Leasable Square Feet | Percentage Leased (1) | Percentage Occupied | Total SF Occupied | Annualized Base Rent (in 000's) (2) | Annualized Base Rent per Occupied Sq. Foot |
| Tampa Festival | | Tampa, FL | | 20 | | 141,580 | | 92.9 | % | 67.8 | % | 95,980 | | $ | 961 | | $ | 10.01 | |
| Tri-County Plaza | | Royston, GA | | 7 | | 67,577 | | 90.7 | % | 90.7 | % | 61,277 | | 433 | | 7.06 | |
| Tuckernuck | | Richmond, VA | | 15 | | 93,440 | | 85.5 | % | 85.5 | % | 79,894 | | 919 | | 11.50 | |
| Twin City Commons | | Batesburg-Leesville, SC | | 5 | | 47,680 | | 100.0 | % | 100.0 | % | 47,680 | | 488 | | 10.24 | |
| Village of Martinsville | | Martinsville, VA | | 22 | | 288,254 | | 100.0 | % | 100.0 | % | 288,254 | | 2,426 | | 8.42 | |
| Waterway Plaza | | Little River, SC | | 10 | | 49,750 | | 100.0 | % | 100.0 | % | 49,750 | | 504 | | 10.13 | |
| Westland Square | | West Columbia, SC | | 10 | | 62,735 | | 90.5 | % | 75.5 | % | 47,390 | | 424 | | 8.95 | |
| Winslow Plaza | | Sicklerville, NJ | | 18 | | 40,695 | | 100.0 | % | 100.0 | % | 40,695 | | 659 | | 16.18 | |
| | WHLR TOTAL | | 777 | | 5,309,985 | | 95.2 | % | 94.3 | % | 5,009,276 | | $ | 49,498 | | $ | 9.88 | |
| CDR | | | | | | | | | | |
| Brickyard Plaza | | Berlin, CT | | 10 | | 227,598 | | 97.8 | % | 97.8 | % | 222,598 | | 2,000 | | 8.99 | |
| Carll's Corner | | Bridgeton, NJ | | 5 | | 129,582 | | 27.5 | % | 21.1 | % | 27,324 | | 403 | | 14.74 | |
| Coliseum Marketplace | | Hampton, VA | | 10 | | 106,648 | | 100.0 | % | 100.0 | % | 106,648 | | 1,163 | | 10.90 | |
| Fairview Commons | | New Cumberland, PA | | 10 | | 52,964 | | 77.5 | % | 77.5 | % | 41,064 | | 423 | | 10.29 | |
| Fieldstone Marketplace | | New Bedford, MA | | 9 | | 193,970 | | 72.6 | % | 70.9 | % | 137,569 | | 1,636 | | 11.90 | |
| Gold Star Plaza | | Shenandoah, PA | | 6 | | 71,720 | | 97.8 | % | 97.8 | % | 70,120 | | 641 | | 9.14 | |
| Golden Triangle | | Lancaster, PA | | 19 | | 202,790 | | 98.4 | % | 98.4 | % | 199,605 | | 2,612 | | 13.09 | |
| Hamburg Square | | Hamburg, PA | | 7 | | 102,058 | | 100.0 | % | 100.0 | % | 102,058 | | 686 | | 6.73 | |
| Kings Plaza | | New Bedford, MA | | 16 | | 168,243 | | 82.2 | % | 82.2 | % | 138,239 | | 1,227 | | 8.87 | |
| Oakland Commons | | Bristol, CT | | 2 | | 90,100 | | 100.0 | % | 100.0 | % | 90,100 | | 574 | | 6.37 | |
| Oregon Avenue | | Philadelphia, PA | | 1 | | 20,380 | | 100.0 | % | 5.8 | % | 1,180 | | 40 | | 34.21 | |
| Patuxent Crossing | | California, MD | | 29 | | 264,068 | | 83.9 | % | 83.9 | % | 221,515 | | 2,732 | | 12.33 | |
| Pine Grove Plaza | | Brown Mills, NJ | | 13 | | 79,306 | | 78.1 | % | 78.1 | % | 61,966 | | 742 | | 11.97 | |
| South Philadelphia | | Philadelphia, PA | | 9 | | 221,511 | | 85.8 | % | 67.5 | % | 149,588 | | 1,332 | | 8.90 | |
| Southington Center | | Southington, CT | | 11 | | 155,842 | | 100.0 | % | 100.0 | % | 155,842 | | 1,293 | | 8.30 | |
| Timpany Plaza | | Gardner, MA | | 14 | | 182,799 | | 74.3 | % | 63.3 | % | 115,735 | | 1,117 | | 9.65 | |
| Trexler Mall | | Trexlertown, PA | | 22 | | 336,687 | | 97.6 | % | 97.6 | % | 328,599 | | 3,623 | | 11.02 | |
| Washington Center Shoppes | | Sewell, NJ | | 29 | | 157,300 | | 95.9 | % | 95.9 | % | 150,796 | | 1,886 | | 12.51 | |
| Webster Commons | | Webster, MA | | 9 | | 98,984 | | 100.0 | % | 100.0 | % | 98,984 | | 1,278 | | 12.91 | |
| | CDR TOTAL | | 231 | | 2,862,550 | | 87.7 | % | 84.5 | % | 2,419,530 | | $ | 25,408 | | $ | 10.50 | |
| | | | | | | | | | |
| | COMBINED TOTAL | | 1,008 | | 8,172,535 | | 92.6 | % | 90.9 | % | 7,428,806 | | $ | 74,906 | | $ | 10.08 | |
(1) Reflects leases executed through June 30, 2023 that commence subsequent to the end of the current reporting period.
(2) Annualized based rent per occupied square foot, assumes base rent as of the end of the current reporting period, excludes the impact of tenant concessions and rent abatements.
(3) This information is not available because the property is undeveloped.
(4) Square footage is net of the Company's on-premise management office and net of building square footage whereby the Company only leases the land.
| | | | | |
WHLR | Financial & Operating Data | as of 6/30/2023 unless otherwise stated | 18 |
Property Summary (continued)
| | | | | |
WHLR | Financial & Operating Data | as of 6/30/2023 unless otherwise stated | 19 |
Top Ten Tenants by Annualized Base Rent
| | | | | | | | | | | | | | | | | | | | | | | | | | | | | | | | | | | | | | | | | |
| Tenants | | Category | | Annualized Base Rent
($ in 000s) | | % of Total Annualized Base Rent | | Total Occupied Square Feet | | Percent Total Leasable Square Foot | | Base Rent Per Occupied Square Foot |
| Food Lion | | Grocery | | $ | 4,460 | | | 5.95 | % | | 549,000 | | | 6.72 | % | | $ | 8.12 | |
| Kroger Co (1) | | Grocery | | 2,097 | | | 2.80 | % | | 239,000 | | | 2.92 | % | | 8.77 | |
| Dollar Tree (2) | | Discount Retailer | | 2,061 | | | 2.75 | % | | 244,000 | | | 2.99 | % | | 8.45 | |
| TJX Companies (3) | | Discount Retailer | | 1,691 | | | 2.26 | % | | 195,000 | | | 2.39 | % | | 8.67 | |
| Piggly Wiggly | | Grocery | | 1,542 | | | 2.06 | % | | 203,000 | | | 2.48 | % | | 7.60 | |
| Planet Fitness | | Gym | | 1,497 | | | 2.00 | % | | 140,000 | | | 1.71 | % | | 10.69 | |
| Lowes Foods (4) | | Grocery | | 1,181 | | | 1.58 | % | | 130,000 | | | 1.59 | % | | 9.08 | |
| Big Lots | | Discount Retailer | | 1,100 | | | 1.47 | % | | 171,000 | | | 2.09 | % | | 6.43 | |
| Kohl's | | Discount Retailer | | 1,031 | | | 1.38 | % | | 147,000 | | | 1.80 | % | | 7.01 | |
| Winn Dixie | | Grocery | | 984 | | | 1.31 | % | | 134,000 | | | 1.64 | % | | 7.34 | |
| | | | | $ | 17,644 | | | 23.56 | % | | 2,152,000 | | | 26.33 | % | | $ | 8.20 | |
(1) Kroger 4 / Harris Teeter 1 / 3 fuel stations
(2) Dollar Tree 17 / Family Dollar 7
(3) Marshall's 4 / HomeGoods 2 / TJ Maxx 1
(4) Lowes Foods 1 / KJ's Market 2
Lease Expiration Schedule | | | | | | | | | | | | | | | | | | | | | | | | | | | | | | | | | | | | | | | | | | | | |
| Lease Expiration Period | | Number of Expiring Leases | | Total Expiring Square Footage | | % of Total Expiring Square Footage | | % of Total Occupied Square Footage Expiring | | Expiring Annualized Base Rent (in 000s) | | % of Total Annualized Base Rent | | Expiring Base Rent Per Occupied
Square Foot |
| Available | | — | | | 743,729 | | | 9.10 | % | | — | % | | $ | — | | | — | % | | $ | — | |
| MTM | | 14 | | | 57,597 | | | 0.70 | % | | 0.78 | % | | 609 | | | 0.81 | % | | 10.57 | |
| 2023 | | 49 | | | 162,116 | | | 1.98 | % | | 2.18 | % | | 1,749 | | | 2.33 | % | | 10.79 | |
| 2024 | | 159 | | | 771,634 | | | 9.44 | % | | 10.39 | % | | 8,523 | | | 11.38 | % | | 11.05 | |
| 2025 | | 166 | | | 1,047,667 | | | 12.82 | % | | 14.1 | % | | 10,709 | | | 14.30 | % | | 10.22 | |
| 2026 | | 159 | | | 896,443 | | | 10.97 | % | | 12.07 | % | | 9,814 | | | 13.10 | % | | 10.95 | |
| 2027 | | 140 | | | 697,948 | | | 8.54 | % | | 9.4 | % | | 8,764 | | | 11.70 | % | | 12.56 | |
| 2028 | | 120 | | | 1,316,865 | | | 16.11 | % | | 17.73 | % | | 11,547 | | | 15.42 | % | | 8.77 | |
| 2029 | | 55 | | | 517,388 | | | 6.33 | % | | 6.96 | % | | 4,954 | | | 6.61 | % | | 9.58 | |
| 2030 | | 38 | | | 557,413 | | | 6.82 | % | | 7.50 | % | | 4,148 | | | 5.54 | % | | 7.44 | |
| 2031 | | 31 | | | 427,220 | | | 5.23 | % | | 5.75 | % | | 4,080 | | | 5.45 | % | | 9.55 | |
| 2032 & thereafter | | 77 | | | 976,515 | | | 11.96 | % | | 13.14 | % | | 10,009 | | | 13.36 | % | | 10.25 | |
| Total | | 1,008 | | | 8,172,535 | | | 100.00 | % | | 100.00 | % | | $ | 74,906 | | | 100.00 | % | | $ | 10.08 | |
| | | | | |
WHLR | Financial & Operating Data | as of 6/30/2023 unless otherwise stated | 20 |
Anchor Lease Expiration Schedule (1)
| | | | | | | | | | | | | | | | | | | | | | | | | | | | | | | | | | | |
| No Option | | Option |
| Lease Expiration Period | Number of Expiring Leases | Expiring Occupied Square Footage | Expiring Annualized Based Rent (in 000s) | % of Total Annualized Base Rent | Expiring Base Rent per Square Foot | | Number of Expiring Leases | Expiring Occupied Square Footage | Expiring Annualized Based Rent (in 000s) | % of Total Annualized Base Rent | Expiring Base Rent per Square Foot |
| Available | — | | 228,444 | | $ | — | | — | % | $ | — | | | — | | — | | $ | — | | — | % | $ | — | |
| Month-to-Month | 1 | | 20,300 | | 117 | | 3.79 | % | 5.76 | | | — | | — | | — | | — | % | — | |
| 2023 | — | | — | | — | | — | % | — | | | 1 | | 34,264 | | 180 | | 0.61 | % | 5.25 | |
| 2024 | 1 | | 32,000 | | 125 | | 4.05 | % | 3.91 | | | 8 | | 350,012 | | 2,867 | | 9.66 | % | 8.19 | |
| 2025 | 2 | | 57,297 | | 455 | | 14.73 | % | 7.94 | | | 13 | | 520,075 | | 3,699 | | 12.46 | % | 7.11 | |
| 2026 | 1 | | 20,152 | | 97 | | 3.14 | % | 4.81 | | | 14 | | 456,864 | | 3,822 | | 12.87 | % | 8.37 | |
| 2027 | 3 | | 69,819 | | 629 | | 20.36 | % | 9.01 | | | 5 | | 149,546 | | 1,505 | | 5.07 | % | 10.06 | |
| 2028 | — | | — | | — | | — | % | — | | | 24 | | 962,235 | | 6,610 | | 22.26 | % | 6.87 | |
| 2029 | 3 | | 71,939 | | 772 | | 24.99 | % | 10.73 | | | 7 | | 212,311 | | 1,304 | | 4.39 | % | 6.14 | |
| 2030 | — | | — | | — | | — | % | — | | | 8 | | 452,724 | | 2,498 | | 8.41 | % | 5.52 | |
| 2031 | 1 | | 20,858 | | 60 | | 1.94 | % | 2.88 | | | 6 | | 280,528 | | 2,455 | | 8.27 | % | 8.75 | |
| 2032+ | 3 | | 99,416 | | 834 | | 27.00 | % | 8.39 | | | 17 | | 671,752 | | 4,754 | | 16.00 | % | 7.08 | |
| Total | 15 | | 620,225 | | $ | 3,089 | | 100.00 | % | $ | 7.88 | | | 103 | | 4,090,311 | | $ | 29,694 | | 100.00 | % | $ | 7.26 | |
(1) Anchors defined as leases occupying 20,000 square feet or more.
Non-anchor Lease Expiration Schedule
| | | | | | | | | | | | | | | | | | | | | | | | | | | | | | | | | | | |
| No Option | | Option |
| Lease Expiration Period | Number of Expiring Leases | Expiring Occupied Square Footage | Expiring Annualized Based Rent (in 000s) | % of Total Annualized Base Rent | Expiring Base Rent per Square Foot | | Number of Expiring Leases | Expiring Occupied Square Footage | Expiring Annualized Based Rent (in 000s) | % of Total Annualized Base Rent | Expiring Base Rent per Square Foot |
| Available | — | | 515,285 | | $ | — | | — | % | $ | — | | | — | | — | | $ | — | | — | % | $ | — | |
| Month-to-Month | 13 | | 37,297 | | 492 | | 2.72 | % | 13.19 | | | — | | — | | — | | — | % | — | |
| 2023 | 29 | | 81,336 | | 1,058 | | 5.84 | % | 13.01 | | | 19 | | 46,516 | | 511 | | 2.13 | % | 10.99 | |
| 2024 | 97 | | 200,212 | | 2,830 | | 15.63 | % | 14.14 | | | 53 | | 189,410 | | 2,701 | | 11.25 | % | 14.26 | |
| 2025 | 95 | | 235,712 | | 3,124 | | 17.26 | % | 13.25 | | | 56 | | 234,583 | | 3,431 | | 14.28 | % | 14.63 | |
| 2026 | 90 | | 216,341 | | 2,978 | | 16.45 | % | 13.77 | | | 54 | | 203,086 | | 2,917 | | 12.14 | % | 14.36 | |
| 2027 | 80 | | 222,199 | | 3,351 | | 18.51 | % | 15.08 | | | 52 | | 256,384 | | 3,279 | | 13.65 | % | 12.79 | |
| 2028 | 48 | | 132,525 | | 1,945 | | 10.74 | % | 14.68 | | | 48 | | 222,105 | | 2,992 | | 12.46 | % | 13.47 | |
| 2029 | 15 | | 39,975 | | 484 | | 2.67 | % | 12.11 | | | 30 | | 193,163 | | 2,394 | | 9.97 | % | 12.39 | |
| 2030 | 14 | | 30,238 | | 542 | | 2.99 | % | 17.92 | | | 16 | | 74,451 | | 1,108 | | 4.61 | % | 14.88 | |
| 2031 | 6 | | 12,623 | | 187 | | 1.03 | % | 14.81 | | | 18 | | 113,211 | | 1,378 | | 5.74 | % | 12.17 | |
| 2032+ | 23 | | 69,608 | | 1,113 | | 6.16 | % | 15.99 | | | 34 | | 135,739 | | 3,308 | | 13.77 | % | 24.37 | |
| Total | 510 | | 1,793,351 | | $ | 18,104 | | 100.00 | % | $ | 14.17 | | | 380 | | 1,668,648 | | $ | 24,019 | | 100.00 | % | $ | 14.39 | |
| | | | | |
WHLR | Financial & Operating Data | as of 6/30/2023 unless otherwise stated | 21 |
Leasing Summary
| | | | | | | | | | | | | | |
| WHLR Leasing Renewals and New Leases | | |
|
| | | | | | | | | | | | | | | | | | | | | | | |
| Three Months Ended
June 30, | | Six Months Ended
June 30, |
| 2023 | | 2022 | | 2023 | | 2022 |
Renewals(1): | | | | | | | |
| Leases renewed with rate increase (sq feet) | 161,912 | | | 149,860 | | | 399,467 | | | 216,208 | |
| Leases renewed with rate decrease (sq feet) | — | | | 6,161 | | | — | | | 11,489 | |
| Leases renewed with no rate change (sq feet) | 44,383 | | | 54,322 | | | 69,615 | | | 74,651 | |
| Total leases renewed (sq feet) | 206,295 | | | 210,343 | | | 469,082 | | | 302,348 | |
| | | | | | | |
| Leases renewed with rate increase (count) | 16 | | | 24 | | | 51 | | | 44 | |
| Leases renewed with rate decrease (count) | — | | | 3 | | | — | | | 5 | |
| Leases renewed with no rate change (count) | 3 | | | 6 | | | 6 | | | 18 | |
| Total leases renewed (count) | 19 | | | 33 | | | 57 | | | 67 | |
| | | | | | | |
| Option exercised (count) | 6 | | | 5 | | | 13 | | | 7 | |
| | | | | | | |
| Weighted average on rate increases (per sq foot) | $ | 0.73 | | | $ | 1.29 | | | $ | 0.73 | | | $ | 1.25 | |
| Weighted average on rate decreases (per sq foot) | $ | — | | | $ | (3.75) | | | $ | — | | | $ | (3.00) | |
| Weighted average rate on all renewals (per sq foot) | $ | 0.58 | | | $ | 0.81 | | | $ | 0.62 | | | $ | 0.78 | |
| | | | | | | |
| Weighted average change over prior rates | 7.46 | % | | 8.80 | % | | 7.11 | % | | 7.73 | % |
| | | | | | | |
New Leases(1) (2): | | | | | | | |
| New leases (sq feet) | 25,897 | | | 29,271 | | | 75,117 | | | 98,190 | |
| New leases (count) | 13 | | | 15 | | | 22 | | | 38 | |
| Weighted average rate (per sq foot) | $ | 13.06 | | | $ | 13.05 | | | $ | 15.08 | | | $ | 13.08 | |
(1) Lease data presented is based on average rate per square foot over the renewed or new lease term.
(2) The Company does not include ground leases entered into for the purposes of new lease sq feet and weighted average rate (per sq foot) on new leases.
| | | | | |
WHLR | Financial & Operating Data | as of 6/30/2023 unless otherwise stated | 22 |
Leasing Summary (continued)
| | | | | | | | | | | | | | |
| CDR Leasing Renewals and New Leases | | |
|
| | | | | | | | | | | |
| Three Months Ended June 30, | | Six Months Ended
June 30, |
| 2023 | | 2023 |
Renewals(1): | | | |
| Leases renewed with rate increase (sq feet) | 13,580 | | | 69,751 | |
| Leases renewed with rate decrease (sq feet) | — | | | — | |
| Leases renewed with no rate change (sq feet) | 5,643 | | | 7,643 | |
| Total leases renewed (sq feet) | 19,223 | | | 77,394 | |
| | | |
| Leases renewed with rate increase (count) | 3 | | | 8 | |
| Leases renewed with rate decrease (count) | — | | | — | |
| Leases renewed with no rate change (count) | 2 | | | 3 | |
| Total leases renewed (count) | 5 | | | 11 | |
| | | |
| Option exercised (count) | 1 | | | 3 | |
| | | |
| Weighted average on rate increases (per sq foot) | $ | 1.41 | | | $ | 0.61 | |
| Weighted average on rate decreases (per sq foot) | $ | — | | | $ | — | |
| Weighted average rate on all renewals (per sq foot) | $ | 1.00 | | | $ | 0.55 | |
| | | |
| Weighted average change over prior rates | 6.55 | % | | 4.82 | % |
| | | |
New Leases(1) (2): | | | |
| New leases (sq feet) | 26,265 | | | 68,665 | |
| New leases (count) | 3 | | | 6 | |
| Weighted average rate (per sq foot) | $ | 13.69 | | | $ | 13.30 | |
(1) Lease data presented is based on average rate per square foot over the renewed or new lease term.
(2) The Company does not include ground leases entered into for the purposes of new lease sq feet and weighted average rate (per sq foot) on new leases.
| | | | | |
WHLR | Financial & Operating Data | as of 6/30/2023 unless otherwise stated | 23 |
Definitions
Funds from Operations (FFO): an alternative measure of a REIT's operating performance, specifically as it relates to results of operations and liquidity. FFO is a measurement that is not in accordance with accounting principles generally accepted in the United States (GAAP). Wheeler computes FFO in accordance with standards established by the Board of Governors of NAREIT in its March 1995 White Paper (as amended in November 1999 and December 2018). As defined by NAREIT, FFO represents net income (computed in accordance with GAAP), excluding gains (or losses) from sales of property, plus real estate related depreciation and amortization (excluding amortization of loan origination costs), plus impairment of real estate related long-lived assets and after adjustments for unconsolidated partnerships and joint ventures.
Most industry analysts and equity REITs, including Wheeler, consider FFO to be an appropriate supplemental measure of operating performance because, by excluding gains or losses on dispositions and excluding depreciation, FFO is a helpful tool that can assist in the comparison of the operating performance of a company’s real estate between periods, or as compared to different companies. Management uses FFO as a supplemental measure to conduct and evaluate the business because there are certain limitations associated with using GAAP net income alone as the primary measure of our operating performance. Historical cost accounting for real estate assets in accordance with GAAP implicitly assumes that the value of real estate assets diminishes predictably over time, while historically real estate values have risen or fallen with market conditions.
Adjusted FFO (AFFO): Management believes that the computation of FFO in accordance with NAREIT’s definition includes certain items that are not indicative of the operating performance of the Company’s real estate assets. These items include, but are not limited to, non-recurring expenses, legal settlements, acquisition costs and capital raise costs. Management uses AFFO, which is a non-GAAP financial measure, to exclude such items. Management believes that reporting AFFO in addition to FFO is a useful supplemental measure for the investment community to use when evaluating the operating performance of the Company on a comparative basis. The Company also presents Pro Forma AFFO which shows the impact of certain activities assuming they occurred at the beginning of the year.
Earnings Before Interest, Taxes, Depreciation and Amortization (EBITDA): another widely-recognized non-GAAP financial measure that the Company believes, when considered with financial statements prepared in accordance with GAAP, is useful to investors and lenders in understanding financial performance and providing a relevant basis for comparison among other companies, including REITs. While EBITDA should not be considered as a substitute for net income attributable to the Company’s common stockholders, net operating income, cash flow from operating activities, or other income or cash flow data prepared in accordance with GAAP, the Company believes that EBITDA may provide additional information with respect to the Company’s performance or ability to meet its future debt service requirements, capital expenditures and working capital requirements. The Company computes EBITDA by excluding interest expense, net loss attributable to noncontrolling interests, depreciation and amortization and impairment of long-lived assets and notes receivable, from income from continuing operations. The Company also presents Adjusted EBITDA which excludes items affecting the comparability of the periods presented, including but not limited to, costs associated with acquisitions and capital related activities.
| | | | | |
WHLR | Financial & Operating Data | as of 6/30/2023 unless otherwise stated | 24 |
Net Operating Income (NOI): The Company believes that NOI is a useful measure of the Company's property operating performance. The Company defines NOI as property revenues (rental and other revenues) less property and related expenses (property operation and maintenance and real estate taxes). Because NOI excludes general and administrative expenses, depreciation and amortization, interest expense, interest income, provision for income taxes, gain or loss on sale or capital expenditures and leasing costs, it provides a performance measure, that when compared year over year, reflects the revenues and expenses directly associated with owning and operating commercial real estate properties and the impact to operations from trends in occupancy rates, rental rates and operating costs, providing perspective not immediately apparent from net income. The Company uses NOI to evaluate its operating performance since NOI allows the Company to evaluate the impact of factors, such as occupancy levels, lease structure, lease rates and tenant base, have on the Company's results, margins and returns. NOI should not be viewed as a measure of the Company's overall financial performance since it does not reflect general and administrative expenses, depreciation and amortization, impairment charges, involuntary conversion, interest expense, interest income, provision for income taxes, market lease amortization, gain or loss on sale or disposition of assets, and the level of capital expenditures and leasing costs necessary to maintain the operating performance of the Company's properties. Other REITs may use different methodologies for calculating NOI, and accordingly, the Company's NOI may not be comparable to that of other REITs.
| | | | | |
WHLR | Financial & Operating Data | as of 6/30/2023 unless otherwise stated | 25 |