| Table of Contents | |||||
| Page | |||||
| Company Overview | |||||
| Financial and Portfolio Overview | |||||
| Financial and Operating Results | |||||
| Financial Summary | |||||
| Consolidated Balance Sheets | |||||
| Consolidated Statements of Operations | |||||
| Reconciliation of Non-GAAP Measures | |||||
| Debt Summary | |||||
| Portfolio Summary | |||||
| Property Summary | |||||
| Top Ten Tenants by Annualized Base Rent and Lease Expiration Schedules | |||||
| Leasing Summary | |||||
| Definitions | |||||
WHLR | Financial & Operating Data | 2 | ||||
WHLR | Financial & Operating Data | 3 | ||||
| Corporate Headquarters | ||||||||
| Wheeler Real Estate Investment Trust, Inc. | ||||||||
| 2529 Virginia Beach Boulevard Virginia Beach, VA 23452 | ||||||||
| Phone: (757) 627-9088 Toll Free: (866) 203-4864 | ||||||||
| Website: www.whlr.us | ||||||||
| Executive Management | ||||||||
| M. Andrew Franklin - CEO and President | ||||||||
| Crystal Plum - CFO | ||||||||
 |  | |||||||
| Board of Directors | Board of Directors | |||||||
Stefani D. Carter (Chair) | Kerry G. Campbell (Chair) | |||||||
Michelle D. Bergman | E. J. Borrack | |||||||
E. J. Borrack | M. Andrew Franklin | |||||||
Kerry G. Campbell | Paula Poskon | |||||||
Saverio M. Flemma | Crystal Plum | |||||||
| Megan Parisi | ||||||||
| Joseph D. Stilwell | ||||||||
| Stock Transfer Agent and Registrar | Stock Transfer Agent and Registrar | |||||||
| Computershare Trust Company, N.A. 150 Royall Street, Suite 101 Canton, MA 02021 www.computershare.com | American Stock Transfer & Trust Co. 6201 15th Ave Brooklyn, NY 11219 www.amstock.com | |||||||
| Investor Relations Representative | ||||||||
| investorrelations@whlr.us Office: (757) 627-9088 | ||||||||
WHLR | Financial & Operating Data | 4 | ||||
Financial Results | |||||
| Net loss attributable to Wheeler REIT common stockholders (in 000s) | $ | (5,365) | |||
| Net loss per basic and diluted shares | $ | (0.55) | |||
Funds from operations available to common stockholders and Operating Partnership (OP) unitholders (FFO) (in 000s) (1) | $ | 2,252 | |||
| FFO per common share and OP unit | $ | 0.23 | |||
Adjusted FFO (AFFO) (in 000s) (1) | $ | 1,344 | |||
| AFFO per common share and OP unit | $ | 0.14 | |||
Assets and Leverage | |||||
Investment Properties, net of $82.4 million accumulated depreciation (in 000s) | $ | 560,913 | |||
| Cash and Cash Equivalents (in 000s) | $ | 24,817 | |||
| Total Assets (in 000s) | $ | 681,153 | |||
| Total Debt (in 000s) | $ | 481,859 | |||
| Debt to Total Assets | 70.74 | % | |||
| Debt to Gross Asset Value | 62.75 | % | |||
Market Capitalization | |||||
| Common shares outstanding | 9,800,211 | ||||
| OP units outstanding | 144,942 | ||||
| Total common shares and OP units | 9,945,153 | ||||
Ticker | Shares Outstanding at March 31, 2023 | First Quarter stock price range | Stock price as of March 31, 2023 | ||||||||||||||
| WHLR | 9,800,211 | $1.10-$1.90 | $ | 1.27 | |||||||||||||
| WHLRP | 3,379,142 | $1.26-$2.33 | $ | 1.61 | |||||||||||||
| WHLRD | 3,148,148 | $11.23-$13.97 | $ | 12.55 | |||||||||||||
| CDRpB | 1,450,000 | $13.23-$18.00 | $ | 15.38 | |||||||||||||
| CDRpC | 5,000,000 | $10.85-$14.28 | $ | 11.78 | |||||||||||||
| Common Stock market capitalization (in 000s) | 12,446 | ||||||||||||||||
Portfolio Summary | | | |||||||||
| Total Leasable Area (GLA) in sq. ft. | 5,309,977 | 2,862,550 | |||||||||
| Occupancy Rate | 94.5 | % | 84.8 | % | |||||||
Leased Rate (2) | 95.8 | % | 87.2 | % | |||||||
| Annualized Base Rent (in 000s) | $ | 49,126 | $ | 24,934 | |||||||
| Total number of leases signed or renewed | 47 | 9 | |||||||||
| Total sq. ft. leases signed or renewed | 312,007 | 100,571 | |||||||||
WHLR | Financial & Operating Data | as of 3/31/2023 unless otherwise stated | 5 | ||||
WHLR | Financial & Operating Data | as of 3/31/2023 unless otherwise stated | 6 | ||||
WHLR | Financial & Operating Data | as of 3/31/2023 unless otherwise stated | 7 | ||||
March 31, 2023 | December 31, 2022 | ||||||||||
| (unaudited) | |||||||||||
| ASSETS: | |||||||||||
| Investment properties: | |||||||||||
| Land and land improvements | $ | 145,382 | $ | 144,537 | |||||||
| Buildings and improvements | 497,889 | 494,668 | |||||||||
| 643,271 | 639,205 | ||||||||||
| Less accumulated depreciation | (82,358) | (78,225) | |||||||||
| Investment properties, net | 560,913 | 560,980 | |||||||||
| Cash and cash equivalents | 24,817 | 28,491 | |||||||||
| Restricted cash | 27,304 | 27,374 | |||||||||
| Rents and other tenant receivables, net | 11,772 | 13,544 | |||||||||
| Above market lease intangibles, net | 2,862 | 3,134 | |||||||||
| Operating lease right-of-use assets | 15,056 | 15,133 | |||||||||
| Deferred costs and other assets, net | 38,429 | 35,880 | |||||||||
| Total Assets | $ | 681,153 | $ | 684,536 | |||||||
| LIABILITIES: | |||||||||||
| Loans payable, net | $ | 467,060 | $ | 466,029 | |||||||
| Below market lease intangibles, net | 22,289 | 23,968 | |||||||||
| Derivative liabilities | 5,259 | 7,111 | |||||||||
| Operating lease liabilities | 16,429 | 16,478 | |||||||||
| Accounts payable, accrued expenses and other liabilities | 20,660 | 18,398 | |||||||||
| Total Liabilities | 531,697 | 531,984 | |||||||||
Series D Cumulative Convertible Preferred Stock (no par value, 6,000,000 shares authorized, 3,148,148 and 3,152,392 shares issued and outstanding, respectively; $115.4 million and $113.4 million aggregate liquidation value, respectively) | 103,621 | 101,518 | |||||||||
| EQUITY: | |||||||||||
Series A Preferred Stock (no par value, 4,500 shares authorized, 562 shares issued and outstanding; $0.6 million in aggregate liquidation value) | 453 | 453 | |||||||||
Series B Convertible Preferred Stock (no par value, 5,000,000 authorized, 3,379,142 shares issued and outstanding, respectively; $84.5 million aggregate liquidation preference) | 44,933 | 44,911 | |||||||||
Common Stock ($0.01 par value, 200,000,000 shares authorized 9,800,211 and 9,793,957 shares issued and outstanding, respectively) | 98 | 98 | |||||||||
| Additional paid-in capital | 235,120 | 234,993 | |||||||||
| Accumulated deficit | (300,982) | (295,617) | |||||||||
| Total Stockholders’ Deficit | (20,378) | (15,162) | |||||||||
| Noncontrolling interests | 66,213 | 66,196 | |||||||||
| Total Equity | 45,835 | 51,034 | |||||||||
| Total Liabilities and Equity | $ | 681,153 | $ | 684,536 | |||||||
WHLR | Financial & Operating Data | as of 3/31/2023 unless otherwise stated | 8 | ||||
| Three Months Ended March 31, | |||||||||||
| 2023 | 2022 | ||||||||||
| REVENUE: | |||||||||||
| Rental revenues | $ | 25,500 | $ | 15,332 | |||||||
| Other revenues | 566 | 165 | |||||||||
| Total Revenue | 26,066 | 15,497 | |||||||||
| OPERATING EXPENSES: | |||||||||||
| Property operations | 8,955 | 5,250 | |||||||||
| Depreciation and amortization | 7,466 | 3,616 | |||||||||
| Impairment of assets held for sale | — | 660 | |||||||||
| Corporate general & administrative | 3,071 | 1,264 | |||||||||
| Total Operating Expenses | 19,492 | 10,790 | |||||||||
| Loss on disposal of properties | — | (15) | |||||||||
| Operating Income | 6,574 | 4,692 | |||||||||
| Interest income | 47 | 13 | |||||||||
| Interest expense | (6,477) | (4,628) | |||||||||
| Net changes in fair value of derivative liabilities | 1,852 | (3,962) | |||||||||
| Other expense | (2,405) | (691) | |||||||||
| Net Loss | (409) | (4,576) | |||||||||
| Less: Net income attributable to noncontrolling interests | 2,692 | 4 | |||||||||
| Net Loss Attributable to Wheeler REIT | (3,101) | (4,580) | |||||||||
| Preferred Stock dividends - undeclared | (2,264) | (2,264) | |||||||||
| Net Loss Attributable to Wheeler REIT Common Stockholders | $ | (5,365) | $ | (6,844) | |||||||
| Loss per share: | |||||||||||
| Basic and Diluted | $ | (0.55) | $ | (0.70) | |||||||
| Weighted-average number of shares: | |||||||||||
| Basic and Diluted | 9,794,026 | 9,720,589 | |||||||||
WHLR | Financial & Operating Data | as of 3/31/2023 unless otherwise stated | 9 | ||||
| Three Months Ended March 31, | ||||||||||||||
| 2023 | 2022 | |||||||||||||
| Net Loss | $ | (409) | $ | (4,576) | ||||||||||
| Depreciation and amortization of real estate assets | 7,466 | 3,616 | ||||||||||||
| Impairment of assets held for sale | — | 660 | ||||||||||||
| Loss on disposal of properties | — | 15 | ||||||||||||
| FFO | 7,057 | (285) | ||||||||||||
| Preferred stock dividends - undeclared | (2,264) | (2,264) | ||||||||||||
| Dividends on noncontrolling interests preferred stock | (2,688) | — | ||||||||||||
| Preferred stock accretion adjustments | 147 | 146 | ||||||||||||
| FFO available to common stockholders and common unitholders | 2,252 | (2,403) | ||||||||||||
Other non-recurring and non-cash expenses (2) | 2,673 | 677 | ||||||||||||
| Net changes in fair value of derivative liabilities | (1,852) | 3,962 | ||||||||||||
| Straight-line rental revenue, net straight-line expense | (403) | (69) | ||||||||||||
| Loan cost amortization | 479 | 420 | ||||||||||||
| Above (below) market lease amortization | (1,396) | 23 | ||||||||||||
| Recurring capital expenditures and tenant improvement reserves | (409) | (270) | ||||||||||||
| AFFO | $ | 1,344 | $ | 2,340 | ||||||||||
| Weighted Average Common Shares | 9,794,026 | 9,720,589 | ||||||||||||
| Weighted Average Common Units | 144,942 | 215,343 | ||||||||||||
| Total Common Shares and Units | 9,938,968 | 9,935,932 | ||||||||||||
| FFO per Common Share and Common Units | $ | 0.23 | $ | (0.24) | ||||||||||
| AFFO per Common Share and Common Units | $ | 0.14 | $ | 0.24 | ||||||||||
WHLR | Financial & Operating Data | as of 3/31/2023 unless otherwise stated | 10 | ||||
| Three Months Ended March 31, | |||||||||||
| 2023 | 2022 | ||||||||||
| Operating Income | $ | 6,574 | $ | 4,692 | |||||||
| Adjustments: | |||||||||||
| Loss on disposal of properties | — | 15 | |||||||||
| Corporate general & administrative | 3,071 | 1,264 | |||||||||
| Impairment of assets held for sale | — | 660 | |||||||||
| Depreciation and amortization | 7,466 | 3,616 | |||||||||
| Straight-line rents | (346) | (77) | |||||||||
| Above (below) market lease amortization | (1,396) | 23 | |||||||||
| Other non-property revenue | (245) | (7) | |||||||||
NOI related to non-same store properties (2) | (4,735) | (218) | |||||||||
| Same Store Property Net Operating Income | $ | 10,389 | $ | 9,968 | |||||||
| Property revenues | $ | 15,562 | $ | 15,143 | |||||||
| Property expenses | 5,173 | 5,175 | |||||||||
| Same Store Property Net Operating Income | $ | 10,389 | $ | 9,968 | |||||||
WHLR | Financial & Operating Data | as of 3/31/2023 unless otherwise stated | 11 | ||||
| Three Months Ended March 31, | ||||||||||||||
| 2023 | 2022 | |||||||||||||
Net Loss | $ | (409) | $ | (4,576) | ||||||||||
Add back: | Depreciation and amortization (1) | 6,070 | 3,639 | |||||||||||
Interest expense (2) | 6,477 | 4,628 | ||||||||||||
EBITDA | 12,138 | 3,691 | ||||||||||||
| Adjustments for items affecting comparability: | ||||||||||||||
| Net changes in FMV of derivative liabilities | (1,852) | 3,962 | ||||||||||||
Other non-recurring and non-cash expenses (3) | 2,665 | 667 | ||||||||||||
Impairment of assets held for sale | — | 660 | ||||||||||||
Loss on disposal of properties | — | 15 | ||||||||||||
Adjusted EBITDA | $ | 12,951 | $ | 8,995 | ||||||||||
WHLR | Financial & Operating Data | as of 3/31/2023 unless otherwise stated | 12 | ||||
| Property/Description | Monthly Payment | Interest Rate | Maturity | March 31, 2023 | December 31, 2022 | |||||||||||||||||||||||||||
| Cypress Shopping Center | $ | 34,360 | 4.70 | % | July 2024 | $ | 5,870 | $ | 5,903 | |||||||||||||||||||||||
| Port Crossing | $ | 34,788 | 4.84 | % | August 2024 | 5,605 | 5,641 | |||||||||||||||||||||||||
| Freeway Junction | $ | 41,798 | 4.60 | % | September 2024 | 7,231 | 7,273 | |||||||||||||||||||||||||
| Harrodsburg Marketplace | $ | 19,112 | 4.55 | % | September 2024 | 3,165 | 3,186 | |||||||||||||||||||||||||
| Bryan Station | $ | 23,489 | 4.52 | % | November 2024 | 4,112 | 4,136 | |||||||||||||||||||||||||
| Crockett Square | Interest only | 4.47 | % | December 2024 | 6,338 | 6,338 | ||||||||||||||||||||||||||
| Pierpont Centre | $ | 39,435 | 4.15 | % | February 2025 | 7,678 | 7,716 | |||||||||||||||||||||||||
| Shoppes at Myrtle Park | $ | 33,180 | 4.45 | % | February 2025 | 5,578 | 5,615 | |||||||||||||||||||||||||
| Alex City Marketplace | Interest only | 3.95 | % | April 2025 | 5,750 | 5,750 | ||||||||||||||||||||||||||
| Brook Run Shopping Center | Interest only | 4.08 | % | June 2025 | 10,950 | 10,950 | ||||||||||||||||||||||||||
| Beaver Ruin Village I and II | Interest only | 4.73 | % | July 2025 | 9,400 | 9,400 | ||||||||||||||||||||||||||
| Sunshine Shopping Plaza | Interest only | 4.57 | % | August 2025 | 5,900 | 5,900 | ||||||||||||||||||||||||||
| Barnett Portfolio (1) | Interest only | 4.30 | % | September 2025 | 8,770 | 8,770 | ||||||||||||||||||||||||||
| Fort Howard Shopping Center | Interest only | 4.57 | % | October 2025 | 7,100 | 7,100 | ||||||||||||||||||||||||||
| Conyers Crossing | Interest only | 4.67 | % | October 2025 | 5,960 | 5,960 | ||||||||||||||||||||||||||
| Grove Park Shopping Center | Interest only | 4.52 | % | October 2025 | 3,800 | 3,800 | ||||||||||||||||||||||||||
| Parkway Plaza | Interest only | 4.57 | % | October 2025 | 3,500 | 3,500 | ||||||||||||||||||||||||||
| Winslow Plaza | $ | 24,295 | 4.82 | % | December 2025 | 4,389 | 4,409 | |||||||||||||||||||||||||
| Tuckernuck | $ | 32,202 | 5.00 | % | March 2026 | 4,879 | 4,915 | |||||||||||||||||||||||||
| Chesapeake Square | $ | 23,857 | 4.70 | % | August 2026 | 4,083 | 4,106 | |||||||||||||||||||||||||
| Sangaree/Tri-County | $ | 32,329 | 4.78 | % | December 2026 | 6,061 | 6,086 | |||||||||||||||||||||||||
| Riverbridge | Interest only | 4.48 | % | December 2026 | 4,000 | 4,000 | ||||||||||||||||||||||||||
| Franklin Village | $ | 45,336 | 4.93 | % | January 2027 | 8,108 | 8,144 | |||||||||||||||||||||||||
| Village of Martinsville | $ | 89,664 | 4.28 | % | July 2029 | 15,074 | 15,181 | |||||||||||||||||||||||||
| Laburnum Square | Interest only | 4.28 | % | September 2029 | 7,665 | 7,665 | ||||||||||||||||||||||||||
| Rivergate (2) | $ | 100,222 | 4.25 | % | September 2031 | 17,893 | 18,003 | |||||||||||||||||||||||||
| Convertible Notes | Interest only | 7.00 | % | December 2031 | 33,000 | 33,000 | ||||||||||||||||||||||||||
| Guggenheim Loan Agreement (3) | Interest only | 4.25 | % | July 2032 | 75,000 | 75,000 | ||||||||||||||||||||||||||
| JANAF Loan Agreement (4) | Interest only | 5.31 | % | July 2032 | 60,000 | 60,000 | ||||||||||||||||||||||||||
| Guggenheim-Cedar Loan Agreement (5) | Interest only | 5.25 | % | November 2032 | 110,000 | 110,000 | ||||||||||||||||||||||||||
| Patuxent Crossing/Coliseum Marketplace Loan Agreement | Interest only | 6.35 | % | January 2033 | 25,000 | 25,000 | ||||||||||||||||||||||||||
| Total Principal Balance | 481,859 | 482,447 | ||||||||||||||||||||||||||||||
| Unamortized debt issuance cost | (14,799) | (16,418) | ||||||||||||||||||||||||||||||
| Total Loans Payable, net | $ | 467,060 | $ | 466,029 | ||||||||||||||||||||||||||||
WHLR | Financial & Operating Data | as of 3/31/2023 unless otherwise stated | 13 | ||||
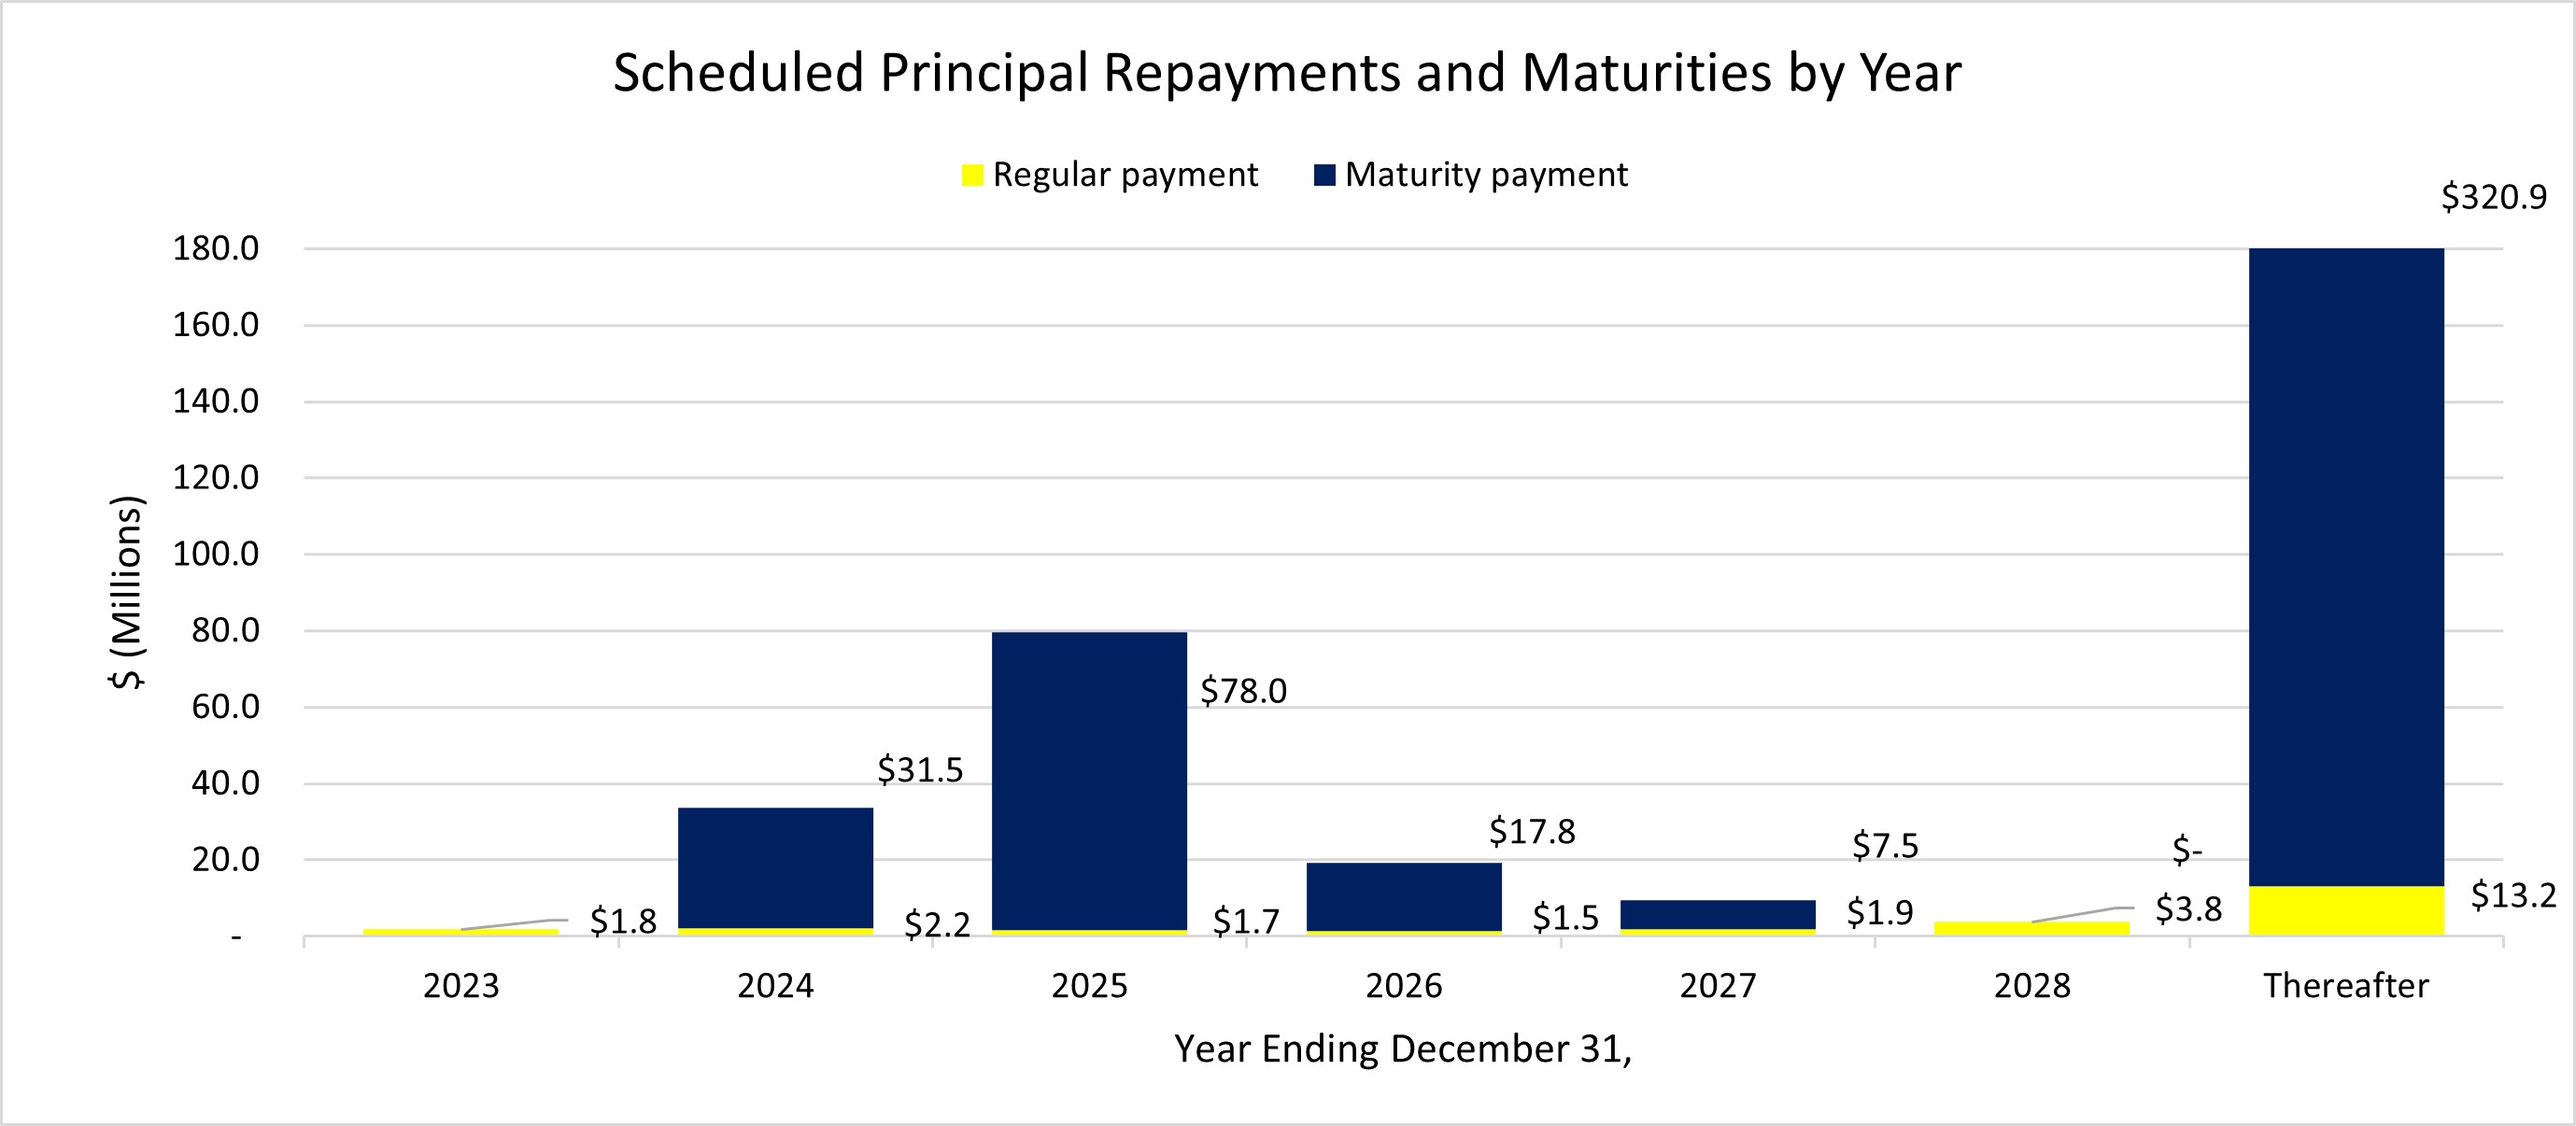
| Scheduled principal repayments and maturities by year | Amount | % Total Principal Payments and Maturities | ||||||||||||
| For the remaining nine months ended December 31, 2023 | $ | 1,755 | 0.36 | % | ||||||||||
| December 31, 2024 | 33,690 | 6.99 | % | |||||||||||
| December 31, 2025 | 79,697 | 16.54 | % | |||||||||||
| December 31, 2026 | 19,347 | 4.02 | % | |||||||||||
| December 31, 2027 | 9,440 | 1.96 | % | |||||||||||
| December 31, 2028 | 3,805 | 0.79 | % | |||||||||||
| Thereafter | 334,125 | 69.34 | % | |||||||||||
| Total principal repayments and debt maturities | $ | 481,859 | 100.00 | % | ||||||||||
| Three Months Ended March 31, | Three Months Ended Changes | ||||||||||||||||||||||
| 2023 | 2022 | Change | % Change | ||||||||||||||||||||
| Property debt interest - excluding Cedar Debt | $ | 3,606 | $ | 3,630 | $ | (24) | (0.7) | % | |||||||||||||||
| Convertible Notes interest | 578 | 578 | — | — | % | ||||||||||||||||||
| Amortization of deferred financing costs | 479 | 420 | 59 | 14.0 | % | ||||||||||||||||||
| Property debt interest - Cedar | 1,814 | — | 1,814 | 100.0 | % | ||||||||||||||||||
| Total Interest Expense | $ | 6,477 | $ | 4,628 | $ | 1,849 | 40.0 | % | |||||||||||||||
WHLR | Financial & Operating Data | as of 3/31/2023 unless otherwise stated | 14 | ||||
Property | Location | Number of Tenants (1) | Total Leasable Square Feet | Percentage Leased (1) | Percentage Occupied | Total SF Occupied | Annualized Base Rent (in 000's) (2) | Annualized Base Rent per Occupied Sq. Foot | ||||||||||||||||||||||||
| WHLR | ||||||||||||||||||||||||||||||||
| Alex City Marketplace | Alexander City, AL | 19 | 151,843 | 100.0 | % | 100.0 | % | 151,843 | $ | 1,273 | $ | 8.38 | ||||||||||||||||||||
| Amscot Building | Tampa, FL | 1 | 2,500 | 100.0 | % | 100.0 | % | 2,500 | 83 | 33.00 | ||||||||||||||||||||||
| Beaver Ruin Village | Lilburn, GA | 29 | 74,038 | 94.7 | % | 94.7 | % | 70,148 | 1,274 | 18.16 | ||||||||||||||||||||||
| Beaver Ruin Village II | Lilburn, GA | 4 | 34,925 | 100.0 | % | 100.0 | % | 34,925 | 465 | 13.32 | ||||||||||||||||||||||
| Brook Run Shopping Center | Richmond, VA | 20 | 147,738 | 87.8 | % | 87.8 | % | 129,710 | 1,138 | 8.77 | ||||||||||||||||||||||
| Brook Run Properties (3) | Richmond, VA | — | — | — | % | — | % | — | — | — | ||||||||||||||||||||||
| Bryan Station | Lexington, KY | 9 | 54,277 | 94.5 | % | 94.5 | % | 51,275 | 597 | 11.65 | ||||||||||||||||||||||
| Cardinal Plaza | Henderson, NC | 9 | 50,000 | 100.0 | % | 100.0 | % | 50,000 | 504 | 10.09 | ||||||||||||||||||||||
| Chesapeake Square | Onley, VA | 14 | 108,982 | 99.1 | % | 99.1 | % | 108,016 | 838 | 7.76 | ||||||||||||||||||||||
| Clover Plaza | Clover, SC | 10 | 45,575 | 100.0 | % | 100.0 | % | 45,575 | 382 | 8.39 | ||||||||||||||||||||||
| Courtland Commons (3) | Courtland, VA | — | — | — | % | — | % | — | — | — | ||||||||||||||||||||||
| Conyers Crossing | Conyers, GA | 12 | 170,475 | 99.4 | % | 97.1 | % | 165,600 | 904 | 5.46 | ||||||||||||||||||||||
| Crockett Square | Morristown, TN | 4 | 107,122 | 100.0 | % | 100.0 | % | 107,122 | 978 | 9.13 | ||||||||||||||||||||||
| Cypress Shopping Center | Boiling Springs, SC | 17 | 80,435 | 59.9 | % | 41.2 | % | 33,175 | 470 | 14.16 | ||||||||||||||||||||||
| Darien Shopping Center | Darien, GA | 1 | 26,001 | 100.0 | % | 100.0 | % | 26,001 | 140 | 5.38 | ||||||||||||||||||||||
| Devine Street | Columbia, SC | 1 | 38,464 | 89.1 | % | 89.1 | % | 34,264 | 180 | 5.25 | ||||||||||||||||||||||
| Edenton Commons (3) | Edenton, NC | — | — | — | % | — | % | — | — | — | ||||||||||||||||||||||
| Folly Road | Charleston, SC | 5 | 47,794 | 100.0 | % | 100.0 | % | 47,794 | 735 | 15.37 | ||||||||||||||||||||||
| Forrest Gallery | Tullahoma, TN | 28 | 214,451 | 90.0 | % | 90.0 | % | 193,024 | 1,426 | 7.39 | ||||||||||||||||||||||
| Fort Howard Shopping Center | Rincon, GA | 20 | 113,652 | 100.0 | % | 100.0 | % | 113,652 | 1,273 | 11.20 | ||||||||||||||||||||||
| Freeway Junction | Stockbridge, GA | 17 | 156,834 | 97.5 | % | 97.5 | % | 152,984 | 1,325 | 8.66 | ||||||||||||||||||||||
| Franklin Village | Kittanning, PA | 25 | 151,821 | 98.0 | % | 98.0 | % | 148,773 | 1,393 | 9.36 | ||||||||||||||||||||||
| Franklinton Square | Franklinton, NC | 15 | 65,366 | 100.0 | % | 100.0 | % | 65,366 | 596 | 9.12 | ||||||||||||||||||||||
| Georgetown | Georgetown, SC | 2 | 29,572 | 100.0 | % | 100.0 | % | 29,572 | 267 | 9.04 | ||||||||||||||||||||||
| Grove Park Shopping Center | Orangeburg, SC | 14 | 93,265 | 100.0 | % | 100.0 | % | 93,265 | 761 | 8.16 | ||||||||||||||||||||||
| Harbor Point (3) | Grove, OK | — | — | — | % | — | % | — | — | — | ||||||||||||||||||||||
| Harrodsburg Marketplace | Harrodsburg, KY | 8 | 60,048 | 91.0 | % | 91.0 | % | 54,648 | 385 | 7.05 | ||||||||||||||||||||||
| JANAF (4) | Norfolk, VA | 119 | 798,086 | 95.5 | % | 95.0 | % | 758,072 | 9,043 | 11.93 | ||||||||||||||||||||||
| Laburnum Square | Richmond, VA | 20 | 109,405 | 99.1 | % | 99.1 | % | 108,445 | 1,005 | 9.26 | ||||||||||||||||||||||
| Ladson Crossing | Ladson, SC | 16 | 52,607 | 100.0 | % | 100.0 | % | 52,607 | 551 | 10.47 | ||||||||||||||||||||||
| LaGrange Marketplace | LaGrange, GA | 14 | 76,594 | 93.7 | % | 93.7 | % | 71,800 | 450 | 6.26 | ||||||||||||||||||||||
| Lake Greenwood Crossing | Greenwood, SC | 8 | 43,618 | 100.0 | % | 100.0 | % | 43,618 | 364 | 8.35 | ||||||||||||||||||||||
| Lake Murray | Lexington, SC | 5 | 39,218 | 100.0 | % | 100.0 | % | 39,218 | 274 | 6.98 | ||||||||||||||||||||||
| Litchfield Market Village | Pawleys Island, SC | 24 | 86,740 | 94.8 | % | 94.8 | % | 82,202 | 1,029 | 12.52 | ||||||||||||||||||||||
| Lumber River Village | Lumberton, NC | 11 | 66,781 | 100.0 | % | 100.0 | % | 66,781 | 474 | 7.09 | ||||||||||||||||||||||
| Moncks Corner | Moncks Corner, SC | 1 | 26,800 | 100.0 | % | 100.0 | % | 26,800 | 330 | 12.31 | ||||||||||||||||||||||
| Nashville Commons | Nashville, NC | 12 | 56,100 | 100.0 | % | 100.0 | % | 56,100 | 646 | 11.52 | ||||||||||||||||||||||
| New Market Crossing | Mt. Airy, NC | 12 | 117,076 | 100.0 | % | 100.0 | % | 117,076 | 1,035 | 8.84 | ||||||||||||||||||||||
| Parkway Plaza | Brunswick, GA | 4 | 52,365 | 81.7 | % | 81.7 | % | 42,785 | 453 | 10.58 | ||||||||||||||||||||||
| Pierpont Centre | Morgantown, WV | 15 | 111,162 | 98.4 | % | 98.4 | % | 109,437 | 1,057 | 9.66 | ||||||||||||||||||||||
| Port Crossing | Harrisonburg, VA | 7 | 65,365 | 100.0 | % | 95.9 | % | 62,715 | 813 | 12.97 | ||||||||||||||||||||||
| Ridgeland | Ridgeland, SC | 1 | 20,029 | 100.0 | % | 100.0 | % | 20,029 | 140 | 7.00 | ||||||||||||||||||||||
| Riverbridge Shopping Center | Carrollton, GA | 11 | 91,188 | 100.0 | % | 100.0 | % | 91,188 | 798 | 8.75 | ||||||||||||||||||||||
| Rivergate Shopping Center | Macon, GA | 23 | 193,960 | 85.5 | % | 85.5 | % | 165,788 | 2,397 | 14.46 | ||||||||||||||||||||||
| Sangaree Plaza | Summerville, SC | 10 | 66,948 | 100.0 | % | 100.0 | % | 66,948 | 716 | 10.70 | ||||||||||||||||||||||
| Shoppes at Myrtle Park | Bluffton, SC | 12 | 56,601 | 95.5 | % | 93.6 | % | 52,980 | 612 | 11.55 | ||||||||||||||||||||||
| South Lake | Lexington, SC | 10 | 44,318 | 97.3 | % | 97.3 | % | 43,118 | 242 | 5.61 | ||||||||||||||||||||||
| South Park | Mullins, SC | 4 | 60,734 | 96.9 | % | 96.9 | % | 58,834 | 379 | 6.43 | ||||||||||||||||||||||
| South Square | Lancaster, SC | 6 | 44,350 | 80.9 | % | 80.9 | % | 35,900 | 303 | 8.44 | ||||||||||||||||||||||
| St. George Plaza | St. George, SC | 8 | 59,174 | 100.0 | % | 100.0 | % | 59,174 | 401 | 6.78 | ||||||||||||||||||||||
| Sunshine Plaza | Lehigh Acres, FL | 23 | 111,189 | 100.0 | % | 100.0 | % | 111,189 | 1,114 | 10.02 | ||||||||||||||||||||||
| Surrey Plaza | Hawkinsville, GA | 4 | 42,680 | 100.0 | % | 100.0 | % | 42,680 | 258 | 6.05 | ||||||||||||||||||||||
WHLR | Financial & Operating Data | as of 3/31/2023 unless otherwise stated | 15 | ||||
Property | Location | Number of Tenants (1) | Total Leasable Square Feet | Percentage Leased (1) | Percentage Occupied | Total SF Occupied | Annualized Base Rent (in 000's) (2) | Annualized Base Rent per Occupied Sq. Foot | ||||||||||||||||||||||||
| Tampa Festival | Tampa, FL | 19 | 141,580 | 98.9 | % | 66.7 | % | 94,380 | $ | 933 | $ | 9.89 | ||||||||||||||||||||
| Tri-County Plaza | Royston, GA | 8 | 67,577 | 92.0 | % | 92.0 | % | 62,177 | 445 | 7.15 | ||||||||||||||||||||||
| Tuckernuck | Richmond, VA | 17 | 93,440 | 98.6 | % | 98.6 | % | 92,173 | 1,040 | 11.28 | ||||||||||||||||||||||
| Twin City Commons | Batesburg-Leesville, SC | 5 | 47,680 | 100.0 | % | 100.0 | % | 47,680 | 488 | 10.23 | ||||||||||||||||||||||
| Village of Martinsville | Martinsville, VA | 22 | 288,254 | 100.0 | % | 100.0 | % | 288,254 | 2,364 | 8.20 | ||||||||||||||||||||||
| Waterway Plaza | Little River, SC | 10 | 49,750 | 100.0 | % | 100.0 | % | 49,750 | 503 | 10.12 | ||||||||||||||||||||||
| Westland Square | West Columbia, SC | 10 | 62,735 | 75.5 | % | 75.5 | % | 47,390 | 424 | 8.94 | ||||||||||||||||||||||
| Winslow Plaza | Sicklerville, NJ | 18 | 40,695 | 100.0 | % | 100.0 | % | 40,695 | 658 | 16.17 | ||||||||||||||||||||||
| WHLR TOTAL | 773 | 5,309,977 | 95.8 | % | 94.5 | % | 5,017,215 | $ | 49,126 | $ | 9.79 | |||||||||||||||||||||
| CDR | ||||||||||||||||||||||||||||||||
| Brickyard Plaza | Berlin, CT | 9 | 227,598 | 97.8 | % | 97.0 | % | 220,821 | 1,976 | 8.95 | ||||||||||||||||||||||
| Carll's Corner | Bridgeton, NJ | 5 | 129,582 | 27.5 | % | 21.1 | % | 27,324 | 400 | 14.63 | ||||||||||||||||||||||
| Coliseum Marketplace | Hampton, VA | 10 | 106,648 | 100.0 | % | 100.0 | % | 106,648 | 1,162 | 10.89 | ||||||||||||||||||||||
| Fairview Commons | New Cumberland, PA | 10 | 52,964 | 77.5 | % | 77.5 | % | 41,064 | 449 | 10.93 | ||||||||||||||||||||||
| Fieldstone Marketplace | New Bedford, MA | 9 | 193,970 | 70.9 | % | 70.9 | % | 137,569 | 1,636 | 11.90 | ||||||||||||||||||||||
| Gold Star Plaza | Shenandoah, PA | 6 | 71,720 | 97.8 | % | 97.8 | % | 70,120 | 641 | 9.14 | ||||||||||||||||||||||
| Golden Triangle | Lancaster, PA | 19 | 202,790 | 98.4 | % | 98.4 | % | 199,605 | 2,611 | 13.08 | ||||||||||||||||||||||
| Hamburg Square | Hamburg, PA | 7 | 102,058 | 100.0 | % | 100.0 | % | 102,058 | 684 | 6.70 | ||||||||||||||||||||||
| Kings Plaza | New Bedford, MA | 16 | 168,243 | 82.2 | % | 82.2 | % | 138,239 | 1,227 | 8.87 | ||||||||||||||||||||||
| Oakland Commons | Bristol, CT | 2 | 90,100 | 100.0 | % | 100.0 | % | 90,100 | 574 | 6.37 | ||||||||||||||||||||||
| Oregon Avenue | Philadelphia, PA | 1 | 20,380 | 100.0 | % | 5.8 | % | 1,180 | 40 | 34.21 | ||||||||||||||||||||||
| Patuxent Crossing | California, MD | 29 | 264,068 | 83.9 | % | 83.9 | % | 221,515 | 2,224 | 10.04 | ||||||||||||||||||||||
| Pine Grove Plaza | Brown Mills, NJ | 13 | 79,306 | 78.1 | % | 78.1 | % | 61,966 | 736 | 11.87 | ||||||||||||||||||||||
| South Philadelphia | Philadelphia, PA | 10 | 221,511 | 90.1 | % | 71.8 | % | 159,131 | 1,445 | 9.08 | ||||||||||||||||||||||
| Southington Center | Southington, CT | 11 | 155,842 | 100.0 | % | 100.0 | % | 155,842 | 1,293 | 8.30 | ||||||||||||||||||||||
| Timpany Plaza | Gardner, MA | 14 | 182,799 | 63.3 | % | 63.3 | % | 115,735 | 1,116 | 9.64 | ||||||||||||||||||||||
| Trexler Mall | Trexlertown, PA | 23 | 336,687 | 98.2 | % | 98.2 | % | 330,634 | 3,687 | 11.15 | ||||||||||||||||||||||
| Washington Center Shoppes | Sewell, NJ | 28 | 157,300 | 94.0 | % | 94.0 | % | 147,856 | 1,814 | 12.27 | ||||||||||||||||||||||
| Webster Commons | Webster, MA | 9 | 98,984 | 100.0 | % | 100.0 | % | 98,984 | 1,219 | 12.32 | ||||||||||||||||||||||
| CDR TOTAL | 231 | 2,862,550 | 87.2 | % | 84.8 | % | 2,426,391 | $ | 24,934 | $ | 10.28 | |||||||||||||||||||||
| COMBINED TOTAL | 1,004 | 8,172,527 | 92.8 | % | 91.1 | % | 7,443,606 | $ | 74,060 | $ | 9.95 | |||||||||||||||||||||
WHLR | Financial & Operating Data | as of 3/31/2023 unless otherwise stated | 16 | ||||

WHLR | Financial & Operating Data | as of 3/31/2023 unless otherwise stated | 17 | ||||
| Tenants | Category | Annualized Base Rent ($ in 000s) | % of Total Annualized Base Rent | Total Occupied Square Feet | Percent Total Leasable Square Foot | Base Rent Per Occupied Square Foot | |||||||||||||||||||||||||||||||||||
| Food Lion | Grocery | $ | 4,435 | 6.00 | % | 549,000 | 6.72 | % | $ | 8.08 | |||||||||||||||||||||||||||||||
Kroger Co (1) | Grocery | 2,097 | 2.84 | % | 239,000 | 2.92 | % | 8.77 | |||||||||||||||||||||||||||||||||
Dollar Tree (2) | Discount Retailer | 2,061 | 2.79 | % | 244,000 | 2.99 | % | 8.45 | |||||||||||||||||||||||||||||||||
| Piggly Wiggly | Grocery | 1,509 | 2.04 | % | 203,000 | 2.48 | % | 7.43 | |||||||||||||||||||||||||||||||||
| Planet Fitness | Gym | 1,497 | 2.03 | % | 140,000 | 1.71 | % | 10.69 | |||||||||||||||||||||||||||||||||
TJX Companies (4) | Discount Retailer | 1,186 | 1.61 | % | 195,000 | 2.39 | % | 6.08 | |||||||||||||||||||||||||||||||||
Lowes Foods (3) | Grocery | 1,181 | 1.60 | % | 130,000 | 1.59 | % | 9.08 | |||||||||||||||||||||||||||||||||
| Big Lots | Discount Retailer | 1,100 | 1.49 | % | 171,000 | 2.09 | % | 6.43 | |||||||||||||||||||||||||||||||||
| Kohl's | Discount Retailer | 1,031 | 1.40 | % | 147,000 | 1.80 | % | 7.01 | |||||||||||||||||||||||||||||||||
| Winn Dixie | Grocery | 984 | 1.33 | % | 134,000 | 1.64 | % | 7.34 | |||||||||||||||||||||||||||||||||
| $ | 17,081 | 23.13 | % | 2,152,000 | 26.33 | % | $ | 7.94 | |||||||||||||||||||||||||||||||||
| Lease Expiration Period | Number of Expiring Leases | Total Expiring Square Footage | % of Total Expiring Square Footage | % of Total Occupied Square Footage Expiring | Expiring Annualized Base Rent (in 000s) | % of Total Annualized Base Rent | Expiring Base Rent Per Occupied Square Foot | |||||||||||||||||||||||||||||||||||||
| Available | — | 728,921 | 8.92 | % | — | % | $ | — | — | % | $ | — | ||||||||||||||||||||||||||||||||
| MTM | 16 | 62,983 | 0.77 | % | 0.85 | % | 827 | 1.12 | % | 13.13 | ||||||||||||||||||||||||||||||||||
| 2023 | 78 | 343,165 | 4.20 | % | 4.61 | % | 3,807 | 5.14 | % | 11.09 | ||||||||||||||||||||||||||||||||||
| 2024 | 163 | 858,092 | 10.50 | % | 11.53 | % | 9,183 | 12.40 | % | 10.70 | ||||||||||||||||||||||||||||||||||
| 2025 | 167 | 1,056,014 | 12.92 | % | 14.19 | % | 10,678 | 14.42 | % | 10.11 | ||||||||||||||||||||||||||||||||||
| 2026 | 155 | 907,527 | 11.10 | % | 12.19 | % | 9,955 | 13.44 | % | 10.97 | ||||||||||||||||||||||||||||||||||
| 2027 | 140 | 700,250 | 8.57 | % | 9.41 | % | 8,307 | 11.22 | % | 11.86 | ||||||||||||||||||||||||||||||||||
| 2028 | 95 | 1,183,267 | 14.48 | % | 15.9 | % | 9,937 | 13.42 | % | 8.40 | ||||||||||||||||||||||||||||||||||
| 2029 | 54 | 485,306 | 5.94 | % | 6.52 | % | 4,643 | 6.27 | % | 9.57 | ||||||||||||||||||||||||||||||||||
| 2030 | 34 | 531,752 | 6.51 | % | 7.14 | % | 3,915 | 5.29 | % | 7.36 | ||||||||||||||||||||||||||||||||||
| 2031 | 29 | 397,046 | 4.86 | % | 5.33 | % | 3,884 | 5.24 | % | 9.78 | ||||||||||||||||||||||||||||||||||
| 2032 & thereafter | 73 | 918,204 | 11.23 | % | 12.33 | % | 8,924 | 12.04 | % | 9.72 | ||||||||||||||||||||||||||||||||||
| Total | 1,004 | 8,172,527 | 100.00 | % | 100.00 | % | $ | 74,060 | 100.00 | % | $ | 9.95 | ||||||||||||||||||||||||||||||||
WHLR | Financial & Operating Data | as of 3/31/2023 unless otherwise stated | 18 | ||||
| No Option | Option | ||||||||||||||||||||||||||||||||||
| Lease Expiration Period | Number of Expiring Leases | Expiring Occupied Square Footage | Expiring Annualized Based Rent (in 000s) | % of Total Annualized Base Rent | Expiring Base Rent per Square Foot | Number of Expiring Leases | Expiring Occupied Square Footage | Expiring Annualized Based Rent (in 000s) | % of Total Annualized Base Rent | Expiring Base Rent per Square Foot | |||||||||||||||||||||||||
| Available | — | 228,444 | $ | — | — | % | $ | — | — | — | $ | — | — | % | $ | — | |||||||||||||||||||
| Month-to-Month | 1 | 20,300 | 117 | 3.79 | % | 5.76 | — | — | — | — | % | — | |||||||||||||||||||||||
| 2023 | 1 | 33,227 | 673 | 21.79 | % | 20.25 | 4 | 127,516 | 773 | 2.63 | % | 6.06 | |||||||||||||||||||||||
| 2024 | 1 | 32,000 | 125 | 4.05 | % | 3.91 | 10 | 417,569 | 3,308 | 11.27 | % | 7.92 | |||||||||||||||||||||||
| 2025 | 2 | 57,297 | 455 | 14.73 | % | 7.94 | 13 | 520,075 | 3,699 | 12.60 | % | 7.11 | |||||||||||||||||||||||
| 2026 | 1 | 20,152 | 97 | 3.14 | % | 4.81 | 14 | 456,864 | 3,822 | 13.02 | % | 8.37 | |||||||||||||||||||||||
| 2027 | 3 | 69,819 | 629 | 20.36 | % | 9.01 | 5 | 149,546 | 1,221 | 4.16 | % | 8.16 | |||||||||||||||||||||||
| 2028 | — | — | — | — | % | — | 21 | 868,983 | 5,978 | 20.37 | % | 6.88 | |||||||||||||||||||||||
| 2029 | 3 | 71,939 | 772 | 24.99 | % | 10.73 | 6 | 174,928 | 1,014 | 3.46 | % | 5.80 | |||||||||||||||||||||||
| 2030 | — | — | — | — | % | — | 8 | 452,724 | 2,498 | 8.51 | % | 5.52 | |||||||||||||||||||||||
| 2031 | 1 | 20,858 | 60 | 1.94 | % | 2.88 | 5 | 250,354 | 2,304 | 7.85 | % | 9.20 | |||||||||||||||||||||||
| 2032+ | 2 | 66,189 | 161 | 5.21 | % | 2.43 | 17 | 671,752 | 4,729 | 16.13 | % | 7.04 | |||||||||||||||||||||||
| Total | 15 | 620,225 | $ | 3,089 | 100.00 | % | $ | 7.88 | 103 | 4,090,311 | $ | 29,346 | 100.00 | % | $ | 7.17 | |||||||||||||||||||
| No Option | Option | ||||||||||||||||||||||||||||||||||
| Lease Expiration Period | Number of Expiring Leases | Expiring Occupied Square Footage | Expiring Annualized Based Rent (in 000s) | % of Total Annualized Base Rent | Expiring Base Rent per Square Foot | Number of Expiring Leases | Expiring Occupied Square Footage | Expiring Annualized Based Rent (in 000s) | % of Total Annualized Base Rent | Expiring Base Rent per Square Foot | |||||||||||||||||||||||||
| Available | — | 500,477 | $ | — | — | % | $ | — | — | — | $ | — | — | % | $ | — | |||||||||||||||||||
| Month-to-Month | 13 | 32,433 | 464 | 2.58 | % | 14.31 | 2 | 10,250 | 246 | 1.04 | % | — | |||||||||||||||||||||||
| 2023 | 47 | 120,227 | 1,486 | 8.27 | % | 12.36 | 26 | 62,195 | 875 | 3.70 | % | 14.07 | |||||||||||||||||||||||
| 2024 | 97 | 201,112 | 2,822 | 15.71 | % | 14.03 | 55 | 207,411 | 2,928 | 12.37 | % | 14.12 | |||||||||||||||||||||||
| 2025 | 95 | 237,212 | 3,129 | 17.42 | % | 13.19 | 57 | 241,430 | 3,395 | 14.35 | % | 14.06 | |||||||||||||||||||||||
| 2026 | 81 | 204,347 | 2,818 | 15.69 | % | 13.79 | 59 | 226,164 | 3,218 | 13.60 | % | 14.23 | |||||||||||||||||||||||
| 2027 | 80 | 224,501 | 3,401 | 18.94 | % | 15.15 | 52 | 256,384 | 3,056 | 12.91 | % | 11.92 | |||||||||||||||||||||||
| 2028 | 36 | 112,170 | 1,542 | 8.59 | % | 13.75 | 38 | 202,114 | 2,417 | 10.21 | % | 11.96 | |||||||||||||||||||||||
| 2029 | 15 | 39,975 | 482 | 2.68 | % | 12.06 | 30 | 198,464 | 2,375 | 10.04 | % | 11.97 | |||||||||||||||||||||||
| 2030 | 13 | 28,738 | 516 | 2.87 | % | 17.96 | 13 | 50,290 | 901 | 3.81 | % | 17.92 | |||||||||||||||||||||||
| 2031 | 5 | 12,623 | 187 | 1.04 | % | 14.81 | 18 | 113,211 | 1,333 | 5.63 | % | 11.77 | |||||||||||||||||||||||
| 2032+ | 22 | 68,908 | 1,114 | 6.21 | % | 16.17 | 32 | 111,355 | 2,920 | 12.34 | % | 26.22 | |||||||||||||||||||||||
| Total | 504 | 1,782,723 | $ | 17,961 | 100.00 | % | $ | 14.01 | 382 | 1,679,268 | $ | 23,664 | 100.00 | % | $ | 14.09 | |||||||||||||||||||
WHLR | Financial & Operating Data | as of 3/31/2023 unless otherwise stated | 19 | ||||
| WHLR Leasing Renewals and New Leases | | |||||||||||||
| Three Months Ended March 31, | |||||||||||
| 2023 | 2022 | ||||||||||
Renewals(1): | |||||||||||
| Leases renewed with rate increase (sq feet) | 237,555 | 66,348 | |||||||||
| Leases renewed with rate decrease (sq feet) | — | 5,328 | |||||||||
| Leases renewed with no rate change (sq feet) | 25,232 | 20,329 | |||||||||
| Total leases renewed (sq feet) | 262,787 | 92,005 | |||||||||
| Leases renewed with rate increase (count) | 35 | 20 | |||||||||
| Leases renewed with rate decrease (count) | — | 2 | |||||||||
| Leases renewed with no rate change (count) | 3 | 12 | |||||||||
| Total leases renewed (count) | 38 | 34 | |||||||||
| Option exercised (count) | 7 | 2 | |||||||||
| Weighted average on rate increases (per sq foot) | $ | 0.73 | $ | 1.15 | |||||||
| Weighted average on rate decreases (per sq foot) | $ | — | $ | (2.13) | |||||||
| Weighted average rate on all renewals (per sq foot) | $ | 0.66 | $ | 0.71 | |||||||
| Weighted average change over prior rates | 6.89 | % | 5.86 | % | |||||||
New Leases(1) (2): | |||||||||||
| New leases (sq feet) | 49,220 | 68,919 | |||||||||
| New leases (count) | 9 | 23 | |||||||||
| Weighted average rate (per sq foot) | $ | 16.14 | $ | 13.09 | |||||||
WHLR | Financial & Operating Data | as of 3/31/2023 unless otherwise stated | 20 | ||||
| CDR Leasing Renewals and New Leases | | |||||||||||||
| Three Months Ended March 31, | |||||
| 2023 | |||||
Renewals(1): | |||||
| Leases renewed with rate increase (sq feet) | 56,171 | ||||
| Leases renewed with rate decrease (sq feet) | — | ||||
| Leases renewed with no rate change (sq feet) | 2,000 | ||||
| Total leases renewed (sq feet) | 58,171 | ||||
| Leases renewed with rate increase (count) | 5 | ||||
| Leases renewed with rate decrease (count) | — | ||||
| Leases renewed with no rate change (count) | 1 | ||||
| Total leases renewed (count) | 6 | ||||
| Option exercised (count) | 2 | ||||
| Weighted average on rate increases (per sq foot) | $ | 0.42 | |||
| Weighted average on rate decreases (per sq foot) | $ | — | |||
| Weighted average rate on all renewals (per sq foot) | $ | 0.40 | |||
| Weighted average change over prior rates | 3.96 | % | |||
New Leases(1) (2): | |||||
| New leases (sq feet) | 42,400 | ||||
| New leases (count) | 3 | ||||
| Weighted average rate (per sq foot) | $ | 13.07 | |||
WHLR | Financial & Operating Data | as of 3/31/2023 unless otherwise stated | 21 | ||||
WHLR | Financial & Operating Data | as of 3/31/2023 unless otherwise stated | 22 | ||||
WHLR | Financial & Operating Data | as of 3/31/2023 unless otherwise stated | 23 | ||||