| Table of Contents | |||||
| Page | |||||
| Company Overview | |||||
| Financial and Portfolio Overview | |||||
| Financial and Operating Results | |||||
| Financial Summary | |||||
| Consolidated Balance Sheets | |||||
| Consolidated Statements of Operations | |||||
| Reconciliation of Non-GAAP Measures | |||||
| Debt Summary | |||||
| Portfolio Summary | |||||
| Property Summary | |||||
| Top Ten Tenants by Annualized Base Rent and Lease Expiration Schedule | |||||
| Leasing Summary | |||||
| Definitions | |||||
WHLR | Financial & Operating Data | 2 | ||||
WHLR | Financial & Operating Data | 3 | ||||
| Corporate Headquarters | ||||||||
| Wheeler Real Estate Investment Trust, Inc. | ||||||||
| 2529 Virginia Beach Boulevard Virginia Beach, VA 23452 | ||||||||
| Phone: (757) 627-9088 Toll Free: (866) 203-4864 | ||||||||
| Website: www.whlr.us | ||||||||
| Executive Management | ||||||||
| M. Andrew Franklin - CEO and President | ||||||||
| Crystal Plum - CFO | ||||||||
 |  | |||||||
| Board of Directors | Board of Directors | |||||||
Stefani D. Carter (Chair) | Kerry G. Campbell | |||||||
Michelle D. Bergman | E. J. Borrack | |||||||
E. J. Borrack | M. Andrew Franklin | |||||||
Kerry G. Campbell | Paula Poskon | |||||||
Saverio M. Flemma | Crystal Plum | |||||||
| Megan Parisi | ||||||||
| Joseph D. Stilwell | ||||||||
| Stock Transfer Agent and Registrar | Stock Transfer Agent and Registrar | |||||||
| Computershare Trust Company, N.A. 150 Royall Street, Suite 101 Canton, MA 02021 www.computershare.com | American Stock Transfer & Trust Co. 6201 15th Ave Brooklyn, NY 11219 www.amstock.com | |||||||
| Investor Relations Representative | ||||||||
| investorrelations@whlr.us Office: (757) 627-9088 | ||||||||
WHLR | Financial & Operating Data | 4 | ||||
Financial Results | |||||
| Net loss attributable to Wheeler REIT common stockholders (in 000s) | $ | (5,846) | |||
| Net loss per basic and diluted shares | $ | (0.60) | |||
Funds from operations available to common stockholders and Operating Partnership (OP) unitholders (FFO) (in 000s) (1) | $ | (942) | |||
| FFO per common share and OP unit | $ | (0.09) | |||
Adjusted FFO (AFFO) (in 000s) (1) | $ | 1,818 | |||
| AFFO per common share and OP unit | $ | 0.18 | |||
Assets and Leverage | |||||
| Investment Properties, net of $78.2 million accumulated depreciation (in 000s) | $ | 560,980 | |||
| Cash and Cash Equivalents (in 000s) | $ | 28,491 | |||
| Total Assets (in 000s) | $ | 684,536 | |||
| Total Debt (in 000s) | $ | 482,447 | |||
| Debt to Total Assets | 70.48 | % | |||
| Debt to Gross Asset Value | 62.81 | % | |||
Market Capitalization | |||||
| Common shares outstanding | 9,793,957 | ||||
| OP units outstanding | 144,942 | ||||
| Total common shares and OP units | 9,938,899 | ||||
Ticker | Shares Outstanding at December 31, 2022 | Fourth Quarter stock price range | Stock price as of December 31, 2022 | ||||||||||||||
| WHLR | 9,793,957 | $1.22-$1.99 | $ | 1.40 | |||||||||||||
| WHLRP | 3,379,142 | $1.26-$3.30 | $ | 1.52 | |||||||||||||
| WHLRD | 3,152,392 | $10.01-$13.37 | $ | 12.84 | |||||||||||||
| CDRpB | 1,450,000 | $8.10-$16.99 | $ | 14.51 | |||||||||||||
| CDRpC | 5,000,000 | $6.66-$12.92 | $ | 11.76 | |||||||||||||
Common Stock market capitalization (as of December 31, 2022 closing stock price, in 000s) | 13,712 | ||||
Portfolio Summary | | | |||||||||
| Total Leasable Area (GLA) in sq. ft. | 5,309,977 | 2,862,550 | |||||||||
| Occupancy Rate | 94.7 | % | 82.3 | % | |||||||
Leased Rate (2) | 96.5 | % | 86.2 | % | |||||||
| Annualized Base Rent (in 000s) | $ | 48,996 | $ | 24,244 | |||||||
| Total number of leases signed or renewed | 41 | 16 | |||||||||
| Total sq. ft. leases signed or renewed | 287,884 | 267,707 | |||||||||
WHLR | Financial & Operating Data | as of 12/31/2022 unless otherwise stated | 5 | ||||
WHLR | Financial & Operating Data | as of 12/31/2022 unless otherwise stated | 6 | ||||
WHLR | Financial & Operating Data | as of 12/31/2022 unless otherwise stated | 7 | ||||
WHLR | Financial & Operating Data | as of 12/31/2022 unless otherwise stated | 8 | ||||
WHLR | Financial & Operating Data | as of 12/31/2022 unless otherwise stated | 9 | ||||
| December 31, | |||||||||||
| 2022 | 2021 | ||||||||||
| ASSETS: | |||||||||||
| Investment properties, net | $ | 560,980 | $ | 386,730 | |||||||
| Cash and cash equivalents | 28,491 | 22,898 | |||||||||
| Restricted cash | 27,374 | 17,521 | |||||||||
| Rents and other tenant receivables, net | 13,544 | 9,233 | |||||||||
| Assets held for sale | — | 2,047 | |||||||||
| Above market lease intangibles, net | 3,134 | 2,424 | |||||||||
| Operating lease right-of-use assets | 15,133 | 12,455 | |||||||||
| Deferred costs and other assets, net | 35,880 | 11,973 | |||||||||
| Total Assets | $ | 684,536 | $ | 465,281 | |||||||
| LIABILITIES: | |||||||||||
| Loans payable, net | $ | 466,029 | $ | 333,283 | |||||||
| Liabilities associated with assets held for sale | — | 3,381 | |||||||||
| Below market lease intangibles, net | 23,968 | 3,397 | |||||||||
| Derivative liabilities | 7,111 | 4,776 | |||||||||
| Operating lease liabilities | 16,478 | 13,040 | |||||||||
| Accounts payable, accrued expenses and other liabilities | 18,398 | 11,054 | |||||||||
| Total Liabilities | 531,984 | 368,931 | |||||||||
Series D Cumulative Convertible Preferred Stock (no par value, 6,000,000 shares authorized, 3,152,392 shares issued and outstanding, respectively; $113.44 million and $104.97 million aggregate liquidation value, respectively) | 101,518 | 92,548 | |||||||||
| EQUITY: | |||||||||||
Series A Preferred Stock (no par value, 4,500 shares authorized, 562 shares issued and outstanding) | 453 | 453 | |||||||||
Series B Convertible Preferred Stock no par value, 5,000,000 authorized, 3,379,142 and 1,872,448 shares issued and outstanding, respectively; $84.48 million and $46.81 million aggregate liquidation preference, respectively) | 44,911 | 41,189 | |||||||||
Common Stock ($0.01 par value, 200,000,000 shares authorized, 9,793,957 and 9,720,532 shares issued and outstanding, respectively) | 98 | 97 | |||||||||
| Additional paid-in capital | 234,993 | 234,229 | |||||||||
| Accumulated deficit | (295,617) | (274,107) | |||||||||
| Total Stockholders’ (Deficit) Equity | (15,162) | 1,861 | |||||||||
| Noncontrolling interests | 66,196 | 1,941 | |||||||||
| Total Equity | 51,034 | 3,802 | |||||||||
| Total Liabilities and Equity | $ | 684,536 | $ | 465,281 | |||||||
WHLR | Financial & Operating Data | as of 12/31/2022 unless otherwise stated | 10 | ||||
| Three Months Ended December 31, | Years Ended December 31, | ||||||||||||||||||||||
| 2022 | 2021 | 2022 | 2021 | ||||||||||||||||||||
| REVENUE: | |||||||||||||||||||||||
| Rental revenues | $ | 26,053 | $ | 15,422 | $ | 75,195 | $ | 60,368 | |||||||||||||||
| Other revenues | 898 | 162 | 1,450 | 942 | |||||||||||||||||||
| Total Revenue | 26,951 | 15,584 | 76,645 | 61,310 | |||||||||||||||||||
| OPERATING EXPENSES: | |||||||||||||||||||||||
| Property operations | 9,094 | 5,045 | 25,731 | 19,618 | |||||||||||||||||||
| Depreciation and amortization | 7,318 | 3,764 | 19,540 | 14,797 | |||||||||||||||||||
| Impairment of assets held for sale | — | 100 | 760 | 2,300 | |||||||||||||||||||
| Corporate general & administrative | 3,186 | 2,195 | 8,620 | 7,140 | |||||||||||||||||||
| Total Operating Expenses | 19,598 | 11,104 | 54,651 | 43,855 | |||||||||||||||||||
| Gain (loss) on disposal of properties | 2,619 | (88) | 2,604 | 2,055 | |||||||||||||||||||
| Operating Income | 9,972 | 4,392 | 24,598 | 19,510 | |||||||||||||||||||
| Interest income | 23 | 25 | 65 | 34 | |||||||||||||||||||
| Interest expense | (11,028) | (13,215) | (30,107) | (33,028) | |||||||||||||||||||
| Net changes in fair value of derivative liabilities | 198 | 3,465 | (2,335) | 3,768 | |||||||||||||||||||
| Other income | — | — | — | 552 | |||||||||||||||||||
| Other expense | — | — | (691) | (185) | |||||||||||||||||||
| Net Loss Before Income Taxes | (835) | (5,333) | (8,470) | (9,349) | |||||||||||||||||||
| Income tax expense | — | — | — | (2) | |||||||||||||||||||
| Net Loss | (835) | (5,333) | (8,470) | (9,351) | |||||||||||||||||||
| Less: Net income attributable to noncontrolling interests | 2,747 | 20 | 3,984 | 92 | |||||||||||||||||||
| Net Loss Attributable to Wheeler REIT | (3,582) | (5,353) | (12,454) | (9,443) | |||||||||||||||||||
| Preferred Stock dividends - undeclared | (2,264) | (2,187) | (9,056) | (8,837) | |||||||||||||||||||
| Deemed contribution related to preferred stock redemption | — | — | — | 5,040 | |||||||||||||||||||
| Net Loss Attributable to Wheeler REIT Common Stockholders | $ | (5,846) | $ | (7,540) | $ | (21,510) | $ | (13,240) | |||||||||||||||
| Loss per share: | |||||||||||||||||||||||
| Basic and Diluted | $ | (0.60) | $ | (0.78) | $ | (2.20) | $ | (1.36) | |||||||||||||||
| Weighted-average number of shares: | |||||||||||||||||||||||
| Basic and Diluted | 9,793,504 | 9,719,239 | 9,760,704 | 9,711,944 | |||||||||||||||||||
WHLR | Financial & Operating Data | as of 12/31/2022 unless otherwise stated | 11 | ||||
Three Months Ended December 31, | Years Ended December 31, | |||||||||||||||||||||||||
| 2022 | 2021 | 2022 | 2021 | |||||||||||||||||||||||
| Net Loss | $ | (835) | $ | (5,333) | $ | (8,470) | $ | (9,351) | ||||||||||||||||||
| Depreciation and amortization of real estate assets | 7,318 | 3,764 | 19,540 | 14,797 | ||||||||||||||||||||||
| Impairment of assets held for sale | — | 100 | 760 | 2,300 | ||||||||||||||||||||||
| (Gain) loss on disposal of properties | (2,619) | 88 | (2,604) | (2,055) | ||||||||||||||||||||||
| FFO | 3,864 | (1,381) | 9,226 | 5,691 | ||||||||||||||||||||||
| Preferred stock dividends - undeclared | (2,264) | (2,187) | (9,056) | (8,837) | ||||||||||||||||||||||
| Dividends on noncontrolling interests preferred stock | (2,688) | — | (3,913) | — | ||||||||||||||||||||||
| Preferred stock redemption | — | — | — | 70 | ||||||||||||||||||||||
| Preferred stock accretion adjustments | 146 | 146 | 584 | 600 | ||||||||||||||||||||||
| FFO available to common stockholders and common unitholders | (942) | (3,422) | (3,159) | (2,476) | ||||||||||||||||||||||
| Capital related costs | 48 | 95 | 27 | 438 | ||||||||||||||||||||||
Other non-recurring and non-cash expenses (2) | (344) | (13) | 3,065 | 352 | ||||||||||||||||||||||
| Net changes in fair value of derivative liabilities | (198) | (3,465) | 2,335 | (3,768) | ||||||||||||||||||||||
| Share based compensation | — | 14 | — | 14 | ||||||||||||||||||||||
| Straight-line rental revenue, net straight-line expense | (323) | (155) | (768) | (1,026) | ||||||||||||||||||||||
| Loan cost amortization | 3,944 | 7,510 | 6,098 | 12,710 | ||||||||||||||||||||||
| Paid-in-kind interest | 1,640 | 1,610 | 3,739 | 1,610 | ||||||||||||||||||||||
| Above (below) market lease amortization | (1,601) | (15) | (2,079) | 13 | ||||||||||||||||||||||
| Recurring capital expenditures and tenant improvement reserves | (406) | (271) | (1,354) | (1,096) | ||||||||||||||||||||||
| AFFO | $ | 1,818 | $ | 1,888 | $ | 7,904 | $ | 6,771 | ||||||||||||||||||
| Weighted Average Common Shares | 9,793,504 | 9,719,239 | 9,760,704 | 9,711,944 | ||||||||||||||||||||||
| Weighted Average Common Units | 144,942 | 216,636 | 177,301 | 219,636 | ||||||||||||||||||||||
| Total Common Shares and Units | 9,938,446 | 9,935,875 | 9,938,005 | 9,931,580 | ||||||||||||||||||||||
| FFO per Common Share and Common Units | $ | (0.09) | $ | (0.34) | $ | (0.32) | $ | (0.25) | ||||||||||||||||||
| AFFO per Common Share and Common Units | $ | 0.18 | $ | 0.19 | $ | 0.80 | $ | 0.68 | ||||||||||||||||||
WHLR | Financial & Operating Data | as of 12/31/2022 unless otherwise stated | 12 | ||||
| Three Months Ended December 31, | |||||||||||||||||||||||||||||||||||
| Same Store | Non-same Store | Total | |||||||||||||||||||||||||||||||||
| 2022 | 2021 | 2022 | 2021 | 2022 | 2021 | ||||||||||||||||||||||||||||||
| Net (Loss) Income | $ | 351 | $ | (5,177) | $ | (1,186) | $ | (156) | $ | (835) | $ | (5,333) | |||||||||||||||||||||||
| Adjustments: | |||||||||||||||||||||||||||||||||||
| Net changes in fair value of derivative liabilities | (198) | (3,465) | — | — | (198) | (3,465) | |||||||||||||||||||||||||||||
| Interest expense | 5,276 | 13,111 | 5,752 | 104 | 11,028 | 13,215 | |||||||||||||||||||||||||||||
| Interest income | (23) | (25) | — | — | (23) | (25) | |||||||||||||||||||||||||||||
| (Gain) loss on disposal of properties | — | — | (2,619) | 88 | (2,619) | 88 | |||||||||||||||||||||||||||||
| Corporate general & administrative | 2,040 | 2,181 | 1,146 | 14 | 3,186 | 2,195 | |||||||||||||||||||||||||||||
| Impairment of assets held for sale | — | — | — | 100 | — | 100 | |||||||||||||||||||||||||||||
| Depreciation and amortization | 3,413 | 3,679 | 3,905 | 85 | 7,318 | 3,764 | |||||||||||||||||||||||||||||
| Other non-property revenue | (52) | (26) | (1,554) | 2 | (1,606) | (24) | |||||||||||||||||||||||||||||
| Property Net Operating Income | $ | 10,807 | $ | 10,278 | $ | 5,444 | $ | 237 | $ | 16,251 | $ | 10,515 | |||||||||||||||||||||||
| Property revenues | $ | 16,120 | $ | 15,183 | $ | 9,225 | $ | 377 | $ | 25,345 | $ | 15,560 | |||||||||||||||||||||||
| Property expenses | 5,313 | 4,905 | 3,781 | 140 | 9,094 | 5,045 | |||||||||||||||||||||||||||||
| Property Net Operating Income | $ | 10,807 | $ | 10,278 | $ | 5,444 | $ | 237 | $ | 16,251 | $ | 10,515 | |||||||||||||||||||||||
| Years Ended December 31, | |||||||||||||||||||||||||||||||||||
| Same Store | Non-same Store | Total | |||||||||||||||||||||||||||||||||
| 2022 | 2021 | 2022 | 2021 | 2022 | 2021 | ||||||||||||||||||||||||||||||
| Net Loss | $ | (5,926) | $ | (8,179) | $ | (2,544) | $ | (1,172) | $ | (8,470) | $ | (9,351) | |||||||||||||||||||||||
| Adjustments: | |||||||||||||||||||||||||||||||||||
| Income tax expense | — | 2 | — | — | — | 2 | |||||||||||||||||||||||||||||
| Other expense | 691 | 185 | — | — | 691 | 185 | |||||||||||||||||||||||||||||
| Net changes in fair value of derivative liabilities | 2,335 | (3,768) | — | — | 2,335 | (3,768) | |||||||||||||||||||||||||||||
| Interest expense | 23,067 | 31,551 | 7,040 | 1,477 | 30,107 | 33,028 | |||||||||||||||||||||||||||||
| Interest Income | (65) | (34) | — | — | (65) | (34) | |||||||||||||||||||||||||||||
| Gain on disposal of properties | — | — | (2,604) | (2,055) | (2,604) | (2,055) | |||||||||||||||||||||||||||||
| Corporate general & administrative | 6,850 | 7,063 | 1,770 | 77 | 8,620 | 7,140 | |||||||||||||||||||||||||||||
| Impairment of assets held for sale | 760 | — | — | 2,300 | 760 | 2,300 | |||||||||||||||||||||||||||||
| Depreciation and amortization | 14,193 | 14,404 | 5,347 | 393 | 19,540 | 14,797 | |||||||||||||||||||||||||||||
| Other non-property revenue | (33) | (585) | (2,069) | 10 | (2,102) | (575) | |||||||||||||||||||||||||||||
| Property Net Operating Income | $ | 41,872 | $ | 40,639 | $ | 6,940 | $ | 1,030 | $ | 48,812 | $ | 41,669 | |||||||||||||||||||||||
| Property revenues | $ | 62,150 | $ | 59,594 | $ | 12,393 | $ | 1,693 | $ | 74,543 | $ | 61,287 | |||||||||||||||||||||||
| Property expenses | 20,278 | 18,955 | 5,453 | 663 | 25,731 | 19,618 | |||||||||||||||||||||||||||||
| Property Net Operating Income | $ | 41,872 | $ | 40,639 | $ | 6,940 | $ | 1,030 | $ | 48,812 | $ | 41,669 | |||||||||||||||||||||||
WHLR | Financial & Operating Data | as of 12/31/2022 unless otherwise stated | 13 | ||||
| Three Months Ended December 31, | Years Ended December 31, | |||||||||||||||||||||||||
| 2022 | 2021 | 2022 | 2021 | |||||||||||||||||||||||
Net Loss | $ | (835) | $ | (5,333) | $ | (8,470) | $ | (9,351) | ||||||||||||||||||
Add back: | Depreciation and amortization (1) | 5,717 | 3,749 | 17,461 | 14,810 | |||||||||||||||||||||
Interest Expense (2) | 11,028 | 13,215 | 30,107 | 33,028 | ||||||||||||||||||||||
Income tax expense | — | — | — | 2 | ||||||||||||||||||||||
EBITDA | 15,910 | 11,631 | 39,098 | 38,489 | ||||||||||||||||||||||
| Adjustments for items affecting comparability: | ||||||||||||||||||||||||||
Capital related costs | 48 | 95 | 27 | 438 | ||||||||||||||||||||||
| Change in FMV of derivative liabilities | (198) | (3,465) | 2,335 | (3,768) | ||||||||||||||||||||||
Other non-recurring and non-cash expenses (3) | (353) | (8) | 413 | (361) | ||||||||||||||||||||||
Impairment of assets held for sale | — | 100 | 760 | 2,300 | ||||||||||||||||||||||
(Gain) loss on disposal of properties | (2,619) | 88 | (2,604) | (2,055) | ||||||||||||||||||||||
Adjusted EBITDA | $ | 12,788 | $ | 8,441 | $ | 40,029 | $ | 35,043 | ||||||||||||||||||
WHLR | Financial & Operating Data | as of 12/31/2022 unless otherwise stated | 14 | ||||
| Property/Description | Monthly Payment | Interest Rate | Maturity | December 31, 2022 | December 31, 2021 | |||||||||||||||||||||||||||
| Cypress Shopping Center | $ | 34,360 | 4.70 | % | July 2024 | $ | 5,903 | $ | 6,031 | |||||||||||||||||||||||
| Port Crossing | $ | 34,788 | 4.84 | % | August 2024 | 5,641 | 5,778 | |||||||||||||||||||||||||
| Freeway Junction | $ | 41,798 | 4.60 | % | September 2024 | 7,273 | 7,431 | |||||||||||||||||||||||||
| Harrodsburg Marketplace | $ | 19,112 | 4.55 | % | September 2024 | 3,186 | 3,267 | |||||||||||||||||||||||||
| Bryan Station | $ | 23,489 | 4.52 | % | November 2024 | 4,136 | 4,226 | |||||||||||||||||||||||||
| Crockett Square | Interest only | 4.47 | % | December 2024 | 6,338 | 6,338 | ||||||||||||||||||||||||||
| Pierpont Centre | $ | 39,435 | 4.15 | % | February 2025 | 7,716 | 7,861 | |||||||||||||||||||||||||
| Shoppes at Myrtle Park | $ | 33,180 | 4.45 | % | February 2025 | 5,615 | 5,757 | |||||||||||||||||||||||||
| Alex City Marketplace | Interest only | 3.95 | % | April 2025 | 5,750 | 5,750 | ||||||||||||||||||||||||||
| Brook Run Shopping Center | Interest only | 4.08 | % | June 2025 | 10,950 | 10,950 | ||||||||||||||||||||||||||
| Beaver Ruin Village I and II | Interest only | 4.73 | % | July 2025 | 9,400 | 9,400 | ||||||||||||||||||||||||||
| Sunshine Shopping Plaza | Interest only | 4.57 | % | August 2025 | 5,900 | 5,900 | ||||||||||||||||||||||||||
| Barnett Portfolio (2) | Interest only | 4.30 | % | September 2025 | 8,770 | 8,770 | ||||||||||||||||||||||||||
| Fort Howard Shopping Center | Interest only | 4.57 | % | October 2025 | 7,100 | 7,100 | ||||||||||||||||||||||||||
| Conyers Crossing | Interest only | 4.67 | % | October 2025 | 5,960 | 5,960 | ||||||||||||||||||||||||||
| Grove Park Shopping Center | Interest only | 4.52 | % | October 2025 | 3,800 | 3,800 | ||||||||||||||||||||||||||
| Parkway Plaza | Interest only | 4.57 | % | October 2025 | 3,500 | 3,500 | ||||||||||||||||||||||||||
| Winslow Plaza | $ | 24,295 | 4.82 | % | December 2025 | 4,409 | 4,483 | |||||||||||||||||||||||||
| Tuckernuck | $ | 32,202 | 5.00 | % | March 2026 | 4,915 | 5,052 | |||||||||||||||||||||||||
| Chesapeake Square | $ | 23,857 | 4.70 | % | August 2026 | 4,106 | 4,192 | |||||||||||||||||||||||||
| Sangaree/Tri-County | $ | 32,329 | 4.78 | % | December 2026 | 6,086 | 6,176 | |||||||||||||||||||||||||
| Riverbridge | Interest only | 4.48 | % | December 2026 | 4,000 | 4,000 | ||||||||||||||||||||||||||
| Franklin Village | $ | 45,336 | 4.93 | % | January 2027 | 8,144 | 8,277 | |||||||||||||||||||||||||
| Village of Martinsville | $ | 89,664 | 4.28 | % | July 2029 | 15,181 | 15,589 | |||||||||||||||||||||||||
| Laburnum Square | Interest only | 4.28 | % | September 2029 | 7,665 | 7,665 | ||||||||||||||||||||||||||
| Rivergate (3) | $ | 100,222 | 4.25 | % | September 2031 | 18,003 | 18,430 | |||||||||||||||||||||||||
| Convertible Notes | Interest only | 7.00 | % | December 2031 | 33,000 | 33,000 | ||||||||||||||||||||||||||
| Guggenheim Loan Agreement (4) | Interest only | 4.25 | % | July 2032 | 75,000 | — | ||||||||||||||||||||||||||
| JANAF Loan Agreement (5) | Interest only | 5.31 | % | July 2032 | 60,000 | — | ||||||||||||||||||||||||||
| Guggenheim-Cedar Loan Agreement (6) | Interest only | 5.25 | % | November 2032 | 110,000 | — | ||||||||||||||||||||||||||
| Patuxent Crossing/Coliseum Marketplace Loan Agreement | Interest only | 6.35 | % | January 2033 | 25,000 | — | ||||||||||||||||||||||||||
| Walnut Hill Plaza | $ | 26,850 | 5.50 | % | March 2023 | — | 3,145 | |||||||||||||||||||||||||
| Litchfield Market Village | $ | 46,057 | 5.50 | % | November 2022 | — | 7,312 | |||||||||||||||||||||||||
| Twin City Commons | $ | 17,827 | 4.86 | % | January 2023 | — | 2,843 | |||||||||||||||||||||||||
| New Market | $ | 48,747 | 5.65 | % | June 2023 | — | 6,291 | |||||||||||||||||||||||||
| Benefit Street Note | $ | 53,185 | 5.71 | % | June 2023 | — | 6,914 | |||||||||||||||||||||||||
| Deutsche Bank Note | $ | 33,340 | 5.71 | % | July 2023 | — | 5,488 | |||||||||||||||||||||||||
| First National Bank | $ | 24,656 | LIBOR + 350 basis points | August 2023 | — | 789 | ||||||||||||||||||||||||||
| Lumber River | $ | 10,723 | LIBOR + 350 basis points | September 2023 | — | 1,296 | ||||||||||||||||||||||||||
| Tampa Festival | $ | 50,797 | 5.56 | % | September 2023 | — | 7,753 | |||||||||||||||||||||||||
| Forrest Gallery | $ | 50,973 | 5.40 | % | September 2023 | — | 8,060 | |||||||||||||||||||||||||
| South Carolina Food Lions Note | $ | 68,320 | 5.25 | % | January 2024 | — | 11,259 | |||||||||||||||||||||||||
| Folly Road | $ | 41,482 | 4.65 | % | March 2025 | — | 7,063 | |||||||||||||||||||||||||
| JANAF | $ | 333,159 | 4.49 | % | July 2023 | — | 47,065 | |||||||||||||||||||||||||
| JANAF Bravo | $ | 35,076 | 5.00 | % | May 2024 | — | 5,936 | |||||||||||||||||||||||||
| JANAF BJ's | $ | 29,964 | 4.95 | % | January 2026 | — | 4,725 | |||||||||||||||||||||||||
| Butler Square | Interest only | 3.90 | % | May 2025 | — | 5,640 | ||||||||||||||||||||||||||
Total Principal Balance (1) | 482,447 | 346,262 | ||||||||||||||||||||||||||||||
Unamortized debt issuance cost (1) | (16,418) | (9,834) | ||||||||||||||||||||||||||||||
| Total Loans Payable, including assets held for sale | 466,029 | 336,428 | ||||||||||||||||||||||||||||||
| Less loans payable on assets held for sale, net loan amortization costs | — | 3,145 | ||||||||||||||||||||||||||||||
| Total Loans Payable, net | $ | 466,029 | $ | 333,283 | ||||||||||||||||||||||||||||
WHLR | Financial & Operating Data | as of 12/31/2022 unless otherwise stated | 15 | ||||
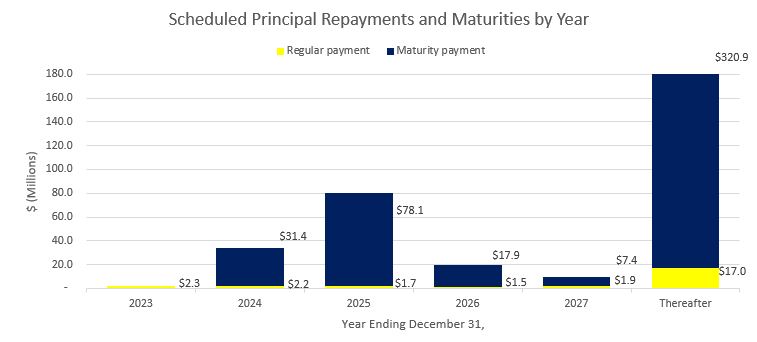
| Scheduled principal repayments and maturities by year | Amount | % Total Principal Payments and Maturities | ||||||||||||
| December 31, 2023 | $ | 2,343 | 0.49 | % | ||||||||||
| December 31, 2024 | 33,690 | 6.98 | % | |||||||||||
| December 31, 2025 | 79,697 | 16.52 | % | |||||||||||
| December 31, 2026 | 19,347 | 4.01 | % | |||||||||||
| December 31, 2027 | 9,440 | 1.96 | % | |||||||||||
| Thereafter | 337,930 | 70.04 | % | |||||||||||
| Total principal repayments and debt maturities | $ | 482,447 | 100.00 | % | ||||||||||
| Three Months Ended December 31, | Twelve Months Ended December 31, | Three Months Ended Changes | Twelve Months Ended Changes | ||||||||||||||||||||||||||||||||||||||||||||
| 2022 | 2021 | 2022 | 2021 | Change | % Change | Change | % Change | ||||||||||||||||||||||||||||||||||||||||
| Property debt interest - excluding Cedar debt | $ | 3,777 | $ | 2,738 | $ | 14,717 | $ | 14,611 | $ | 1,039 | 37.95 | % | $ | 106 | 0.73 | % | |||||||||||||||||||||||||||||||
Convertible Notes interest (1) | 1,062 | 1,784 | 3,739 | 1,610 | (722) | (40.47) | % | 2,129 | 132.24 | % | |||||||||||||||||||||||||||||||||||||
| Defeasance paid | — | — | 2,614 | 687 | — | — | % | 1,927 | 280.49 | % | |||||||||||||||||||||||||||||||||||||
| Amortization of deferred financing costs | 3,944 | 7,510 | 6,098 | 12,710 | (3,566) | (47.48) | % | (6,612) | (52.02) | % | |||||||||||||||||||||||||||||||||||||
| Interest on corporate debt | — | 1,183 | — | 3,410 | (1,183) | (100.00) | % | (3,410) | (100.00) | % | |||||||||||||||||||||||||||||||||||||
| Property debt interest - Cedar | 2,245 | — | 2,939 | — | 2,245 | 100.00 | % | 2,939 | 100.00 | % | |||||||||||||||||||||||||||||||||||||
| Total Interest Expense | $ | 11,028 | $ | 13,215 | $ | 30,107 | $ | 33,028 | $ | (2,187) | (16.55) | % | $ | (2,921) | (8.84) | % | |||||||||||||||||||||||||||||||
WHLR | Financial & Operating Data | as of 12/31/2022 unless otherwise stated | 16 | ||||
Property | Location | Number of Tenants | Total Leasable Square Feet | Percentage Leased (1) | Percentage Occupied | Total SF Occupied | Annualized Base Rent (in 000's) (2) | Annualized Base Rent per Occupied Sq. Foot | ||||||||||||||||||||||||
| WHLR | ||||||||||||||||||||||||||||||||
| Alex City Marketplace | Alexander City, AL | 19 | 151,843 | 100.0 | % | 100.0 | % | 151,843 | $ | 1,215 | $ | 8.00 | ||||||||||||||||||||
| Amscot Building | Tampa, FL | 1 | 2,500 | 100.0 | % | 100.0 | % | 2,500 | 83 | 33.00 | ||||||||||||||||||||||
| Beaver Ruin Village | Lilburn, GA | 29 | 74,038 | 96.8 | % | 94.1 | % | 69,648 | 1,254 | 18.01 | ||||||||||||||||||||||
| Beaver Ruin Village II | Lilburn, GA | 4 | 34,925 | 100.0 | % | 100.0 | % | 34,925 | 464 | 13.29 | ||||||||||||||||||||||
| Brook Run Shopping Center | Richmond, VA | 20 | 147,738 | 87.0 | % | 87.0 | % | 128,495 | 1,167 | 9.08 | ||||||||||||||||||||||
| Brook Run Properties (3) | Richmond, VA | — | — | — | % | — | % | — | — | — | ||||||||||||||||||||||
| Bryan Station | Lexington, KY | 10 | 54,277 | 100.0 | % | 100.0 | % | 54,277 | 637 | 11.73 | ||||||||||||||||||||||
| Cardinal Plaza | Henderson, NC | 9 | 50,000 | 100.0 | % | 100.0 | % | 50,000 | 504 | 10.07 | ||||||||||||||||||||||
| Chesapeake Square | Onley, VA | 14 | 108,982 | 99.1 | % | 99.1 | % | 108,016 | 838 | 7.76 | ||||||||||||||||||||||
| Clover Plaza | Clover, SC | 9 | 45,575 | 100.0 | % | 97.1 | % | 44,275 | 360 | 8.12 | ||||||||||||||||||||||
| Courtland Commons (3) | Courtland, VA | — | — | — | % | — | % | — | — | — | ||||||||||||||||||||||
| Conyers Crossing | Conyers, GA | 14 | 170,475 | 100.0 | % | 100.0 | % | 170,475 | 986 | 5.78 | ||||||||||||||||||||||
| Crockett Square | Morristown, TN | 4 | 107,122 | 100.0 | % | 100.0 | % | 107,122 | 970 | 9.06 | ||||||||||||||||||||||
| Cypress Shopping Center | Boiling Springs, SC | 16 | 80,435 | 59.9 | % | 39.5 | % | 31,775 | 447 | 14.06 | ||||||||||||||||||||||
| Darien Shopping Center | Darien, GA | 1 | 26,001 | 100.0 | % | 100.0 | % | 26,001 | 140 | 5.38 | ||||||||||||||||||||||
| Devine Street | Columbia, SC | 1 | 38,464 | 89.1 | % | 89.1 | % | 34,264 | 180 | 5.25 | ||||||||||||||||||||||
| Edenton Commons (3) | Edenton, NC | — | — | — | % | — | % | — | — | — | ||||||||||||||||||||||
| Folly Road | Charleston, SC | 5 | 47,794 | 100.0 | % | 100.0 | % | 47,794 | 733 | 15.35 | ||||||||||||||||||||||
| Forrest Gallery | Tullahoma, TN | 28 | 214,451 | 90.0 | % | 90.0 | % | 193,024 | 1,425 | 7.38 | ||||||||||||||||||||||
| Fort Howard Shopping Center | Rincon, GA | 20 | 113,652 | 100.0 | % | 100.0 | % | 113,652 | 1,250 | 11.00 | ||||||||||||||||||||||
| Freeway Junction | Stockbridge, GA | 17 | 156,834 | 97.5 | % | 97.5 | % | 152,984 | 1,323 | 8.65 | ||||||||||||||||||||||
| Franklin Village | Kittanning, PA | 25 | 151,821 | 99.9 | % | 99.9 | % | 151,673 | 1,297 | 8.55 | ||||||||||||||||||||||
| Franklinton Square | Franklinton, NC | 15 | 65,366 | 100.0 | % | 100.0 | % | 65,366 | 596 | 9.11 | ||||||||||||||||||||||
| Georgetown | Georgetown, SC | 2 | 29,572 | 100.0 | % | 100.0 | % | 29,572 | 267 | 9.04 | ||||||||||||||||||||||
| Grove Park Shopping Center | Orangeburg, SC | 14 | 93,265 | 100.0 | % | 100.0 | % | 93,265 | 761 | 8.16 | ||||||||||||||||||||||
| Harbor Point (3) | Grove, OK | — | — | — | % | — | % | — | — | — | ||||||||||||||||||||||
| Harrodsburg Marketplace | Harrodsburg, KY | 8 | 60,048 | 91.0 | % | 91.0 | % | 54,648 | 451 | 8.26 | ||||||||||||||||||||||
| JANAF (4) | Norfolk, VA | 118 | 798,086 | 96.7 | % | 95.0 | % | 758,320 | 8,993 | 11.86 | ||||||||||||||||||||||
| Laburnum Square | Richmond, VA | 19 | 109,405 | 99.1 | % | 96.9 | % | 106,045 | 970 | 9.14 | ||||||||||||||||||||||
| Ladson Crossing | Ladson, SC | 16 | 52,607 | 100.0 | % | 100.0 | % | 52,607 | 548 | 10.42 | ||||||||||||||||||||||
| LaGrange Marketplace | LaGrange, GA | 14 | 76,594 | 93.7 | % | 93.7 | % | 71,800 | 443 | 6.17 | ||||||||||||||||||||||
| Lake Greenwood Crossing | Greenwood, SC | 8 | 43,618 | 100.0 | % | 100.0 | % | 43,618 | 363 | 8.33 | ||||||||||||||||||||||
| Lake Murray | Lexington, SC | 5 | 39,218 | 100.0 | % | 100.0 | % | 39,218 | 272 | 6.92 | ||||||||||||||||||||||
| Litchfield Market Village | Pawleys Island, SC | 24 | 86,740 | 94.8 | % | 94.8 | % | 82,202 | 1,028 | 12.51 | ||||||||||||||||||||||
| Lumber River Village | Lumberton, NC | 11 | 66,781 | 100.0 | % | 100.0 | % | 66,781 | 474 | 7.09 | ||||||||||||||||||||||
| Moncks Corner | Moncks Corner, SC | 1 | 26,800 | 100.0 | % | 100.0 | % | 26,800 | 330 | 12.31 | ||||||||||||||||||||||
| Nashville Commons | Nashville, NC | 12 | 56,100 | 100.0 | % | 100.0 | % | 56,100 | 646 | 11.51 | ||||||||||||||||||||||
| New Market Crossing | Mt. Airy, NC | 12 | 117,076 | 100.0 | % | 100.0 | % | 117,076 | 1,035 | 8.84 | ||||||||||||||||||||||
| Parkway Plaza | Brunswick, GA | 4 | 52,365 | 81.7 | % | 81.7 | % | 42,785 | 452 | 10.57 | ||||||||||||||||||||||
| Pierpont Centre | Morgantown, WV | 15 | 111,162 | 98.4 | % | 98.4 | % | 109,437 | 1,055 | 9.64 | ||||||||||||||||||||||
| Port Crossing | Harrisonburg, VA | 7 | 65,365 | 95.9 | % | 95.9 | % | 62,715 | 813 | 12.97 | ||||||||||||||||||||||
| Ridgeland | Ridgeland, SC | 1 | 20,029 | 100.0 | % | 100.0 | % | 20,029 | 140 | 7.00 | ||||||||||||||||||||||
| Riverbridge Shopping Center | Carrollton, GA | 11 | 91,188 | 100.0 | % | 100.0 | % | 91,188 | 769 | 8.43 | ||||||||||||||||||||||
| Rivergate Shopping Center | Macon, GA | 24 | 193,960 | 87.0 | % | 87.0 | % | 168,816 | 2,509 | 14.86 | ||||||||||||||||||||||
| Sangaree Plaza | Summerville, SC | 10 | 66,948 | 100.0 | % | 100.0 | % | 66,948 | 714 | 10.67 | ||||||||||||||||||||||
| Shoppes at Myrtle Park | Bluffton, SC | 13 | 56,601 | 97.3 | % | 97.3 | % | 55,084 | 657 | 11.92 | ||||||||||||||||||||||
| South Lake | Lexington, SC | 10 | 44,318 | 97.3 | % | 97.3 | % | 43,118 | 242 | 5.61 | ||||||||||||||||||||||
| South Park | Mullins, SC | 4 | 60,734 | 96.9 | % | 96.9 | % | 58,834 | 379 | 6.43 | ||||||||||||||||||||||
| South Square | Lancaster, SC | 6 | 44,350 | 80.9 | % | 80.9 | % | 35,900 | 303 | 8.44 | ||||||||||||||||||||||
| St. George Plaza | St. George, SC | 8 | 59,174 | 100.0 | % | 100.0 | % | 59,174 | 401 | 6.78 | ||||||||||||||||||||||
| Sunshine Plaza | Lehigh Acres, FL | 23 | 111,189 | 100.0 | % | 100.0 | % | 111,189 | 1,111 | 9.99 | ||||||||||||||||||||||
| Surrey Plaza | Hawkinsville, GA | 4 | 42,680 | 100.0 | % | 100.0 | % | 42,680 | 258 | 6.05 | ||||||||||||||||||||||
WHLR | Financial & Operating Data | as of 12/31/2022 unless otherwise stated | 17 | ||||
Property | Location | Number of Tenants | Total Leasable Square Feet | Percentage Leased (1) | Percentage Occupied | Total SF Occupied | Annualized Base Rent (in 000's) (2) | Annualized Base Rent per Occupied Sq. Foot | ||||||||||||||||||||||||
| Tampa Festival | Tampa, FL | 19 | 141,580 | 98.9 | % | 66.7 | % | 94,380 | $ | 932 | $ | 9.88 | ||||||||||||||||||||
| Tri-County Plaza | Royston, GA | 7 | 67,577 | 90.2 | % | 90.2 | % | 60,977 | 432 | 7.08 | ||||||||||||||||||||||
| Tuckernuck | Richmond, VA | 17 | 93,440 | 98.6 | % | 98.6 | % | 92,173 | 999 | 10.84 | ||||||||||||||||||||||
| Twin City Commons | Batesburg-Leesville, SC | 5 | 47,680 | 100.0 | % | 100.0 | % | 47,680 | 488 | 10.23 | ||||||||||||||||||||||
| Village of Martinsville | Martinsville, VA | 21 | 288,254 | 100.0 | % | 96.4 | % | 277,742 | 2,199 | 7.92 | ||||||||||||||||||||||
| Waterway Plaza | Little River, SC | 10 | 49,750 | 100.0 | % | 100.0 | % | 49,750 | 503 | 10.11 | ||||||||||||||||||||||
| Westland Square | West Columbia, SC | 11 | 62,735 | 100.0 | % | 100.0 | % | 62,735 | 537 | 8.57 | ||||||||||||||||||||||
| Winslow Plaza | Sicklerville, NJ | 18 | 40,695 | 100.0 | % | 100.0 | % | 40,695 | 653 | 16.04 | ||||||||||||||||||||||
| WHLR TOTAL | 773 | 5,309,977 | 96.5 | % | 94.7 | % | 5,030,190 | $ | 48,996 | $ | 9.74 | |||||||||||||||||||||
| CDR | ||||||||||||||||||||||||||||||||
| Brickyard Plaza | Berlin, CT | 10 | 227,598 | 100.0 | % | 99.2 | % | 225,821 | $ | 2,027 | $ | 8.98 | ||||||||||||||||||||
| Carll's Corner | Bridgeton, NJ | 5 | 129,582 | 27.5 | % | 21.1 | % | 27,324 | 400 | 14.63 | ||||||||||||||||||||||
| Coliseum Marketplace | Hampton, VA | 9 | 106,648 | 100.0 | % | 45.9 | % | 48,986 | 610 | 12.46 | ||||||||||||||||||||||
| Fairview Commons | New Cumberland, PA | 10 | 52,964 | 77.5 | % | 77.5 | % | 41,064 | 448 | 10.91 | ||||||||||||||||||||||
| Fieldstone Marketplace | New Bedford, MA | 10 | 193,970 | 71.7 | % | 71.7 | % | 139,139 | 1,652 | 11.87 | ||||||||||||||||||||||
| Gold Star Plaza | Shenandoah, PA | 6 | 71,720 | 97.8 | % | 97.8 | % | 70,120 | 641 | 9.14 | ||||||||||||||||||||||
| Golden Triangle | Lancaster, PA | 19 | 202,790 | 98.4 | % | 98.4 | % | 199,605 | 2,609 | 13.07 | ||||||||||||||||||||||
| Hamburg Square | Hamburg, PA | 7 | 102,058 | 100.0 | % | 100.0 | % | 102,058 | 684 | 6.70 | ||||||||||||||||||||||
| Kings Plaza | New Bedford, MA | 16 | 168,243 | 82.2 | % | 82.2 | % | 138,239 | 1,227 | 8.87 | ||||||||||||||||||||||
| Oakland Commons | Bristol, CT | 2 | 90,100 | 100.0 | % | 100.0 | % | 90,100 | 574 | 6.37 | ||||||||||||||||||||||
| Oregon Avenue | Philadelphia, PA | 1 | 20,380 | 100.0 | % | 5.8 | % | 1,180 | 40 | 34.21 | ||||||||||||||||||||||
| Patuxent Crossing | California, MD | 30 | 264,068 | 84.3 | % | 84.3 | % | 222,715 | 2,254 | 10.12 | ||||||||||||||||||||||
| Pine Grove Plaza | Brown Mills, NJ | 14 | 79,306 | 81.1 | % | 49.6 | % | 39,343 | 573 | 14.56 | ||||||||||||||||||||||
| South Philadelphia | Philadelphia, PA | 10 | 221,511 | 71.8 | % | 71.8 | % | 159,131 | 1,445 | 9.08 | ||||||||||||||||||||||
| Southington Center | Southington, CT | 10 | 155,842 | 100.0 | % | 98.5 | % | 153,507 | 1,172 | 7.64 | ||||||||||||||||||||||
| Timpany Plaza | Gardner, MA | 14 | 182,799 | 65.0 | % | 65.0 | % | 118,875 | 1,167 | 9.81 | ||||||||||||||||||||||
| Trexler Mall | Trexlertown, PA | 23 | 336,687 | 98.2 | % | 98.2 | % | 330,634 | 3,670 | 11.10 | ||||||||||||||||||||||
| Washington Center Shoppes | Sewell, NJ | 28 | 157,300 | 94.0 | % | 94.0 | % | 147,856 | 1,810 | 12.24 | ||||||||||||||||||||||
| Webster Commons | Webster, MA | 9 | 98,984 | 100.0 | % | 100.0 | % | 98,984 | 1,241 | 12.54 | ||||||||||||||||||||||
| CDR TOTAL | 233 | 2,862,550 | 86.2 | % | 82.3 | % | 2,354,681 | $ | 24,244 | $ | 10.30 | |||||||||||||||||||||
| COMBINED TOTAL | 1,006 | 8,172,527 | 92.9 | % | 90.4 | % | 7,384,871 | $ | 73,240 | $ | 9.92 | |||||||||||||||||||||
WHLR | Financial & Operating Data | as of 12/31/2022 unless otherwise stated | 18 | ||||

WHLR | Financial & Operating Data | as of 12/31/2022 unless otherwise stated | 19 | ||||
| Tenants | Category | Annualized Base Rent ($ in 000s) | % of Total Annualized Base Rent | Total Occupied Square Feet | Percent Total Leasable Square Foot | Annualized Base Rent Per Occupied Square Foot | |||||||||||||||||||||||||||||||||||
| Food Lion | Grocery | $ | 4,435 | 6.06 | % | 549,000 | 6.72 | % | $ | 8.08 | |||||||||||||||||||||||||||||||
Kroger Co (1) | Grocery | 2,097 | 2.86 | % | 311,000 | 3.81 | % | 6.74 | |||||||||||||||||||||||||||||||||
Dollar Tree (2) | Discount Retailer | 2,046 | 2.79 | % | 244,000 | 2.99 | % | 8.39 | |||||||||||||||||||||||||||||||||
| Piggly Wiggly | Grocery | 1,509 | 2.06 | % | 203,000 | 2.48 | % | 7.43 | |||||||||||||||||||||||||||||||||
| Planet Fitness | Gym | 1,443 | 1.97 | % | 140,000 | 1.71 | % | 10.31 | |||||||||||||||||||||||||||||||||
TJX Companies (4) | Discount Retailer | 1,186 | 1.62 | % | 195,000 | 2.39 | % | 6.08 | |||||||||||||||||||||||||||||||||
Lowes Foods (3) | Grocery | 1,181 | 1.61 | % | 130,000 | 1.59 | % | 9.08 | |||||||||||||||||||||||||||||||||
| Big Lots | Discount Retailer | 1,079 | 1.47 | % | 171,000 | 2.09 | % | 6.31 | |||||||||||||||||||||||||||||||||
| Kohl's | Discount Retailer | 1,031 | 1.41 | % | 147,000 | 1.80 | % | 7.01 | |||||||||||||||||||||||||||||||||
| Winn Dixie | Grocery | 984 | 1.34 | % | 134,000 | 1.64 | % | 7.34 | |||||||||||||||||||||||||||||||||
| $ | 16,991 | 23.19 | % | 2,224,000 | 27.22 | % | $ | 7.64 | |||||||||||||||||||||||||||||||||
| Lease Expiration Period | Number of Expiring Leases | Total Expiring Square Footage | % of Total Expiring Square Footage | % of Total Occupied Square Footage Expiring | Expiring Annualized Base Rent (in 000s) | % of Total Annualized Base Rent | Expiring Base Rent Per Occupied Square Foot | |||||||||||||||||||||||||||||||||||||
| Available | — | 787,656 | 9.64 | % | — | % | $ | — | — | % | $ | — | ||||||||||||||||||||||||||||||||
| MTM | 14 | 57,298 | 0.70 | % | 0.78 | % | 843 | 1.15 | % | 14.71 | ||||||||||||||||||||||||||||||||||
| 2023 | 123 | 495,810 | 6.07 | % | 6.71 | % | 5,635 | 7.69 | % | 11.37 | ||||||||||||||||||||||||||||||||||
| 2024 | 164 | 908,659 | 11.12 | % | 12.30 | % | 9,712 | 13.26 | % | 10.69 | ||||||||||||||||||||||||||||||||||
| 2025 | 171 | 1,202,547 | 14.71 | % | 16.28 | % | 11,811 | 16.13 | % | 9.82 | ||||||||||||||||||||||||||||||||||
| 2026 | 146 | 898,230 | 10.99 | % | 12.16 | % | 9,737 | 13.29 | % | 10.84 | ||||||||||||||||||||||||||||||||||
| 2027 | 142 | 720,776 | 8.82 | % | 9.76 | % | 8,615 | 11.76 | % | 11.95 | ||||||||||||||||||||||||||||||||||
| 2028 | 70 | 1,049,374 | 12.84 | % | 14.21 | % | 8,270 | 11.29 | % | 7.88 | ||||||||||||||||||||||||||||||||||
| 2029 | 49 | 470,930 | 5.76 | % | 6.38 | % | 4,425 | 6.04 | % | 9.40 | ||||||||||||||||||||||||||||||||||
| 2030 | 30 | 445,826 | 5.46 | % | 6.04 | % | 3,267 | 4.46 | % | 7.33 | ||||||||||||||||||||||||||||||||||
| 2031 | 28 | 340,279 | 4.16 | % | 4.61 | % | 3,254 | 4.44 | % | 9.56 | ||||||||||||||||||||||||||||||||||
| 2032 & thereafter | 69 | 795,142 | 9.73 | % | 10.77 | % | 7,671 | 10.49 | % | 9.65 | ||||||||||||||||||||||||||||||||||
| Total | 1,006 | 8,172,527 | 100.00 | % | 100.00 | % | $ | 73,240 | 100.00 | % | $ | 9.92 | ||||||||||||||||||||||||||||||||
WHLR | Financial & Operating Data | as of 12/31/2022 unless otherwise stated | 20 | ||||
| No Option | Option | ||||||||||||||||||||||||||||||||||
| Lease Expiration Period | Number of Expiring Leases | Expiring Occupied Square Footage | Expiring Annualized Based Rent (in 000s) | % of Total Annualized Base Rent | Expiring Base Rent per Square Foot | Number of Expiring Leases | Expiring Occupied Square Footage | Expiring Annualized Based Rent (in 000s) | % of Total Annualized Base Rent | Expiring Base Rent per Square Foot | |||||||||||||||||||||||||
| Available | — | 311,069 | $ | — | — | % | $ | — | — | — | $ | — | — | % | $ | — | |||||||||||||||||||
| Month-to-Month | 1 | 20,300 | 117 | 3.24 | % | 5.76 | — | — | — | — | % | — | |||||||||||||||||||||||
| 2023 | 2 | 55,259 | 888 | 24.61 | % | 16.07 | 5 | 151,616 | 953 | 3.41 | % | 6.29 | |||||||||||||||||||||||
| 2024 | 1 | 32,000 | 125 | 3.46 | % | 3.91 | 11 | 466,489 | 3,700 | 13.24 | % | 7.93 | |||||||||||||||||||||||
| 2025 | 3 | 112,660 | 759 | 21.04 | % | 6.74 | 15 | 608,431 | 4,502 | 16.11 | % | 7.40 | |||||||||||||||||||||||
| 2026 | 1 | 20,152 | 97 | 2.69 | % | 4.81 | 14 | 456,864 | 3,817 | 13.66 | % | 8.35 | |||||||||||||||||||||||
| 2027 | 3 | 69,819 | 629 | 17.43 | % | 9.01 | 5 | 149,546 | 1,221 | 4.37 | % | 8.16 | |||||||||||||||||||||||
| 2028 | — | — | — | — | % | — | 19 | 822,851 | 5,430 | 19.44 | % | 6.60 | |||||||||||||||||||||||
| 2029 | 3 | 71,939 | 772 | 21.40 | % | 10.73 | 6 | 174,928 | 1,014 | 3.63 | % | 5.80 | |||||||||||||||||||||||
| 2030 | — | — | — | — | % | — | 6 | 372,398 | 1,994 | 7.14 | % | 5.35 | |||||||||||||||||||||||
| 2031 | 1 | 20,858 | 60 | 1.67 | % | 2.88 | 4 | 195,516 | 1,733 | 6.20 | % | 8.86 | |||||||||||||||||||||||
| 2032+ | 2 | 66,189 | 161 | 4.46 | % | 2.43 | 14 | 531,652 | 3,574 | 12.80 | % | 6.72 | |||||||||||||||||||||||
| Total | 17 | 780,245 | $ | 3,608 | 100.00 | % | $ | 7.69 | 99 | 3,930,291 | $ | 27,938 | 100.00 | % | $ | 7.11 | |||||||||||||||||||
| No Option | Option | ||||||||||||||||||||||||||||||||||
| Lease Expiration Period | Number of Expiring Leases | Expiring Occupied Square Footage | Expiring Annualized Based Rent (in 000s) | % of Total Annualized Base Rent | Expiring Base Rent per Square Foot | Number of Expiring Leases | Expiring Occupied Square Footage | Expiring Annualized Based Rent (in 000s) | % of Total Annualized Base Rent | Expiring Base Rent per Square Foot | |||||||||||||||||||||||||
| Available | — | 476,587 | $ | — | — | % | $ | — | — | — | $ | — | — | % | $ | — | |||||||||||||||||||
| Month-to-Month | 13 | 36,998 | 726 | 3.87 | % | 19.62 | — | — | — | — | % | — | |||||||||||||||||||||||
| 2023 | 81 | 206,818 | 2,527 | 13.48 | % | 12.22 | 35 | 82,117 | 1,267 | 5.52 | % | 15.43 | |||||||||||||||||||||||
| 2024 | 95 | 206,853 | 2,878 | 15.35 | % | 13.91 | 57 | 203,317 | 3,009 | 13.12 | % | 14.80 | |||||||||||||||||||||||
| 2025 | 97 | 238,782 | 3,164 | 16.87 | % | 13.25 | 56 | 242,674 | 3,386 | 14.76 | % | 13.95 | |||||||||||||||||||||||
| 2026 | 76 | 192,982 | 2,677 | 14.28 | % | 13.87 | 55 | 228,232 | 3,146 | 13.71 | % | 13.78 | |||||||||||||||||||||||
| 2027 | 78 | 216,949 | 3,241 | 17.28 | % | 14.94 | 56 | 284,462 | 3,524 | 15.36 | % | 12.39 | |||||||||||||||||||||||
| 2028 | 21 | 66,064 | 993 | 5.30 | % | 15.03 | 30 | 160,459 | 1,847 | 8.05 | % | 11.51 | |||||||||||||||||||||||
| 2029 | 14 | 47,450 | 598 | 3.19 | % | 12.60 | 26 | 176,613 | 2,041 | 8.90 | % | 11.56 | |||||||||||||||||||||||
| 2030 | 11 | 23,138 | 373 | 1.99 | % | 16.12 | 13 | 50,290 | 900 | 3.92 | % | 17.90 | |||||||||||||||||||||||
| 2031 | 5 | 26,468 | 274 | 1.46 | % | 10.35 | 18 | 97,437 | 1,187 | 5.17 | % | 12.18 | |||||||||||||||||||||||
| 2032+ | 26 | 79,047 | 1,301 | 6.93 | % | 16.46 | 27 | 118,254 | 2,635 | 11.49 | % | 22.28 | |||||||||||||||||||||||
| Total | 517 | 1,818,136 | $ | 18,752 | 100.00 | % | $ | 13.98 | 373 | 1,643,855 | $ | 22,942 | 100.00 | % | $ | 13.96 | |||||||||||||||||||
WHLR | Financial & Operating Data | as of 12/31/2022 unless otherwise stated | 21 | ||||
| Three Months Ended December 31, | Twelve Months Ended December 31, | ||||||||||||||||||||||
| 2022 | 2021 | 2022 | 2021 | ||||||||||||||||||||
Renewals(1): | |||||||||||||||||||||||
| Leases renewed with rate increase (sq feet) | 212,108 | 137,644 | 551,939 | 402,875 | |||||||||||||||||||
| Leases renewed with rate decrease (sq feet) | 3,744 | 1,400 | 33,548 | 67,743 | |||||||||||||||||||
| Leases renewed with no rate change (sq feet) | 1,800 | 60,049 | 219,511 | 148,542 | |||||||||||||||||||
| Total leases renewed (sq feet) | 217,652 | 199,093 | 804,998 | 619,160 | |||||||||||||||||||
| Leases renewed with rate increase (count) | 25 | 33 | 92 | 104 | |||||||||||||||||||
| Leases renewed with rate decrease (count) | 1 | 1 | 9 | 11 | |||||||||||||||||||
| Leases renewed with no rate change (count) | 1 | 2 | 25 | 23 | |||||||||||||||||||
| Total leases renewed (count) | 27 | 36 | 126 | 138 | |||||||||||||||||||
| Option exercised (count) | 5 | 6 | 16 | 22 | |||||||||||||||||||
| Weighted average on rate increases (per sq foot) | $ | 0.99 | $ | 0.97 | $ | 1.16 | $ | 0.85 | |||||||||||||||
| Weighted average on rate decreases (per sq foot) | $ | (1.51) | $ | (0.15) | $ | (1.94) | $ | (2.18) | |||||||||||||||
| Weighted average rate on all renewals (per sq foot) | $ | 0.94 | $ | 0.67 | $ | 0.71 | $ | 0.32 | |||||||||||||||
| Weighted average change over prior rates | 9.19 | % | 6.13 | % | 7.73 | % | 3.05 | % | |||||||||||||||
New Leases(1) (2): | |||||||||||||||||||||||
| New leases (sq feet) | 70,232 | 118,548 | 214,936 | 436,170 | |||||||||||||||||||
| New leases (count) | 14 | 14 | 65 | 76 | |||||||||||||||||||
| Weighted average rate (per sq foot) | $ | 9.78 | $ | 7.08 | $ | 11.88 | $ | 8.30 | |||||||||||||||
WHLR | Financial & Operating Data | as of 12/31/2022 unless otherwise stated | 22 | ||||
| Three Months Ended December 31, | Six Months Ended December 31, | ||||||||||
| 2022 | 2022 | ||||||||||
Renewals(1): | |||||||||||
| Leases renewed with rate increase (sq feet) | 81,904 | 124,875 | |||||||||
| Leases renewed with rate decrease (sq feet) | — | 29,223 | |||||||||
| Leases renewed with no rate change (sq feet) | 64,950 | 64,950 | |||||||||
| Total leases renewed (sq feet) | 146,854 | 219,048 | |||||||||
| Leases renewed with rate increase (count) | 4 | 12 | |||||||||
| Leases renewed with rate decrease (count) | — | 2 | |||||||||
| Leases renewed with no rate change (count) | 3 | 3 | |||||||||
| Total leases renewed (count) | 7 | 17 | |||||||||
| Option exercised (count) | 1 | 2 | |||||||||
| Weighted average on rate increases (per sq foot) | $ | 2.43 | $ | 1.91 | |||||||
| Weighted average on rate decreases (per sq foot) | $ | — | $ | (0.28) | |||||||
| Weighted average rate on all renewals (per sq foot) | $ | 1.36 | $ | 1.05 | |||||||
| Weighted average change over prior rates | 14.35 | % | 10.26 | % | |||||||
New Leases(1) (2): | |||||||||||
| New leases (sq feet) | 120,853 | 159,213 | |||||||||
| New leases (count) | 9 | 14 | |||||||||
| Weighted average rate (per sq foot) | $ | 11.04 | $ | 10.70 | |||||||
WHLR | Financial & Operating Data | as of 12/31/2022 unless otherwise stated | 23 | ||||
WHLR | Financial & Operating Data | as of 12/31/2022 unless otherwise stated | 24 | ||||
WHLR | Financial & Operating Data | as of 12/31/2022 unless otherwise stated | 25 | ||||