| For the three months ended March 31, 2022 | ||

| Table of Contents | |||||
| Page | |||||
| Company Overview | |||||
| Financial and Portfolio Overview | |||||
| Financial and Operating Results | |||||
| Financial Summary | |||||
| Consolidated Balance Sheets | |||||
| Consolidated Statements of Operations | |||||
| Reconciliation of Non-GAAP Measures | |||||
| Debt Summary | |||||
| Portfolio Summary | |||||
| Property Summary | |||||
| Top Ten Tenants by Annualized Base Rent and Lease Expiration Schedule | |||||
| Leasing Summary | |||||
| Definitions | |||||
WHLR | Financial & Operating Data | 2 | ||||
WHLR | Financial & Operating Data | 3 | ||||
| Corporate Headquarters | ||||||||
| Wheeler Real Estate Investment Trust, Inc. | ||||||||
| Riversedge North | ||||||||
| 2529 Virginia Beach Boulevard Virginia Beach, VA 23452 | ||||||||
| Phone: (757) 627-9088 Toll Free: (866) 203-4864 | ||||||||
| Website: www.whlr.us | ||||||||
| Executive Management | ||||||||
| M. Andrew Franklin - CEO and President | ||||||||
| Crystal Plum - CFO | ||||||||
| Board of Directors | ||||||||
Stefani D. Carter (Chair) | Michelle D. Bergman | |||||||
Saverio M. Flemma | Paula J. Poskon | |||||||
E. J. Borrack | Joseph D. Stilwell | |||||||
Kerry G. Campbell | ||||||||
| Investor Relations Representative | ||||||||
| investorrelations@whlr.us Office: (757) 627-9088 | ||||||||
| Stock Transfer Agent and Registrar | ||||||||
| Computershare Trust Company, N.A. 250 Royall Street Canton, MA 02021 www.computershare.com | ||||||||
WHLR | Financial & Operating Data | 4 | ||||
Financial Results | |||||
| Net loss attributable to Wheeler REIT common stockholders (in 000s) | $ | (6,844) | |||
| Net loss per basic and diluted shares | $ | (0.70) | |||
Funds from operations available to common stockholders and Operating Partnership (OP) unitholders (FFO) (in 000s) (1) | $ | (2,403) | |||
| FFO per common share and OP unit | $ | (0.24) | |||
Adjusted FFO (AFFO) (in 000s) (1) | $ | 2,340 | |||
| AFFO per common share and OP unit | $ | 0.24 | |||
Assets and Leverage | |||||
| Investment Properties, net of $70.4 million accumulated depreciation (in 000s) | $ | 384,327 | |||
| Cash and Cash Equivalents (in 000s) | $ | 21,109 | |||
| Total Assets (in 000s) | $ | 460,036 | |||
| Debt to Total Assets | 74.24 | % | |||
| Debt to Gross Asset Value | 60.50 | % | |||
Market Capitalization | |||||
| Common shares outstanding | 9,723,093 | ||||
| OP units outstanding | 215,343 | ||||
| Total common shares and OP units | 9,938,436 | ||||
| Shares Outstanding at March 31, 2022 | First Quarter stock price range | Stock price as of March 31, 2022 | |||||||||||||||
| Common Stock | 9,723,093 | $1.51-$2.36 | $ | 2.30 | |||||||||||||
| Series B preferred shares | 1,868,343 | $6.08-$7.88 | $ | 6.89 | |||||||||||||
| Series D preferred shares | 3,152,392 | $12.81-$15.55 | $ | 14.40 | |||||||||||||
| Total debt (in 000s) | 341,548 | ||||
| Common Stock market capitalization (as of March 31, 2022 closing stock price, in 000s) | 22,363 | ||||
Portfolio Summary | |||||
| Total Leasable Area (GLA) in sq. ft. | 5,391,432 | ||||
| Occupancy Rate | 93.7 | % | |||
Leased Rate (2) | 95.8 | % | |||
| Annualized Base Rent (in 000s) | $ | 48,853 | |||
| Total number of leases signed or renewed during the first quarter of 2022 | 57 | ||||
| Total sq. ft. leases signed or renewed during the first quarter of 2022 | 160,924 | ||||
WHLR | Financial & Operating Data | as of 3/31/2022 unless otherwise stated | 5 | ||||
WHLR | Financial & Operating Data | as of 3/31/2022 unless otherwise stated | 6 | ||||
WHLR | Financial & Operating Data | as of 3/31/2022 unless otherwise stated | 7 | ||||
| March 31, 2022 | December 31, 2021 | ||||||||||
| (unaudited) | |||||||||||
| ASSETS: | |||||||||||
| Investment properties, net | $ | 384,327 | $ | 386,730 | |||||||
| Cash and cash equivalents | 21,109 | 22,898 | |||||||||
| Restricted cash | 15,709 | 17,521 | |||||||||
| Rents and other tenant receivables, net | 8,839 | 9,233 | |||||||||
| Assets held for sale | 519 | 2,047 | |||||||||
| Above market lease intangibles, net | 2,185 | 2,424 | |||||||||
| Operating lease right-of-use assets | 12,381 | 12,455 | |||||||||
| Deferred costs and other assets, net | 14,967 | 11,973 | |||||||||
| Total Assets | $ | 460,036 | $ | 465,281 | |||||||
| LIABILITIES: | |||||||||||
| Loans payable, net | $ | 331,143 | $ | 333,283 | |||||||
| Liabilities associated with assets held for sale | — | 3,381 | |||||||||
| Below market lease intangibles, net | 3,180 | 3,397 | |||||||||
| Derivative liabilities | 8,738 | 4,776 | |||||||||
| Operating lease liabilities | 12,999 | 13,040 | |||||||||
| Accounts payable, accrued expenses and other liabilities | 12,201 | 11,054 | |||||||||
| Total Liabilities | 368,261 | 368,931 | |||||||||
Series D Cumulative Convertible Preferred Stock (no par value, 6,000,000 shares authorized, 3,152,392 shares issued and outstanding; $107.09 million and $104.97 million aggregate liquidation value, respectively) | 94,791 | 92,548 | |||||||||
| EQUITY: | |||||||||||
Series A Preferred Stock (no par value, 4,500 shares authorized, 562 shares issued and outstanding) | 453 | 453 | |||||||||
Series B Convertible Preferred Stock (no par value, 5,000,000 authorized, 1,868,343 and 1,872,448 shares issued and outstanding, respectively; $46.71 million and $46.81 million aggregate liquidation preference) | 41,121 | 41,189 | |||||||||
Common Stock ($0.01 par value, 200,000,000 shares authorized 9,723,093 and 9,720,532 shares issued and outstanding, respectively) | 97 | 97 | |||||||||
| Additional paid-in capital | 234,319 | 234,229 | |||||||||
| Accumulated deficit | (280,951) | (274,107) | |||||||||
| Total Stockholders’ Equity | (4,961) | 1,861 | |||||||||
| Noncontrolling interests | 1,945 | 1,941 | |||||||||
| Total Equity | (3,016) | 3,802 | |||||||||
| Total Liabilities and Equity | $ | 460,036 | $ | 465,281 | |||||||
WHLR | Financial & Operating Data | as of 3/31/2022 unless otherwise stated | 8 | ||||
| Three Months Ended March 31, | |||||||||||
| 2022 | 2021 | ||||||||||
| REVENUE: | |||||||||||
| Rental revenues | $ | 15,332 | $ | 14,656 | |||||||
| Other revenues | 165 | 72 | |||||||||
| Total Revenue | 15,497 | 14,728 | |||||||||
| OPERATING EXPENSES: | |||||||||||
| Property operations | 5,250 | 4,884 | |||||||||
| Depreciation and amortization | 3,616 | 3,716 | |||||||||
| Impairment of assets held for sale | 660 | — | |||||||||
| Corporate general & administrative | 1,264 | 1,582 | |||||||||
| Total Operating Expenses | 10,790 | 10,182 | |||||||||
| (Loss) gain on disposal of properties | (15) | 176 | |||||||||
| Operating Income | 4,692 | 4,722 | |||||||||
| Interest income | 13 | — | |||||||||
| Interest expense | (4,628) | (8,961) | |||||||||
| Net changes in fair value of derivative liabilities | (3,962) | (347) | |||||||||
| Other income | — | 552 | |||||||||
| Other expense | (691) | — | |||||||||
| Net Loss | (4,576) | (4,034) | |||||||||
| Less: Net income attributable to noncontrolling interests | 4 | 15 | |||||||||
| Net Loss Attributable to Wheeler REIT | (4,580) | (4,049) | |||||||||
| Preferred Stock dividends - undeclared | (2,264) | (2,273) | |||||||||
| Deemed contribution related to preferred stock redemption | — | 4,389 | |||||||||
| Net Loss Attributable to Wheeler REIT Common Stockholders | $ | (6,844) | $ | (1,933) | |||||||
| Loss per share: | |||||||||||
| Basic and Diluted | $ | (0.70) | $ | (0.20) | |||||||
| Weighted-average number of shares: | |||||||||||
| Basic and Diluted | 9,720,589 | 9,704,638 | |||||||||
WHLR | Financial & Operating Data | as of 3/31/2022 unless otherwise stated | 9 | ||||
Three Months Ended March 31, | |||||||||||||||||
| 2022 | 2021 | ||||||||||||||||
| Net Loss | $ | (4,576) | $ | (4,034) | |||||||||||||
| Depreciation and amortization of real estate assets | 3,616 | 3,716 | |||||||||||||||
| Impairment of assets held for sale | 660 | — | |||||||||||||||
| Loss (gain) on disposal of properties | 15 | (176) | |||||||||||||||
| FFO | (285) | (494) | |||||||||||||||
Preferred stock dividends - undeclared (3) | (2,264) | (2,273) | |||||||||||||||
| Preferred stock accretion adjustments | 146 | 162 | |||||||||||||||
| FFO available to common stockholders and common unitholders | (2,403) | (2,605) | |||||||||||||||
| Capital related costs | (24) | 128 | |||||||||||||||
Other non-recurring and non-cash expenses (2) | 701 | 145 | |||||||||||||||
| Net changes in fair value of derivative liabilities | 3,962 | 347 | |||||||||||||||
| Straight-line rental revenue, net straight-line expense | (69) | (214) | |||||||||||||||
| Loan cost amortization | 420 | 3,642 | |||||||||||||||
| Above (below) market lease amortization | 23 | (12) | |||||||||||||||
| Recurring capital expenditures and tenant improvement reserves | (270) | (276) | |||||||||||||||
| AFFO | $ | 2,340 | $ | 1,155 | |||||||||||||
| Weighted Average Common Shares | 9,720,589 | 9,704,638 | |||||||||||||||
| Weighted Average Common Units | 215,343 | 223,665 | |||||||||||||||
| Total Common Shares and Units | 9,935,932 | 9,928,303 | |||||||||||||||
| FFO per Common Share and Common Units | $ | (0.24) | $ | (0.26) | |||||||||||||
| AFFO per Common Share and Common Units | $ | 0.24 | $ | 0.12 | |||||||||||||
WHLR | Financial & Operating Data | as of 3/31/2022 unless otherwise stated | 10 | ||||
| Three Months Ended March 31, | |||||||||||||||||||||||||||||||||||
| Same Store | Non-same Store | Total | |||||||||||||||||||||||||||||||||
| 2022 | 2021 | 2022 | 2021 | 2022 | 2021 | ||||||||||||||||||||||||||||||
| Net Loss | $ | (4,539) | $ | (3,210) | $ | (37) | $ | (824) | $ | (4,576) | $ | (4,034) | |||||||||||||||||||||||
| Adjustments: | |||||||||||||||||||||||||||||||||||
| Other expense | 691 | — | — | — | 691 | — | |||||||||||||||||||||||||||||
| Net changes in fair value of derivative liabilities | 3,962 | 347 | — | — | 3,962 | 347 | |||||||||||||||||||||||||||||
| Interest expense | 4,616 | 8,059 | 12 | 902 | 4,628 | 8,961 | |||||||||||||||||||||||||||||
| Interest income | (13) | — | — | — | (13) | — | |||||||||||||||||||||||||||||
| Loss (gain) on disposal of properties | — | — | 15 | (176) | 15 | (176) | |||||||||||||||||||||||||||||
| Corporate general & administrative | 1,257 | 1,540 | 7 | 42 | 1,264 | 1,582 | |||||||||||||||||||||||||||||
| Impairment of assets held for sale | 660 | — | — | — | 660 | — | |||||||||||||||||||||||||||||
| Depreciation and amortization | 3,616 | 3,661 | — | 55 | 3,616 | 3,716 | |||||||||||||||||||||||||||||
| Other non-property revenue | (8) | (565) | — | — | (8) | (565) | |||||||||||||||||||||||||||||
| Property Net Operating Income | $ | 10,242 | $ | 9,832 | $ | (3) | $ | (1) | $ | 10,239 | $ | 9,831 | |||||||||||||||||||||||
| Property revenues | $ | 15,486 | $ | 14,556 | $ | 3 | $ | 159 | $ | 15,489 | $ | 14,715 | |||||||||||||||||||||||
| Property expenses | 5,244 | 4,724 | 6 | 160 | 5,250 | 4,884 | |||||||||||||||||||||||||||||
| Property Net Operating Income | $ | 10,242 | $ | 9,832 | $ | (3) | $ | (1) | $ | 10,239 | $ | 9,831 | |||||||||||||||||||||||
WHLR | Financial & Operating Data | as of 3/31/2022 unless otherwise stated | 11 | ||||
| Three Months Ended March 31, | |||||||||||||||||
| 2022 | 2021 | ||||||||||||||||
Net Loss | $ | (4,576) | $ | (4,034) | |||||||||||||
Add back: | Depreciation and amortization (1) | 3,639 | 3,704 | ||||||||||||||
Interest expense (2) | 4,628 | 8,961 | |||||||||||||||
EBITDA | 3,691 | 8,631 | |||||||||||||||
| Adjustments for items affecting comparability: | |||||||||||||||||
Capital related costs | (24) | 128 | |||||||||||||||
| Change in FMV of derivative liabilities | 3,962 | 347 | |||||||||||||||
Other non-recurring and non-cash expenses (3) | 691 | (552) | |||||||||||||||
Impairment of assets held for sale | 660 | — | |||||||||||||||
Loss (gain) on disposal of properties | 15 | (176) | |||||||||||||||
Adjusted EBITDA | $ | 8,995 | $ | 8,378 | |||||||||||||
WHLR | Financial & Operating Data | as of 3/31/2022 unless otherwise stated | 12 | ||||
| Property/Description | Monthly Payment | Interest Rate | Maturity | March 31, 2022 | December 31, 2021 | |||||||||||||||||||||||||||
| Litchfield Market Village | $ | 46,057 | 5.50 | % | November 2022 | $ | 7,274 | $ | 7,312 | |||||||||||||||||||||||
| Twin City Commons | $ | 17,827 | 4.86 | % | January 2023 | 2,824 | 2,843 | |||||||||||||||||||||||||
| New Market | $ | 48,747 | 5.65 | % | June 2023 | 6,233 | 6,291 | |||||||||||||||||||||||||
| Benefit Street Note (3) | $ | 53,185 | 5.71 | % | June 2023 | 6,853 | 6,914 | |||||||||||||||||||||||||
| Deutsche Bank Note (2) | $ | 33,340 | 5.71 | % | July 2023 | 5,466 | 5,488 | |||||||||||||||||||||||||
| JANAF | $ | 333,159 | 4.49 | % | July 2023 | 46,592 | 47,065 | |||||||||||||||||||||||||
| First National Bank (6) (7) | $ | 24,656 | LIBOR + 350 basis points | August 2023 | 723 | 789 | ||||||||||||||||||||||||||
| Lumber River (7) | $ | 10,723 | LIBOR + 350 basis points | September 2023 | 1,277 | 1,296 | ||||||||||||||||||||||||||
| Tampa Festival | $ | 50,797 | 5.56 | % | September 2023 | 7,708 | 7,753 | |||||||||||||||||||||||||
| Forrest Gallery | $ | 50,973 | 5.40 | % | September 2023 | 8,016 | 8,060 | |||||||||||||||||||||||||
| South Carolina Food Lions Note (5) | $ | 68,320 | 5.25 | % | January 2024 | 11,201 | 11,259 | |||||||||||||||||||||||||
| JANAF Bravo | $ | 35,076 | 5.00 | % | May 2024 | 5,905 | 5,936 | |||||||||||||||||||||||||
| Cypress Shopping Center | $ | 34,360 | 4.70 | % | July 2024 | 5,999 | 6,031 | |||||||||||||||||||||||||
| Port Crossing | $ | 34,788 | 4.84 | % | August 2024 | 5,744 | 5,778 | |||||||||||||||||||||||||
| Freeway Junction | $ | 41,798 | 4.60 | % | September 2024 | 7,391 | 7,431 | |||||||||||||||||||||||||
| Harrodsburg Marketplace | $ | 19,112 | 4.55 | % | September 2024 | 3,247 | 3,267 | |||||||||||||||||||||||||
| Bryan Station | $ | 23,489 | 4.52 | % | November 2024 | 4,203 | 4,226 | |||||||||||||||||||||||||
| Crockett Square | Interest only | 4.47 | % | December 2024 | 6,338 | 6,338 | ||||||||||||||||||||||||||
| Pierpont Centre | $ | 39,435 | 4.15 | % | February 2025 | 7,825 | 7,861 | |||||||||||||||||||||||||
| Shoppes at Myrtle Park | $ | 33,180 | 4.45 | % | February 2025 | 5,721 | 5,757 | |||||||||||||||||||||||||
| Folly Road | $ | 41,482 | 4.65 | % | March 2025 | 7,020 | 7,063 | |||||||||||||||||||||||||
| Alex City Marketplace | Interest only | 3.95 | % | April 2025 | 5,750 | 5,750 | ||||||||||||||||||||||||||
| Butler Square | Interest only | 3.90 | % | May 2025 | 5,640 | 5,640 | ||||||||||||||||||||||||||
| Brook Run Shopping Center | Interest only | 4.08 | % | June 2025 | 10,950 | 10,950 | ||||||||||||||||||||||||||
| Beaver Ruin Village I and II | Interest only | 4.73 | % | July 2025 | 9,400 | 9,400 | ||||||||||||||||||||||||||
| Sunshine Shopping Plaza | Interest only | 4.57 | % | August 2025 | 5,900 | 5,900 | ||||||||||||||||||||||||||
| Barnett Portfolio (4) | Interest only | 4.30 | % | September 2025 | 8,770 | 8,770 | ||||||||||||||||||||||||||
| Fort Howard Shopping Center | Interest only | 4.57 | % | October 2025 | 7,100 | 7,100 | ||||||||||||||||||||||||||
| Conyers Crossing | Interest only | 4.67 | % | October 2025 | 5,960 | 5,960 | ||||||||||||||||||||||||||
| Grove Park Shopping Center | Interest only | 4.52 | % | October 2025 | 3,800 | 3,800 | ||||||||||||||||||||||||||
| Parkway Plaza | Interest only | 4.57 | % | October 2025 | 3,500 | 3,500 | ||||||||||||||||||||||||||
| Winslow Plaza | $ | 24,295 | 4.82 | % | December 2025 | 4,464 | 4,483 | |||||||||||||||||||||||||
| JANAF BJ's | $ | 29,964 | 4.95 | % | January 2026 | 4,694 | 4,725 | |||||||||||||||||||||||||
| Tuckernuck | $ | 32,202 | 5.00 | % | March 2026 | 5,018 | 5,052 | |||||||||||||||||||||||||
| Chesapeake Square | $ | 23,857 | 4.70 | % | August 2026 | 4,170 | 4,192 | |||||||||||||||||||||||||
| Sangaree/Tri-County | $ | 32,329 | 4.78 | % | December 2026 | 6,153 | 6,176 | |||||||||||||||||||||||||
| Riverbridge | Interest only | 4.48 | % | December 2026 | 4,000 | 4,000 | ||||||||||||||||||||||||||
| Franklin Village | $ | 45,336 | 4.93 | % | January 2027 | 8,243 | 8,277 | |||||||||||||||||||||||||
| Village of Martinsville | $ | 89,664 | 4.28 | % | July 2029 | 15,486 | 15,589 | |||||||||||||||||||||||||
| Laburnum Square | Interest only | 4.28 | % | September 2029 | 7,665 | 7,665 | ||||||||||||||||||||||||||
| Rivergate (8) | $ | 100,222 | 4.25 | % | September 2031 | 18,325 | 18,430 | |||||||||||||||||||||||||
| Convertible Notes | Interest only | 7.00 | % | December 2031 | 33,000 | 33,000 | ||||||||||||||||||||||||||
| Walnut Hill Plaza | $ | 26,850 | 5.50 | % | March 2023 | — | 3,145 | |||||||||||||||||||||||||
Total Principal Balance (1) | 341,548 | 346,262 | ||||||||||||||||||||||||||||||
Unamortized debt issuance cost (1) | (10,405) | (9,834) | ||||||||||||||||||||||||||||||
| Total Loans Payable, including assets held for sale | 331,143 | 336,428 | ||||||||||||||||||||||||||||||
| Less loans payable on assets held for sale, net loan amortization costs | — | 3,145 | ||||||||||||||||||||||||||||||
| Total Loans Payable, net | $ | 331,143 | $ | 333,283 | ||||||||||||||||||||||||||||
WHLR | Financial & Operating Data | as of 3/31/2022 unless otherwise stated | 13 | ||||
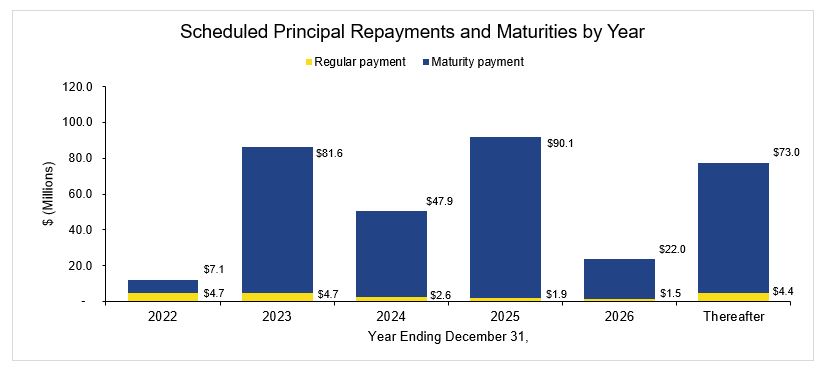
| Scheduled principal repayments and maturities by year | Amount | % Total Principal Payments and Maturities | ||||||||||||
| For the remaining nine months ended December 31, 2022 | $ | 11,848 | 3.47 | % | ||||||||||
| December 31, 2023 | 86,294 | 25.27 | % | |||||||||||
| December 31, 2024 | 50,490 | 14.78 | % | |||||||||||
| December 31, 2025 | 92,016 | 26.94 | % | |||||||||||
| December 31, 2026 | 23,530 | 6.89 | % | |||||||||||
| December 31, 2027 | 8,711 | 2.55 | % | |||||||||||
| Thereafter | 68,659 | 20.10 | % | |||||||||||
| Total principal repayments and debt maturities | $ | 341,548 | 100.00 | % | ||||||||||
WHLR | Financial & Operating Data | as of 3/31/2022 unless otherwise stated | 14 | ||||
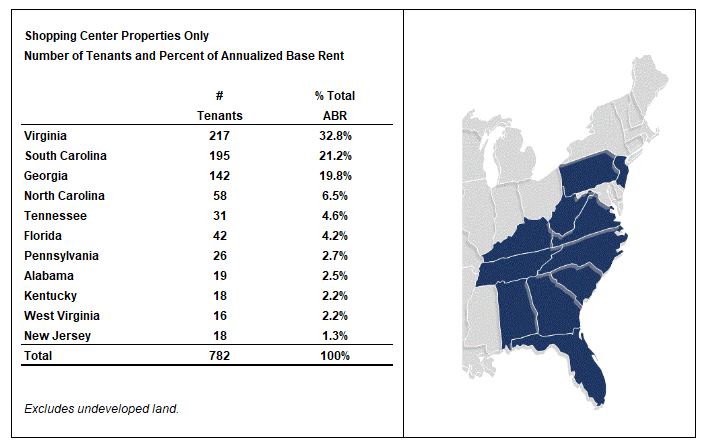
Property | Location | Number of Tenants (1) | Total Leasable Square Feet | Percentage Leased (1) | Percentage Occupied | Total SF Occupied | Annualized Base Rent (in 000's) (2) | Annualized Base Rent per Occupied Sq. Foot | ||||||||||||||||||||||||
| Alex City Marketplace | Alexander City, AL | 19 | 151,843 | 100.0 | % | 100.0 | % | 151,843 | $ | 1,208 | $ | 7.96 | ||||||||||||||||||||
| Amscot Building | Tampa, FL | 1 | 2,500 | 100.0 | % | 100.0 | % | 2,500 | 83 | 33.00 | ||||||||||||||||||||||
| Beaver Ruin Village | Lilburn, GA | 28 | 74,038 | 94.1 | % | 90.0 | % | 66,613 | 1,156 | 17.35 | ||||||||||||||||||||||
| Beaver Ruin Village II | Lilburn, GA | 4 | 34,925 | 100.0 | % | 100.0 | % | 34,925 | 460 | 13.18 | ||||||||||||||||||||||
| Brook Run Shopping Center | Richmond, VA | 20 | 147,738 | 87.8 | % | 87.8 | % | 129,710 | 1,225 | 9.44 | ||||||||||||||||||||||
| Brook Run Properties (3) | Richmond, VA | — | — | — | % | — | % | — | — | — | ||||||||||||||||||||||
| Bryan Station | Lexington, KY | 10 | 54,277 | 100.0 | % | 100.0 | % | 54,277 | 617 | 11.37 | ||||||||||||||||||||||
| Butler Square | Mauldin, SC | 16 | 82,400 | 98.2 | % | 98.2 | % | 80,950 | 858 | 10.60 | ||||||||||||||||||||||
| Cardinal Plaza | Henderson, NC | 9 | 50,000 | 100.0 | % | 100.0 | % | 50,000 | 502 | 10.03 | ||||||||||||||||||||||
| Chesapeake Square | Onley, VA | 14 | 108,982 | 99.1 | % | 99.1 | % | 108,016 | 830 | 7.68 | ||||||||||||||||||||||
| Clover Plaza | Clover, SC | 10 | 45,575 | 100.0 | % | 100.0 | % | 45,575 | 379 | 8.32 | ||||||||||||||||||||||
| Courtland Commons (3) | Courtland, VA | — | — | — | % | — | % | — | — | — | ||||||||||||||||||||||
| Conyers Crossing | Conyers, GA | 14 | 170,475 | 100.0 | % | 100.0 | % | 170,475 | 953 | 5.59 | ||||||||||||||||||||||
| Crockett Square | Morristown, TN | 4 | 107,122 | 100.0 | % | 100.0 | % | 107,122 | 970 | 9.06 | ||||||||||||||||||||||
| Cypress Shopping Center | Boiling Springs, SC | 17 | 80,435 | 41.2 | % | 41.2 | % | 33,175 | 452 | 13.62 | ||||||||||||||||||||||
| Darien Shopping Center | Darien, GA | 1 | 26,001 | 100.0 | % | 100.0 | % | 26,001 | 140 | 5.38 | ||||||||||||||||||||||
| Devine Street | Columbia, SC | 1 | 38,464 | 89.1 | % | 89.1 | % | 34,264 | 180 | 5.25 | ||||||||||||||||||||||
| Edenton Commons (3) | Edenton, NC | — | — | — | % | — | % | — | — | — | ||||||||||||||||||||||
| Folly Road | Charleston, SC | 5 | 47,794 | 100.0 | % | 100.0 | % | 47,794 | 733 | 15.33 | ||||||||||||||||||||||
| Forrest Gallery | Tullahoma, TN | 27 | 214,451 | 91.1 | % | 80.8 | % | 173,289 | 1,293 | 7.46 | ||||||||||||||||||||||
| Fort Howard Shopping Center | Rincon, GA | 19 | 113,652 | 100.0 | % | 95.1 | % | 108,120 | 1,062 | 9.83 | ||||||||||||||||||||||
| Freeway Junction | Stockbridge, GA | 16 | 156,834 | 99.3 | % | 96.4 | % | 151,199 | 1,290 | 8.53 | ||||||||||||||||||||||
| Franklin Village | Kittanning, PA | 26 | 151,821 | 100.0 | % | 100.0 | % | 151,821 | 1,306 | 8.60 | ||||||||||||||||||||||
| Franklinton Square | Franklinton, NC | 15 | 65,366 | 100.0 | % | 100.0 | % | 65,366 | 592 | 9.06 | ||||||||||||||||||||||
| Georgetown | Georgetown, SC | 2 | 29,572 | 100.0 | % | 100.0 | % | 29,572 | 267 | 9.04 | ||||||||||||||||||||||
| Grove Park Shopping Center | Orangeburg, SC | 14 | 93,265 | 100.0 | % | 100.0 | % | 93,265 | 718 | 7.70 | ||||||||||||||||||||||
| Harbor Point (3) | Grove, OK | — | — | — | % | — | % | — | — | — | ||||||||||||||||||||||
| Harrodsburg Marketplace | Harrodsburg, KY | 8 | 60,048 | 91.0 | % | 91.0 | % | 54,648 | 450 | 8.24 | ||||||||||||||||||||||
| JANAF (4) | Norfolk, VA | 118 | 798,086 | 95.6 | % | 93.2 | % | 743,936 | 8,865 | 11.92 | ||||||||||||||||||||||
| Laburnum Square | Richmond, VA | 19 | 109,405 | 96.9 | % | 96.9 | % | 106,045 | 964 | 9.09 | ||||||||||||||||||||||
| Ladson Crossing | Ladson, SC | 16 | 52,607 | 100.0 | % | 100.0 | % | 52,607 | 539 | 10.26 | ||||||||||||||||||||||
| LaGrange Marketplace | LaGrange, GA | 12 | 76,594 | 84.3 | % | 84.3 | % | 64,600 | 358 | 5.54 | ||||||||||||||||||||||
| Lake Greenwood Crossing | Greenwood, SC | 8 | 43,618 | 100.0 | % | 100.0 | % | 43,618 | 363 | 8.32 | ||||||||||||||||||||||
| Lake Murray | Lexington, SC | 5 | 39,218 | 100.0 | % | 100.0 | % | 39,218 | 257 | 6.56 | ||||||||||||||||||||||
| Litchfield Market Village | Pawleys Island, SC | 22 | 86,740 | 98.8 | % | 97.1 | % | 84,237 | 980 | 11.63 | ||||||||||||||||||||||
| Lumber River Village | Lumberton, NC | 11 | 66,781 | 98.2 | % | 98.2 | % | 65,581 | 455 | 6.93 | ||||||||||||||||||||||
| Moncks Corner | Moncks Corner, SC | 1 | 26,800 | 100.0 | % | 100.0 | % | 26,800 | 330 | 12.31 | ||||||||||||||||||||||
| Nashville Commons | Nashville, NC | 11 | 56,100 | 100.0 | % | 92.0 | % | 51,600 | 585 | 11.34 | ||||||||||||||||||||||
| New Market Crossing | Mt. Airy, NC | 12 | 117,076 | 100.0 | % | 100.0 | % | 117,076 | 1,030 | 8.80 | ||||||||||||||||||||||
| Parkway Plaza | Brunswick, GA | 4 | 52,365 | 81.7 | % | 81.7 | % | 42,785 | 354 | 8.27 | ||||||||||||||||||||||
| Pierpont Centre | Morgantown, WV | 16 | 111,162 | 95.4 | % | 95.4 | % | 106,042 | 1,058 | 9.97 | ||||||||||||||||||||||
| Port Crossing | Harrisonburg, VA | 8 | 65,365 | 100.0 | % | 100.0 | % | 65,365 | 861 | 13.17 | ||||||||||||||||||||||
| Ridgeland | Ridgeland, SC | 1 | 20,029 | 100.0 | % | 100.0 | % | 20,029 | 140 | 7.00 | ||||||||||||||||||||||
| Riverbridge Shopping Center | Carrollton, GA | 11 | 91,188 | 100.0 | % | 100.0 | % | 91,188 | 766 | 8.40 | ||||||||||||||||||||||
| Rivergate Shopping Center | Macon, GA | 24 | 193,960 | 87.0 | % | 87.0 | % | 168,816 | 2,457 | 14.56 | ||||||||||||||||||||||
| Sangaree Plaza | Summerville, SC | 10 | 66,948 | 100.0 | % | 100.0 | % | 66,948 | 708 | 10.58 | ||||||||||||||||||||||
| Shoppes at Myrtle Park | Bluffton, SC | 13 | 56,601 | 99.1 | % | 97.3 | % | 55,084 | 634 | 11.52 | ||||||||||||||||||||||
| South Lake | Lexington, SC | 10 | 44,318 | 97.3 | % | 97.3 | % | 43,118 | 239 | 5.54 | ||||||||||||||||||||||
| South Park | Mullins, SC | 4 | 60,734 | 96.9 | % | 96.9 | % | 58,834 | 387 | 6.58 | ||||||||||||||||||||||
| South Square | Lancaster, SC | 6 | 44,350 | 80.9 | % | 80.9 | % | 35,900 | 302 | 8.40 | ||||||||||||||||||||||
| St. George Plaza | St. George, SC | 8 | 59,174 | 100.0 | % | 96.3 | % | 56,999 | 407 | 7.14 | ||||||||||||||||||||||
| Sunshine Plaza | Lehigh Acres, FL | 22 | 111,189 | 99.6 | % | 99.6 | % | 110,743 | 1,073 | 9.69 | ||||||||||||||||||||||
| Surrey Plaza | Hawkinsville, GA | 3 | 42,680 | 96.5 | % | 96.5 | % | 41,180 | 247 | 6.00 | ||||||||||||||||||||||
WHLR | Financial & Operating Data | as of 3/31/2022 unless otherwise stated | 15 | ||||
Property | Location | Number of Tenants (1) | Total Leasable Square Feet | Percentage Leased (1) | Percentage Occupied | Total SF Occupied | Annualized Base Rent (in 000's) (2) | Annualized Base Rent per Occupied Sq. Foot | ||||||||||||||||||||||||
| Tampa Festival | Tampa, FL | 19 | 137,987 | 97.7 | % | 64.6 | % | 89,166 | $ | 912 | $ | 10.23 | ||||||||||||||||||||
| Tri-County Plaza | Royston, GA | 6 | 67,577 | 88.8 | % | 88.8 | % | 59,977 | 420 | 7.00 | ||||||||||||||||||||||
| Tuckernuck | Richmond, VA | 17 | 93,440 | 100.0 | % | 98.2 | % | 91,745 | 974 | 10.70 | ||||||||||||||||||||||
| Twin City Commons | Batesburg-Leesville, SC | 5 | 47,680 | 100.0 | % | 97.5 | % | 46,480 | 464 | 9.98 | ||||||||||||||||||||||
| Village of Martinsville | Martinsville, VA | 21 | 290,902 | 97.7 | % | 97.7 | % | 284,294 | 2,320 | 8.21 | ||||||||||||||||||||||
| Waterway Plaza | Little River, SC | 10 | 49,750 | 100.0 | % | 100.0 | % | 49,750 | 500 | 10.06 | ||||||||||||||||||||||
| Westland Square | West Columbia, SC | 11 | 62,735 | 100.0 | % | 100.0 | % | 62,735 | 534 | 8.51 | ||||||||||||||||||||||
| Winslow Plaza | Sicklerville, NJ | 18 | 40,695 | 100.0 | % | 100.0 | % | 40,695 | 646 | 15.88 | ||||||||||||||||||||||
| 782 | 5,391,432 | 95.8 | % | 93.7 | % | 5,053,711 | $ | 48,853 | $ | 9.67 | ||||||||||||||||||||||
WHLR | Financial & Operating Data | as of 3/31/2022 unless otherwise stated | 16 | ||||
| Tenants | Annualized Base Rent ($ in 000s) | % of Total Annualized Base Rent | Total Occupied Square Feet | Percent Total Leasable Square Foot | Base Rent Per Occupied Square Foot | ||||||||||||||||||||||||||||||
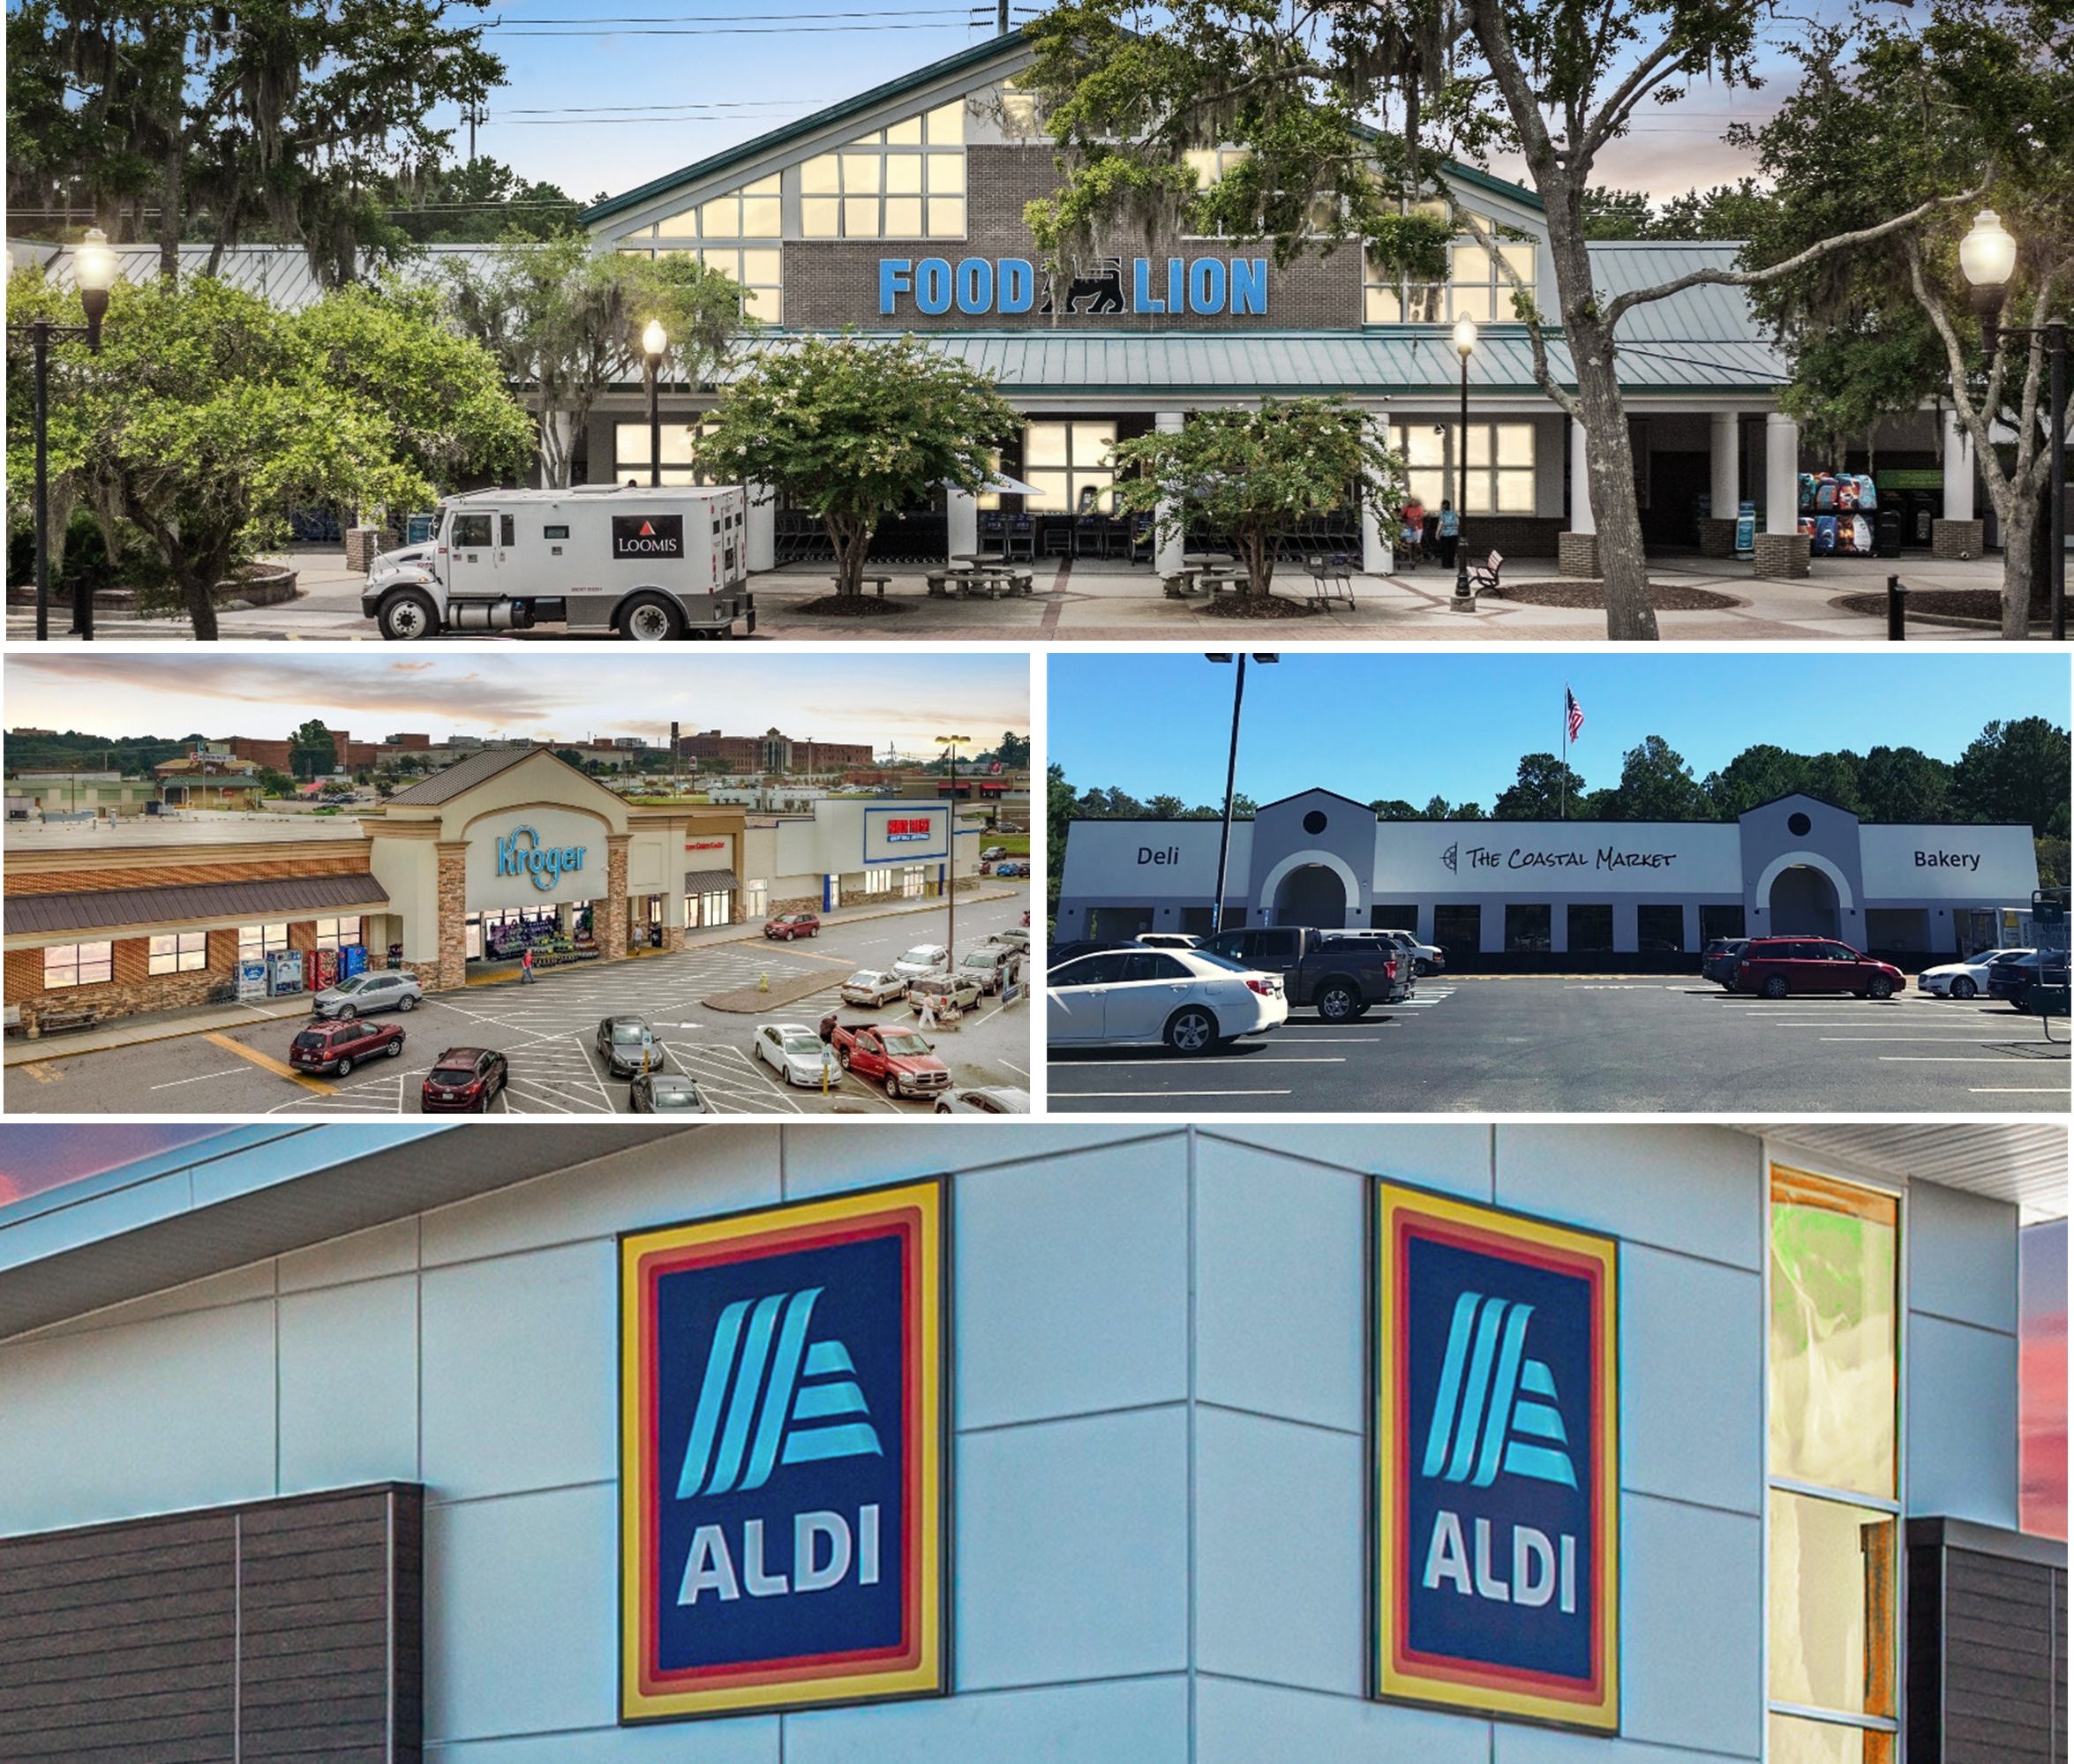
| Food Lion | $ | 4,430 | 9.07 | % | 551,469 | 10.23 | % | $ | 8.03 | ||||||||||||||||||||||||||
Kroger Co. (1) | 2,097 | 4.29 | % | 239,482 | 4.44 | % | 8.76 | ||||||||||||||||||||||||||||
| Piggly Wiggly | 1,495 | 3.06 | % | 202,968 | 3.76 | % | 7.37 | ||||||||||||||||||||||||||||
Dollar Tree (2) | 1,192 | 2.44 | % | 148,605 | 2.76 | % | 8.02 | ||||||||||||||||||||||||||||
Lowes Foods (3) | 1,181 | 2.42 | % | 130,036 | 2.41 | % | 9.08 | ||||||||||||||||||||||||||||
| Winn Dixie | 887 | 1.82 | % | 133,575 | 2.48 | % | 6.64 | ||||||||||||||||||||||||||||
| Planet Fitness | 837 | 1.71 | % | 100,427 | 1.86 | % | 8.33 | ||||||||||||||||||||||||||||
| Hobby Lobby | 717 | 1.47 | % | 114,298 | 2.12 | % | 6.27 | ||||||||||||||||||||||||||||
| Big Lots | 679 | 1.39 | % | 105,674 | 1.96 | % | 6.43 | ||||||||||||||||||||||||||||
| BJ'S Wholesale Club | 651 | 1.33 | % | 147,400 | 2.73 | % | 4.42 | ||||||||||||||||||||||||||||
| $ | 14,166 | 29.00 | % | 1,873,934 | 34.75 | % | $ | 7.56 | |||||||||||||||||||||||||||
| Lease Expiration Period | Number of Expiring Leases | Total Expiring Square Footage | % of Total Expiring Square Footage | % of Total Occupied Square Footage Expiring | Expiring Annualized Base Rent (in 000s) | % of Total Annualized Base Rent | Expiring Base Rent Per Occupied Square Foot | |||||||||||||||||||||||||||||||||||||
| Available | — | 337,721 | 6.26 | % | — | % | $ | — | — | % | $ | — | ||||||||||||||||||||||||||||||||
| MTM | 9 | 21,283 | 0.39 | % | 0.42 | % | 299 | 0.61 | % | 14.05 | ||||||||||||||||||||||||||||||||||
| 2022 | 66 | 249,322 | 4.62 | % | 4.93 | % | 2,456 | 5.03 | % | 9.85 | ||||||||||||||||||||||||||||||||||
| 2023 | 134 | 794,423 | 14.73 | % | 15.72 | % | 7,132 | 14.60 | % | 8.98 | ||||||||||||||||||||||||||||||||||
| 2024 | 139 | 743,355 | 13.79 | % | 14.71 | % | 7,310 | 14.96 | % | 9.83 | ||||||||||||||||||||||||||||||||||
| 2025 | 122 | 868,631 | 16.11 | % | 17.19 | % | 8,710 | 17.83 | % | 10.03 | ||||||||||||||||||||||||||||||||||
| 2026 | 118 | 799,251 | 14.82 | % | 15.82 | % | 8,041 | 16.46 | % | 10.06 | ||||||||||||||||||||||||||||||||||
| 2027 | 83 | 362,811 | 6.73 | % | 7.18 | % | 4,189 | 8.57 | % | 11.55 | ||||||||||||||||||||||||||||||||||
| 2028 | 22 | 336,946 | 6.25 | % | 6.67 | % | 2,426 | 4.97 | % | 7.20 | ||||||||||||||||||||||||||||||||||
| 2029 | 22 | 156,710 | 2.91 | % | 3.10 | % | 1,535 | 3.14 | % | 9.80 | ||||||||||||||||||||||||||||||||||
| 2030 | 16 | 258,565 | 4.80 | % | 5.12 | % | 2,055 | 4.21 | % | 7.95 | ||||||||||||||||||||||||||||||||||
| 2031 & thereafter | 51 | 462,414 | 8.59 | % | 9.14 | % | 4,700 | 9.62 | % | 10.17 | ||||||||||||||||||||||||||||||||||
| Total | 782 | 5,391,432 | 100.00 | % | 100.00 | % | $ | 48,853 | 100.00 | % | $ | 9.67 | ||||||||||||||||||||||||||||||||
WHLR | Financial & Operating Data | as of 3/31/2022 unless otherwise stated | 17 | ||||
| No Option | Option | ||||||||||||||||||||||||||||||||||
| Lease Expiration Period | Number of Expiring Leases | Expiring Occupied Square Footage | Expiring Annualized Based Rent (in 000s) | % of Total Annualized Base Rent | Expiring Base Rent per Square Foot | Number of Expiring Leases | Expiring Occupied Square Footage | Expiring Annualized Based Rent (in 000s) | % of Total Annualized Base Rent | Expiring Base Rent per Square Foot | |||||||||||||||||||||||||
| Available | — | 174,013 | $ | — | — | % | $ | — | — | — | $ | — | — | % | $ | — | |||||||||||||||||||
| Month-to-Month | — | — | — | — | % | — | — | — | — | — | % | — | |||||||||||||||||||||||
| 2022 | — | — | — | — | % | — | 2 | 71,203 | 435 | 2.33 | % | 6.11 | |||||||||||||||||||||||
| 2023 | 2 | 43,392 | 420 | 21.47 | % | 9.68 | 13 | 460,495 | 2,894 | 15.48 | % | 6.28 | |||||||||||||||||||||||
| 2024 | 1 | 32,000 | 125 | 6.39 | % | 3.91 | 9 | 351,977 | 2,331 | 12.47 | % | 6.62 | |||||||||||||||||||||||
| 2025 | 2 | 84,633 | 619 | 31.65 | % | 7.31 | 12 | 472,936 | 3,782 | 20.23 | % | 8.00 | |||||||||||||||||||||||
| 2026 | 1 | 20,152 | 97 | 4.96 | % | 4.81 | 13 | 435,435 | 3,505 | 18.75 | % | 8.05 | |||||||||||||||||||||||
| 2027 | 2 | 45,759 | 323 | 16.50 | % | 7.06 | 2 | 57,345 | 447 | 2.39 | % | 7.79 | |||||||||||||||||||||||
| 2028 | — | — | — | — | % | — | 7 | 280,841 | 1,637 | 8.76 | % | 5.83 | |||||||||||||||||||||||
| 2029 | 1 | 21,213 | 317 | 16.21 | % | 14.94 | 2 | 45,700 | 307 | 1.64 | % | 6.72 | |||||||||||||||||||||||
| 2030 | — | — | — | 0.01 | % | — | 3 | 216,346 | 1,359 | 7.27 | % | 6.28 | |||||||||||||||||||||||
| 2031+ | 1 | 20,858 | 55 | 2.81 | % | 2.64 | 8 | 282,952 | 1,996 | 10.68 | % | 7.05 | |||||||||||||||||||||||
| Total | 10 | 442,020 | $ | 1,956 | 100.00 | % | $ | 7.30 | 71 | 2,675,230 | $ | 18,693 | 100.00 | % | $ | 6.99 | |||||||||||||||||||
| No Option | Option | ||||||||||||||||||||||||||||||||||
| Lease Expiration Period | Number of Expiring Leases | Expiring Occupied Square Footage | Expiring Annualized Based Rent (in 000s) | % of Total Annualized Base Rent | Expiring Base Rent per Square Foot | Number of Expiring Leases | Expiring Occupied Square Footage | Expiring Annualized Based Rent (in 000s) | % of Total Annualized Base Rent | Expiring Base Rent per Square Foot | |||||||||||||||||||||||||
| Available | — | 163,708 | $ | — | — | % | $ | — | — | — | $ | — | — | % | $ | — | |||||||||||||||||||
| Month-to-Month | 9 | 21,283 | 299 | 2.17 | % | 14.05 | — | — | — | — | % | — | |||||||||||||||||||||||
| 2022 | 44 | 116,167 | 1,087 | 7.88 | % | 9.36 | 20 | 61,952 | 934 | 6.48 | % | 15.08 | |||||||||||||||||||||||
| 2023 | 71 | 144,646 | 1,916 | 13.88 | % | 13.25 | 48 | 145,890 | 1,902 | 13.21 | % | 13.04 | |||||||||||||||||||||||
| 2024 | 80 | 178,034 | 2,384 | 17.27 | % | 13.39 | 49 | 181,344 | 2,470 | 17.15 | % | 13.62 | |||||||||||||||||||||||
| 2025 | 69 | 166,368 | 2,245 | 16.27 | % | 13.49 | 39 | 144,694 | 2,064 | 14.33 | % | 14.26 | |||||||||||||||||||||||
| 2026 | 63 | 164,375 | 2,186 | 15.84 | % | 13.30 | 41 | 179,289 | 2,253 | 15.64 | % | 12.57 | |||||||||||||||||||||||
| 2027 | 49 | 120,557 | 1,618 | 11.72 | % | 13.42 | 30 | 139,150 | 1,802 | 12.51 | % | 12.95 | |||||||||||||||||||||||
| 2028 | 10 | 34,589 | 521 | 3.78 | % | 15.06 | 5 | 21,516 | 268 | 1.86 | % | 12.46 | |||||||||||||||||||||||
| 2029 | 8 | 26,250 | 261 | 1.89 | % | 9.94 | 11 | 63,547 | 650 | 4.51 | % | 10.23 | |||||||||||||||||||||||
| 2030 | 7 | 23,103 | 296 | 2.14 | % | 12.81 | 6 | 19,116 | 400 | 2.78 | % | 20.92 | |||||||||||||||||||||||
| 2031+ | 20 | 62,918 | 988 | 7.16 | % | 15.70 | 22 | 95,686 | 1,660 | 11.53 | % | 17.35 | |||||||||||||||||||||||
| Total | 430 | 1,221,998 | $ | 13,801 | 100.00 | % | $ | 13.04 | 271 | 1,052,184 | $ | 14,403 | 100.00 | % | $ | 13.69 | |||||||||||||||||||
WHLR | Financial & Operating Data | as of 3/31/2022 unless otherwise stated | 18 | ||||
| Three Months Ended March 31, | |||||||||||
| 2022 | 2021 | ||||||||||
Renewals(1): | |||||||||||
| Leases renewed with rate increase (sq feet) | 66,348 | 145,173 | |||||||||
| Leases renewed with rate decrease (sq feet) | 5,328 | 24,873 | |||||||||
| Leases renewed with no rate change (sq feet) | 20,329 | 17,959 | |||||||||
| Total leases renewed (sq feet) | 92,005 | 188,005 | |||||||||
| Leases renewed with rate increase (count) | 20 | 27 | |||||||||
| Leases renewed with rate decrease (count) | 2 | 5 | |||||||||
| Leases renewed with no rate change (count) | 12 | 8 | |||||||||
| Total leases renewed (count) | 34 | 40 | |||||||||
| Option exercised (count) | 2 | 4 | |||||||||
| Weighted average on rate increases (per sq foot) | $ | 1.15 | $ | 0.68 | |||||||
| Weighted average on rate decreases (per sq foot) | $ | (2.13) | $ | (1.15) | |||||||
| Weighted average rate on all renewals (per sq foot) | $ | 0.71 | $ | 0.38 | |||||||
| Weighted average change over prior rates | 5.86 | % | 4.22 | % | |||||||
New Leases(1) (2): | |||||||||||
| New leases (sq feet) | 68,919 | 112,594 | |||||||||
| New leases (count) | 23 | 19 | |||||||||
| Weighted average rate (per sq foot) | $ | 13.09 | $ | 8.25 | |||||||
| Gross Leasable Area ("GLA") expiring during the next 9 months, including month-to-month leases | 5.01 | % | 4.43 | % | |||||||
WHLR | Financial & Operating Data | as of 3/31/2022 unless otherwise stated | 19 | ||||
WHLR | Financial & Operating Data | as of 3/31/2022 unless otherwise stated | 20 | ||||
WHLR | Financial & Operating Data | as of 3/31/2022 unless otherwise stated | 21 | ||||