
| Table of Contents | |||||
| Page | |||||
| Company Overview | |||||
| Financial and Portfolio Overview | |||||
| Financial and Operating Results | |||||
| Financial Summary | |||||
| Consolidated Balance Sheets | |||||
| Consolidated Statements of Operations | |||||
| Reconciliation of Non-GAAP Measures | |||||
| Debt Summary | |||||
| Portfolio Summary | |||||
| Property Summary | |||||
| Top Ten Tenants by Annualized Base Rent and Lease Expiration Schedule | |||||
| Leasing Summary | |||||
| Definitions | |||||
WHLR | Financial & Operating Data | 2 | ||||
| Corporate Headquarters | ||||||||
| Wheeler Real Estate Investment Trust, Inc. | ||||||||
| Riversedge North | ||||||||
| 2529 Virginia Beach Boulevard Virginia Beach, VA 23452 | ||||||||
| Phone: (757) 627-9088 Toll Free: (866) 203-4864 | ||||||||
| Website: www.whlr.us | ||||||||
| Executive Management | ||||||||
| M. Andrew Franklin - Interim CEO | ||||||||
| Crystal Plum - CFO | ||||||||
| Board of Directors | ||||||||
Stefani D. Carter (Chair) | Michelle D. Bergman | |||||||
Saverio M. Flemma | Paula J. Poskon | |||||||
E. J. Borrack | Joseph D. Stilwell | |||||||
Kerry G. Campbell | ||||||||
| Investor Relations Representative | ||||||||
| Mary Jensen - IRRealized, LLC mjensen@whlr.us Office: (757) 627-9088 Cell: (310) 526-1707 | ||||||||
| Transfer Agent and Registrar | ||||||||
| Computershare Trust Company, N.A. 250 Royall Street Canton, MA 02021 www.computershare.com | ||||||||
WHLR | Financial & Operating Data | 3 | ||||
Financial Results | |||||
| Net loss attributable to Wheeler REIT common stockholders (in 000s) | $ | (5,667) | |||
| Net loss per basic and diluted shares | $ | (0.58) | |||
Funds from operations available to common stockholders and Operating Partnership (OP) unitholders (FFO) (in 000s) (1) | $ | (332) | |||
| FFO per common share and OP unit | $ | (0.03) | |||
Adjusted FFO (AFFO) (in 000s) (1) | $ | 1,109 | |||
| AFFO per common share and OP unit | $ | 0.11 | |||
Assets and Leverage | |||||
| Investment Properties, net of $63.87 million accumulated depreciation (in 000s) | $ | 387,179 | |||
| Cash and Cash Equivalents (in 000s) | $ | 10,850 | |||
| Total Assets (in 000s) | $ | 478,145 | |||
Debt to Total Assets(3) | 74.64 | % | |||
| Debt to Gross Asset Value | 61.78 | % | |||
Market Capitalization | |||||
| Common shares outstanding | 9,710,414 | ||||
| OP units outstanding | 217,889 | ||||
| Total common shares and OP units | 9,928,303 | ||||
| Shares Outstanding at June 30, 2021 | Second Quarter stock price range | Stock price as of June 30, 2021 | |||||||||||||||
| Common Stock | 9,710,414 | $3.55 - $5.44 | $ | 5.06 | |||||||||||||
| Series B preferred shares | 1,875,748 | $11.00 - $15.37 | $ | 15.00 | |||||||||||||
| Series D preferred shares | 3,038,683 | $17.80 - $18.75 | $ | 17.94 | |||||||||||||
Total debt (in 000s)(3) | $ | 356,891 | |||
| Common Stock market capitalization (as of June 30, 2021 closing stock price, in 000s) | $ | 49,135 | |||
Portfolio Summary | |||||
| Total Leasable Area (GLA) in sq. ft. | 5,511,881 | ||||
| Occupancy Rate | 90.0 | % | |||
Leased Rate (2) | 91.9 | % | |||
| Annualized Base Rent (in 000s) | $ | 47,285 | |||
| Total number of leases signed or renewed during the second quarter of 2021 | 44 | ||||
| Total sq. ft. of leases signed or renewed during the second quarter of 2021 | 220,438 | ||||
WHLR | Financial & Operating Data | as of 6/30/2021 unless otherwise stated | 4 | ||||
WHLR | Financial & Operating Data | as of 6/30/2021 unless otherwise stated | 5 | ||||
WHLR | Financial & Operating Data | as of 6/30/2021 unless otherwise stated | 6 | ||||
WHLR | Financial & Operating Data | as of 6/30/2021 unless otherwise stated | 7 | ||||
WHLR | Financial & Operating Data | as of 6/30/2021 unless otherwise stated | 8 | ||||
| June 30, 2021 | December 31, 2020 | ||||||||||
| (unaudited) | |||||||||||
| ASSETS: | |||||||||||
| Investment properties, net | $ | 387,179 | $ | 392,664 | |||||||
| Cash and cash equivalents | 10,850 | 7,660 | |||||||||
| Restricted cash | 33,302 | 35,108 | |||||||||
| Rents and other tenant receivables, net | 7,835 | 9,153 | |||||||||
| Assets held for sale | 8,846 | 13,072 | |||||||||
| Above market lease intangibles, net | 2,954 | 3,547 | |||||||||
| Operating lease right-of-use assets | 12,601 | 12,745 | |||||||||
| Deferred costs and other assets, net | 14,578 | 15,430 | |||||||||
| Total Assets | $ | 478,145 | $ | 489,379 | |||||||
| LIABILITIES: | |||||||||||
| Loans payable, net | $ | 335,255 | $ | 334,266 | |||||||
| Liabilities associated with assets held for sale | 10,911 | 13,124 | |||||||||
| Below market lease intangibles, net | 3,918 | 4,554 | |||||||||
| Warrant liability | 4,193 | 594 | |||||||||
| Operating lease liabilities | 13,121 | 13,200 | |||||||||
| Accounts payable, accrued expenses and other liabilities | 13,771 | 11,229 | |||||||||
| Total Liabilities | 381,169 | 376,967 | |||||||||
| Series D Cumulative Convertible Preferred Stock (no par value, 4,000,000 shares authorized, 3,038,683 and 3,529,293 shares issued and outstanding, respectively; $98.05 million and $109.13 million aggregate liquidation value, respectively) | 86,606 | 95,563 | |||||||||
| EQUITY: | |||||||||||
| Series A Preferred Stock (no par value, 4,500 shares authorized, 562 shares issued and outstanding) | 453 | 453 | |||||||||
| Series B Convertible Preferred Stock (no par value, 5,000,000 authorized, 1,875,748 shares issued and outstanding; $46.90 million aggregate liquidation preference) | 41,218 | 41,174 | |||||||||
| Common Stock ($0.01 par value, 18,750,000 shares authorized, 9,710,414 and 9,703,874 shares issued and outstanding, respectively) | 97 | 97 | |||||||||
| Additional paid-in capital | 234,119 | 234,061 | |||||||||
| Accumulated deficit | (267,405) | (260,867) | |||||||||
| Total Stockholders’ Equity | 8,482 | 14,918 | |||||||||
| Noncontrolling interests | 1,888 | 1,931 | |||||||||
| Total Equity | 10,370 | 16,849 | |||||||||
| Total Liabilities and Equity | $ | 478,145 | $ | 489,379 | |||||||
WHLR | Financial & Operating Data | as of 6/30/2021 unless otherwise stated | 9 | ||||
| Three Months Ended June 30, | Six Months Ended June 30, | ||||||||||||||||||||||
| 2021 | 2020 | 2021 | 2020 | ||||||||||||||||||||
| REVENUE: | |||||||||||||||||||||||
| Rental revenues | $ | 15,290 | $ | 14,809 | $ | 29,946 | $ | 30,164 | |||||||||||||||
| Other revenues | 200 | 360 | 272 | 579 | |||||||||||||||||||
| Total Revenue | 15,490 | 15,169 | 30,218 | 30,743 | |||||||||||||||||||
| OPERATING EXPENSES: | |||||||||||||||||||||||
| Property operations | 4,660 | 4,573 | 9,544 | 9,296 | |||||||||||||||||||
| Depreciation and amortization | 3,639 | 4,446 | 7,355 | 9,245 | |||||||||||||||||||
| Impairment of assets held for sale | 2,200 | — | 2,200 | 600 | |||||||||||||||||||
| Corporate general & administrative | 1,607 | 1,615 | 3,189 | 3,487 | |||||||||||||||||||
| Total Operating Expenses | 12,106 | 10,634 | 22,288 | 22,628 | |||||||||||||||||||
| Gain (loss) on disposal of properties | — | — | 176 | (26) | |||||||||||||||||||
| Operating Income | 3,384 | 4,535 | 8,106 | 8,089 | |||||||||||||||||||
| Interest expense | (5,215) | (4,273) | (14,176) | (8,672) | |||||||||||||||||||
| Net changes in fair value of warrants | (1,234) | — | (1,581) | — | |||||||||||||||||||
| Other income | — | — | 552 | — | |||||||||||||||||||
| Other expense | — | — | — | (1,024) | |||||||||||||||||||
| Net (Loss) Income Before Income Taxes | (3,065) | 262 | (7,099) | (1,607) | |||||||||||||||||||
| Income tax (expense) benefit | (2) | 6 | (2) | (2) | |||||||||||||||||||
| Net (Loss) Income | (3,067) | 268 | (7,101) | (1,609) | |||||||||||||||||||
| Less: Net income attributable to noncontrolling interests | — | 14 | 15 | 5 | |||||||||||||||||||
| Net (Loss) Income Attributable to Wheeler REIT | (3,067) | 254 | (7,116) | (1,614) | |||||||||||||||||||
| Preferred Stock dividends - undeclared | (3,251) | (3,657) | (6,592) | (7,314) | |||||||||||||||||||
| Deemed contribution related to preferred stock redemption | 651 | — | 5,040 | — | |||||||||||||||||||
| Net Loss Attributable to Wheeler REIT Common Stockholders | $ | (5,667) | $ | (3,403) | $ | (8,668) | $ | (8,928) | |||||||||||||||
| Loss per share: | |||||||||||||||||||||||
| Basic and Diluted | $ | (0.58) | $ | (0.35) | $ | (0.89) | $ | (0.92) | |||||||||||||||
| Weighted-average number of shares: | |||||||||||||||||||||||
| Basic and Diluted | 9,707,711 | 9,695,651 | 9,706,183 | 9,694,967 | |||||||||||||||||||
WHLR | Financial & Operating Data | as of 6/30/2021 unless otherwise stated | 10 | ||||
Three Months Ended June 30, | Six Months Ended June 30, | |||||||||||||||||||||||||
| 2021 | 2020 | 2021 | 2020 | |||||||||||||||||||||||
| Net (Loss) Income | $ | (3,067) | $ | 268 | $ | (7,101) | $ | (1,609) | ||||||||||||||||||
| Depreciation and amortization of real estate assets | 3,639 | 4,446 | 7,355 | 9,245 | ||||||||||||||||||||||
| (Gain) loss on disposal of properties | — | — | (176) | 26 | ||||||||||||||||||||||
| Impairment of assets held for sale | 2,200 | — | 2,200 | 600 | ||||||||||||||||||||||
| FFO | 2,772 | 4,714 | 2,278 | 8,262 | ||||||||||||||||||||||
| Preferred stock dividends - undeclared | (3,251) | (3,657) | (6,592) | (7,314) | ||||||||||||||||||||||
| Preferred stock accretion adjustments | 147 | 171 | 309 | 341 | ||||||||||||||||||||||
| FFO available to common stockholders and common unitholders | (332) | 1,228 | (4,005) | 1,289 | ||||||||||||||||||||||
| Acquisition and development costs | — | — | — | 1 | ||||||||||||||||||||||
| Capital related costs | 156 | 30 | 284 | 34 | ||||||||||||||||||||||
Other non-recurring and non-cash (income) expenses (2) | 11 | 49 | 156 | 1,073 | ||||||||||||||||||||||
| Net changes in fair value of warrants | 1,234 | — | 1,581 | — | ||||||||||||||||||||||
| Straight-line rental revenue, net straight-line expense | (376) | (401) | (590) | (406) | ||||||||||||||||||||||
| Loan cost amortization | 674 | 252 | 4,316 | 562 | ||||||||||||||||||||||
| Above (below) market lease amortization | 17 | (100) | 5 | (373) | ||||||||||||||||||||||
| Recurring capital expenditures and tenant improvement reserves | (275) | (278) | (551) | (557) | ||||||||||||||||||||||
| AFFO | $ | 1,109 | $ | 780 | $ | 1,196 | $ | 1,623 | ||||||||||||||||||
| Weighted Average Common Shares | 9,707,711 | 9,695,651 | 9,706,183 | 9,694,967 | ||||||||||||||||||||||
| Weighted Average Common Units | 220,592 | 232,652 | 222,120 | 233,336 | ||||||||||||||||||||||
| Total Common Shares and Units | 9,928,303 | 9,928,303 | 9,928,303 | 9,928,303 | ||||||||||||||||||||||
| FFO per Common Share and Common Units | $ | (0.03) | $ | 0.12 | $ | (0.40) | $ | 0.13 | ||||||||||||||||||
| AFFO per Common Share and Common Units | $ | 0.11 | $ | 0.08 | $ | 0.12 | $ | 0.16 | ||||||||||||||||||
WHLR | Financial & Operating Data | as of 6/30/2021 unless otherwise stated | 11 | ||||
| Three Months Ended June 30, | |||||||||||||||||||||||||||||||||||
| Same Store | Non-same Store | Total | |||||||||||||||||||||||||||||||||
| 2021 | 2020 | 2021 | 2020 | 2021 | 2020 | ||||||||||||||||||||||||||||||
| (in thousands, unaudited) | |||||||||||||||||||||||||||||||||||
| Net (Loss) Income | $ | (3,057) | $ | 323 | $ | (10) | $ | (55) | $ | (3,067) | $ | 268 | |||||||||||||||||||||||
| Adjustments: | |||||||||||||||||||||||||||||||||||
| Income tax expense (benefit) | 2 | (6) | — | — | 2 | (6) | |||||||||||||||||||||||||||||
| Net changes in fair value of warrants | 1,234 | — | — | — | 1,234 | — | |||||||||||||||||||||||||||||
| Interest expense | 5,215 | 4,239 | — | 34 | 5,215 | 4,273 | |||||||||||||||||||||||||||||
| Corporate general & administrative | 1,603 | 1,610 | 4 | 5 | 1,607 | 1,615 | |||||||||||||||||||||||||||||
| Impairment of assets held for sale | 2,200 | — | — | — | 2,200 | — | |||||||||||||||||||||||||||||
| Depreciation and amortization | 3,639 | 4,418 | — | 28 | 3,639 | 4,446 | |||||||||||||||||||||||||||||
| Other non-property revenue | (9) | (221) | — | — | (9) | (221) | |||||||||||||||||||||||||||||
| Property Net Operating Income | $ | 10,827 | $ | 10,363 | $ | (6) | $ | 12 | $ | 10,821 | $ | 10,375 | |||||||||||||||||||||||
| Property revenues | $ | 15,485 | $ | 14,872 | $ | (4) | $ | 76 | $ | 15,481 | $ | 14,948 | |||||||||||||||||||||||
| Property expenses | 4,658 | 4,509 | 2 | 64 | 4,660 | 4,573 | |||||||||||||||||||||||||||||
| Property Net Operating Income | $ | 10,827 | $ | 10,363 | $ | (6) | $ | 12 | $ | 10,821 | $ | 10,375 | |||||||||||||||||||||||
| Six Months Ended June 30, | |||||||||||||||||||||||||||||||||||
| Same Store | Non-same Store | Total | |||||||||||||||||||||||||||||||||
| 2021 | 2020 | 2021 | 2020 | 2021 | 2020 | ||||||||||||||||||||||||||||||
| (in thousands, unaudited) | |||||||||||||||||||||||||||||||||||
| Net Loss | $ | (6,603) | $ | (1,479) | $ | (498) | $ | (130) | $ | (7,101) | $ | (1,609) | |||||||||||||||||||||||
| Adjustments: | |||||||||||||||||||||||||||||||||||
| Income tax expense | 2 | 2 | — | — | 2 | 2 | |||||||||||||||||||||||||||||
| Other expense | — | 1,024 | — | — | — | 1,024 | |||||||||||||||||||||||||||||
| Other income | (552) | — | — | — | (552) | — | |||||||||||||||||||||||||||||
| Net changes in fair value of warrants | 1,581 | — | — | — | 1,581 | — | |||||||||||||||||||||||||||||
| Interest expense | 13,468 | 8,605 | 708 | 67 | 14,176 | 8,672 | |||||||||||||||||||||||||||||
| (Gain) loss on disposal of properties | — | — | (176) | 26 | (176) | 26 | |||||||||||||||||||||||||||||
| Corporate general & administrative | 3,182 | 3,478 | 7 | 9 | 3,189 | 3,487 | |||||||||||||||||||||||||||||
| Impairment of assets held for sale | 2,200 | 600 | — | — | 2,200 | 600 | |||||||||||||||||||||||||||||
| Depreciation and amortization | 7,355 | 9,185 | — | 60 | 7,355 | 9,245 | |||||||||||||||||||||||||||||
| Other non-property revenue | (22) | (243) | — | — | (22) | (243) | |||||||||||||||||||||||||||||
| Property Net Operating Income | $ | 20,611 | $ | 21,172 | $ | 41 | $ | 32 | $ | 20,652 | $ | 21,204 | |||||||||||||||||||||||
| Property revenues | $ | 30,092 | $ | 30,321 | $ | 104 | $ | 179 | $ | 30,196 | $ | 30,500 | |||||||||||||||||||||||
| Property expenses | 9,481 | 9,149 | 63 | 147 | 9,544 | 9,296 | |||||||||||||||||||||||||||||
| Property Net Operating Income | $ | 20,611 | $ | 21,172 | $ | 41 | $ | 32 | $ | 20,652 | $ | 21,204 | |||||||||||||||||||||||
WHLR | Financial & Operating Data | as of 6/30/2021 unless otherwise stated | 12 | ||||
| Three Months Ended June 30, | Six Months Ended June 30, | |||||||||||||||||||||||||
| 2021 | 2020 | 2021 | 2020 | |||||||||||||||||||||||
Net (Loss) Income | $ | (3,067) | $ | 268 | $ | (7,101) | $ | (1,609) | ||||||||||||||||||
Add back: | Depreciation and amortization (1) | 3,656 | 4,346 | 7,360 | 8,872 | |||||||||||||||||||||
Interest Expense (2) | 5,215 | 4,273 | 14,176 | 8,672 | ||||||||||||||||||||||
Income tax (benefit) expense | 2 | (6) | 2 | 2 | ||||||||||||||||||||||
EBITDA | 5,806 | 8,881 | 14,437 | 15,937 | ||||||||||||||||||||||
| Adjustments for items affecting comparability: | ||||||||||||||||||||||||||
Acquisition and development costs | — | — | — | 1 | ||||||||||||||||||||||
Capital related costs | 156 | 30 | 284 | 34 | ||||||||||||||||||||||
| Change in fair value of warrants | 1,234 | — | 1,581 | — | ||||||||||||||||||||||
Other non-recurring and non-cash expenses (3) | — | 49 | (552) | 1,073 | ||||||||||||||||||||||
Impairment of assets held for sale | 2,200 | — | 2,200 | 600 | ||||||||||||||||||||||
(Gain) loss on disposal of properties | — | — | (176) | 26 | ||||||||||||||||||||||
Adjusted EBITDA | $ | 9,396 | $ | 8,960 | $ | 17,774 | $ | 17,671 | ||||||||||||||||||
WHLR | Financial & Operating Data | as of 6/30/2021 unless otherwise stated | 13 | ||||
| Property/Description | Monthly Payment | Interest Rate | Maturity | June 30, 2021 | December 31, 2020 | |||||||||||||||||||||||||||
| Columbia Fire Station | Interest only | 14.00 | % | July 2021 | $ | 3,363 | $ | 3,893 | ||||||||||||||||||||||||
First National Bank (7) (8) | $ | 24,656 | LIBOR + 350 basis points | September 2021 | 918 | 1,045 | ||||||||||||||||||||||||||
Lumber River (8) | $ | 10,723 | LIBOR + 350 basis points | October 2021 | 1,332 | 1,367 | ||||||||||||||||||||||||||
Rivergate (8) | $ | 112,357 | Prime Rate -25 basis points | October 2021 | 20,853 | 21,164 | ||||||||||||||||||||||||||
| Litchfield Market Village | $ | 46,057 | 5.50 | % | November 2022 | 7,383 | 7,418 | |||||||||||||||||||||||||
| Twin City Commons | $ | 17,827 | 4.86 | % | January 2023 | 2,879 | 2,915 | |||||||||||||||||||||||||
| Walnut Hill Plaza | $ | 26,850 | 5.50 | % | March 2023 | 3,217 | 3,287 | |||||||||||||||||||||||||
Powerscourt Financing Agreement (6) | Interest only | 13.50 | % | March 2023 | — | 25,000 | ||||||||||||||||||||||||||
| New Market | $ | 48,747 | 5.65 | % | June 2023 | 6,401 | 6,508 | |||||||||||||||||||||||||
Benefit Street Note (3) | $ | 53,185 | 5.71 | % | June 2023 | 7,031 | 7,145 | |||||||||||||||||||||||||
Deutsche Bank Note (2) | $ | 33,340 | 5.71 | % | July 2023 | 5,528 | 5,567 | |||||||||||||||||||||||||
| JANAF | $ | 333,159 | 4.49 | % | July 2023 | 47,977 | 48,875 | |||||||||||||||||||||||||
| Tampa Festival | $ | 50,797 | 5.56 | % | September 2023 | 7,837 | 7,920 | |||||||||||||||||||||||||
| Forrest Gallery | $ | 50,973 | 5.40 | % | September 2023 | 8,144 | 8,226 | |||||||||||||||||||||||||
South Carolina Food Lions Note (5) | $ | 68,320 | 5.25 | % | January 2024 | 11,363 | 11,473 | |||||||||||||||||||||||||
| JANAF Bravo | $ | 35,076 | 5.00 | % | May 2024 | 5,995 | 6,263 | |||||||||||||||||||||||||
| Cypress Shopping Center | $ | 34,360 | 4.70 | % | July 2024 | 6,112 | 6,163 | |||||||||||||||||||||||||
| Port Crossing | $ | 34,788 | 4.84 | % | August 2024 | 5,844 | 5,909 | |||||||||||||||||||||||||
| Freeway Junction | $ | 41,798 | 4.60 | % | September 2024 | 7,507 | 7,582 | |||||||||||||||||||||||||
| Harrodsburg Marketplace | $ | 19,112 | 4.55 | % | September 2024 | 3,305 | 3,343 | |||||||||||||||||||||||||
| Bryan Station | $ | 23,489 | 4.52 | % | November 2024 | 4,269 | 4,312 | |||||||||||||||||||||||||
| Crockett Square | Interest only | 4.47 | % | December 2024 | 6,338 | 6,338 | ||||||||||||||||||||||||||
| Pierpont Centre | $ | 39,435 | 4.15 | % | February 2025 | 7,931 | 8,001 | |||||||||||||||||||||||||
| Shoppes at Myrtle Park | $ | 33,180 | 4.45 | % | February 2025 | 5,825 | 5,892 | |||||||||||||||||||||||||
| Folly Road | $ | 41,482 | 4.65 | % | March 2025 | 7,143 | 7,223 | |||||||||||||||||||||||||
| Alex City Marketplace | Interest only | 3.95 | % | April 2025 | 5,750 | 5,750 | ||||||||||||||||||||||||||
| Butler Square | Interest only | 3.90 | % | May 2025 | 5,640 | 5,640 | ||||||||||||||||||||||||||
| Brook Run Shopping Center | Interest only | 4.08 | % | June 2025 | 10,950 | 10,950 | ||||||||||||||||||||||||||
| Beaver Ruin Village I and II | Interest only | 4.73 | % | July 2025 | 9,400 | 9,400 | ||||||||||||||||||||||||||
| Sunshine Shopping Plaza | Interest only | 4.57 | % | August 2025 | 5,900 | 5,900 | ||||||||||||||||||||||||||
Barnett Portfolio (4) | Interest only | 4.30 | % | September 2025 | 8,770 | 8,770 | ||||||||||||||||||||||||||
| Fort Howard Shopping Center | Interest only | 4.57 | % | October 2025 | 7,100 | 7,100 | ||||||||||||||||||||||||||
| Conyers Crossing | Interest only | 4.67 | % | October 2025 | 5,960 | 5,960 | ||||||||||||||||||||||||||
| Grove Park Shopping Center | Interest only | 4.52 | % | October 2025 | 3,800 | 3,800 | ||||||||||||||||||||||||||
| Parkway Plaza | Interest only | 4.57 | % | October 2025 | 3,500 | 3,500 | ||||||||||||||||||||||||||
| Winslow Plaza | $ | 24,295 | 4.82 | % | December 2025 | 4,518 | 4,553 | |||||||||||||||||||||||||
| JANAF BJ's | $ | 29,964 | 4.95 | % | January 2026 | 4,785 | 4,844 | |||||||||||||||||||||||||
| Tuckernuck | $ | 32,202 | 5.00 | % | March 2026 | 5,118 | 5,193 | |||||||||||||||||||||||||
Wilmington Financing Agreement (6) | Interest only | 8.00 | % | March 2026 | 35,000 | — | ||||||||||||||||||||||||||
| Chesapeake Square | $ | 23,857 | 4.70 | % | August 2026 | 4,238 | 4,279 | |||||||||||||||||||||||||
| Berkley/Sangaree/Tri-County | Interest only | 4.78 | % | December 2026 | 6,176 | 9,400 | ||||||||||||||||||||||||||
| Riverbridge | Interest only | 4.48 | % | December 2026 | 4,000 | 4,000 | ||||||||||||||||||||||||||
| Franklin Village | $ | 45,336 | 4.93 | % | January 2027 | 8,341 | 8,404 | |||||||||||||||||||||||||
| Village of Martinsville | $ | 89,664 | 4.28 | % | July 2029 | 15,785 | 15,979 | |||||||||||||||||||||||||
| Laburnum Square | Interest only | 4.28 | % | September 2029 | 7,665 | 7,665 | ||||||||||||||||||||||||||
Total Principal Balance (1) | 356,891 | 353,916 | ||||||||||||||||||||||||||||||
Unamortized debt issuance cost (1) | (10,955) | (6,812) | ||||||||||||||||||||||||||||||
| Total Loans Payable, including assets held for sale | 345,936 | 347,104 | ||||||||||||||||||||||||||||||
| Less loans payable on assets held for sale, net loan amortization costs | 10,681 | 12,838 | ||||||||||||||||||||||||||||||
| Total Loans Payable, net | $ | 335,255 | $ | 334,266 | ||||||||||||||||||||||||||||
WHLR | Financial & Operating Data | as of 6/30/2021 unless otherwise stated | 14 | ||||
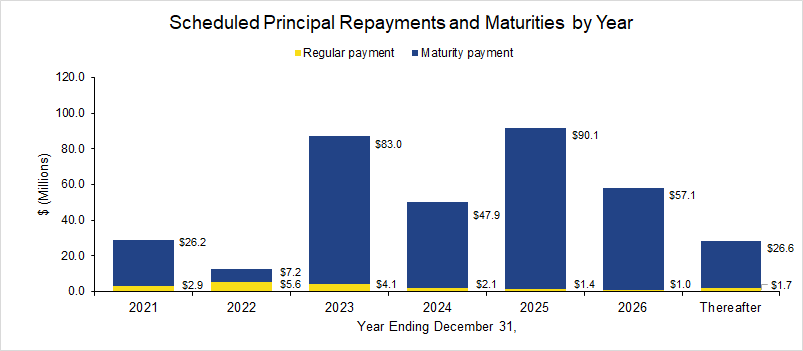
| Scheduled principal repayments and maturities by year | Amount | % Total Principal Payments and Maturities | ||||||||||||
| For the remaining six months ending December 31, 2021 | $ | 29,124 | 8.16 | % | ||||||||||
| December 31, 2022 | 12,798 | 3.59 | % | |||||||||||
| December 31, 2023 | 87,099 | 24.40 | % | |||||||||||
| December 31, 2024 | 50,044 | 14.02 | % | |||||||||||
| December 31, 2025 | 91,530 | 25.65 | % | |||||||||||
| December 31, 2026 | 58,026 | 16.26 | % | |||||||||||
| Thereafter | 28,270 | 7.92 | % | |||||||||||
| Total principal repayments and debt maturities | $ | 356,891 | 100.00 | % | ||||||||||
WHLR | Financial & Operating Data | as of 6/30/2021 unless otherwise stated | 15 | ||||
Property | Location | Number of Tenants (1) | Total Leasable Square Feet | Percentage Leased (1) | Percentage Occupied | Total SF Occupied | Annualized Base Rent (in 000's) (2) | Annualized Base Rent per Occupied Sq. Foot | ||||||||||||||||||||||||
| Alex City Marketplace | Alexander City, AL | 18 | 151,843 | 97.6 | % | 97.6 | % | 148,243 | $ | 1,149 | $ | 7.75 | ||||||||||||||||||||
| Amscot Building | Tampa, FL | 1 | 2,500 | 100.0 | % | 100.0 | % | 2,500 | 83 | 33.00 | ||||||||||||||||||||||
| Beaver Ruin Village | Lilburn, GA | 29 | 74,038 | 95.2 | % | 95.2 | % | 70,448 | 1,218 | 17.28 | ||||||||||||||||||||||
| Beaver Ruin Village II | Lilburn, GA | 4 | 34,925 | 100.0 | % | 100.0 | % | 34,925 | 457 | 13.08 | ||||||||||||||||||||||
| Brook Run Shopping Center | Richmond, VA | 19 | 147,738 | 87.0 | % | 87.0 | % | 128,495 | 887 | 6.91 | ||||||||||||||||||||||
| Brook Run Properties (3) | Richmond, VA | — | — | — | % | — | % | — | — | — | ||||||||||||||||||||||
| Bryan Station | Lexington, KY | 10 | 54,277 | 100.0 | % | 100.0 | % | 54,277 | 592 | 10.91 | ||||||||||||||||||||||
| Butler Square | Mauldin, SC | 16 | 82,400 | 98.2 | % | 98.2 | % | 80,950 | 849 | 10.49 | ||||||||||||||||||||||
| Cardinal Plaza | Henderson, NC | 8 | 50,000 | 97.0 | % | 97.0 | % | 48,500 | 482 | 9.95 | ||||||||||||||||||||||
| Chesapeake Square | Onley, VA | 12 | 108,982 | 96.5 | % | 96.5 | % | 105,182 | 794 | 7.55 | ||||||||||||||||||||||
| Clover Plaza | Clover, SC | 10 | 45,575 | 100.0 | % | 100.0 | % | 45,575 | 376 | 8.25 | ||||||||||||||||||||||
| Columbia Fire Station | Columbia, SC | 1 | 21,273 | 14.4 | % | 14.4 | % | 3,063 | 81 | 26.60 | ||||||||||||||||||||||
| Courtland Commons (3) | Courtland, VA | — | — | — | % | — | % | — | — | — | ||||||||||||||||||||||
| Conyers Crossing | Conyers, GA | 13 | 170,475 | 98.0 | % | 98.0 | % | 166,975 | 895 | 5.36 | ||||||||||||||||||||||
| Crockett Square | Morristown, TN | 4 | 107,122 | 100.0 | % | 100.0 | % | 107,122 | 970 | 9.06 | ||||||||||||||||||||||
| Cypress Shopping Center | Boiling Springs, SC | 17 | 80,435 | 41.2 | % | 41.2 | % | 33,175 | 444 | 13.39 | ||||||||||||||||||||||
| Darien Shopping Center | Darien, GA | 1 | 26,001 | 100.0 | % | 100.0 | % | 26,001 | 140 | 5.38 | ||||||||||||||||||||||
| Devine Street | Columbia, SC | 2 | 38,464 | 100.0 | % | 100.0 | % | 38,464 | 319 | 8.28 | ||||||||||||||||||||||
| Edenton Commons (3) | Edenton, NC | — | — | — | % | — | % | — | — | — | ||||||||||||||||||||||
| Folly Road | Charleston, SC | 5 | 47,794 | 100.0 | % | 100.0 | % | 47,794 | 731 | 15.29 | ||||||||||||||||||||||
| Forrest Gallery | Tullahoma, TN | 26 | 214,451 | 80.3 | % | 80.3 | % | 172,124 | 1,243 | 7.22 | ||||||||||||||||||||||
| Fort Howard Shopping Center | Rincon, GA | 19 | 113,652 | 95.1 | % | 95.1 | % | 108,120 | 1,038 | 9.60 | ||||||||||||||||||||||
| Freeway Junction | Stockbridge, GA | 18 | 156,834 | 90.0 | % | 90.0 | % | 141,104 | 1,259 | 8.92 | ||||||||||||||||||||||
| Franklin Village | Kittanning, PA | 26 | 151,821 | 98.7 | % | 98.7 | % | 149,821 | 1,288 | 8.60 | ||||||||||||||||||||||
| Franklinton Square | Franklinton, NC | 15 | 65,366 | 100.0 | % | 100.0 | % | 65,366 | 591 | 9.03 | ||||||||||||||||||||||
| Georgetown | Georgetown, SC | 2 | 29,572 | 100.0 | % | 100.0 | % | 29,572 | 267 | 9.04 | ||||||||||||||||||||||
| Grove Park | Orangeburg, SC | 14 | 93,265 | 99.4 | % | 99.4 | % | 92,741 | 734 | 7.92 | ||||||||||||||||||||||
| Harbor Point (3) | Grove, OK | — | — | — | % | — | % | — | — | — | ||||||||||||||||||||||
| Harrodsburg Marketplace | Harrodsburg, KY | 7 | 60,048 | 88.0 | % | 88.0 | % | 52,848 | 437 | 8.28 | ||||||||||||||||||||||
| JANAF (4) | Norfolk, VA | 110 | 798,086 | 91.6 | % | 89.5 | % | 714,646 | 8,365 | 11.70 | ||||||||||||||||||||||
| Laburnum Square | Richmond, VA | 19 | 109,405 | 95.3 | % | 95.3 | % | 104,305 | 947 | 9.08 | ||||||||||||||||||||||
| Ladson Crossing | Ladson, SC | 15 | 52,607 | 100.0 | % | 100.0 | % | 52,607 | 508 | 9.66 | ||||||||||||||||||||||
| LaGrange Marketplace | LaGrange, GA | 13 | 76,594 | 96.9 | % | 96.9 | % | 74,194 | 432 | 5.82 | ||||||||||||||||||||||
| Lake Greenwood Crossing | Greenwood, SC | 7 | 47,546 | 91.7 | % | 90.1 | % | 42,818 | 351 | 8.19 | ||||||||||||||||||||||
| Lake Murray | Lexington, SC | 5 | 39,218 | 100.0 | % | 100.0 | % | 39,218 | 254 | 6.47 | ||||||||||||||||||||||
| Litchfield Market Village | Pawleys Island, SC | 20 | 86,740 | 88.7 | % | 88.7 | % | 76,902 | 921 | 11.97 | ||||||||||||||||||||||
| Lumber River Village | Lumberton, NC | 11 | 66,781 | 98.2 | % | 98.2 | % | 65,581 | 455 | 6.94 | ||||||||||||||||||||||
| Moncks Corner | Moncks Corner, SC | 1 | 26,800 | 100.0 | % | 100.0 | % | 26,800 | 323 | 12.07 | ||||||||||||||||||||||
| Nashville Commons | Nashville, NC | 12 | 56,100 | 100.0 | % | 100.0 | % | 56,100 | 625 | 11.13 | ||||||||||||||||||||||
| New Market Crossing | Mt. Airy, NC | 10 | 117,076 | 88.3 | % | 88.3 | % | 103,338 | 915 | 8.85 | ||||||||||||||||||||||
| Parkway Plaza | Brunswick, GA | 4 | 52,365 | 81.7 | % | 81.7 | % | 42,785 | 352 | 8.23 | ||||||||||||||||||||||
| Pierpont Centre | Morgantown, WV | 16 | 111,162 | 89.8 | % | 89.8 | % | 99,856 | 939 | 9.40 | ||||||||||||||||||||||
| Port Crossing | Harrisonburg, VA | 8 | 65,365 | 100.0 | % | 97.9 | % | 64,000 | 854 | 13.34 | ||||||||||||||||||||||
| Ridgeland | Ridgeland, SC | 1 | 20,029 | 100.0 | % | 100.0 | % | 20,029 | 140 | 7.00 | ||||||||||||||||||||||
| Riverbridge Shopping Center | Carrollton, GA | 10 | 91,188 | 94.7 | % | 94.7 | % | 86,388 | 691 | 8.00 | ||||||||||||||||||||||
| Rivergate Shopping Center | Macon, GA | 29 | 201,680 | 87.5 | % | 86.3 | % | 174,095 | 2,552 | 14.66 | ||||||||||||||||||||||
| Sangaree Plaza | Summerville, SC | 8 | 66,948 | 87.4 | % | 87.4 | % | 58,498 | 602 | 10.29 | ||||||||||||||||||||||
| Shoppes at Myrtle Park | Bluffton, SC | 13 | 56,601 | 99.3 | % | 99.3 | % | 56,181 | 610 | 10.86 | ||||||||||||||||||||||
| South Lake | Lexington, SC | 7 | 44,318 | 93.9 | % | 19.0 | % | 8,400 | 110 | 13.05 | ||||||||||||||||||||||
| South Park | Mullins, SC | 4 | 60,734 | 96.9 | % | 96.9 | % | 58,834 | 381 | 6.48 | ||||||||||||||||||||||
| South Square | Lancaster, SC | 6 | 44,350 | 81.0 | % | 81.0 | % | 35,900 | 301 | 8.37 | ||||||||||||||||||||||
| St. George Plaza | St. George, SC | 7 | 59,279 | 96.2 | % | 96.2 | % | 56,999 | 396 | 6.95 | ||||||||||||||||||||||
| Sunshine Plaza | Lehigh Acres, FL | 23 | 111,189 | 100.0 | % | 100.0 | % | 111,189 | 1,082 | 9.74 | ||||||||||||||||||||||
| Surrey Plaza | Hawkinsville, GA | 3 | 42,680 | 96.5 | % | 96.5 | % | 41,180 | 247 | 6.00 | ||||||||||||||||||||||
WHLR | Financial & Operating Data | as of 6/30/2021 unless otherwise stated | 16 | ||||
Property | Location | Number of Tenants (1) | Total Leasable Square Feet | Percentage Leased (1) | Percentage Occupied | Total SF Occupied | Annualized Base Rent (in 000's) (2) | Annualized Base Rent per Occupied Sq. Foot | ||||||||||||||||||||||||
| Tampa Festival | Tampa, FL | 19 | 137,987 | 97.2 | % | 64.6 | % | 89,166 | $ | 876 | $ | 9.82 | ||||||||||||||||||||
| Tri-County Plaza | Royston, GA | 7 | 67,577 | 94.1 | % | 94.1 | % | 63,577 | 409 | 6.44 | ||||||||||||||||||||||
| Tuckernuck | Richmond, VA | 11 | 93,624 | 92.4 | % | 85.3 | % | 79,839 | 819 | 10.26 | ||||||||||||||||||||||
| Tulls Creek (3) | Moyock, NC | — | — | — | % | — | % | — | — | — | ||||||||||||||||||||||
| Twin City Commons | Batesburg-Leesville, SC | 5 | 47,680 | 100.0 | % | 100.0 | % | 47,680 | 478 | 10.03 | ||||||||||||||||||||||
| Village of Martinsville | Martinsville, VA | 20 | 290,902 | 96.6 | % | 96.6 | % | 280,946 | 2,172 | 7.73 | ||||||||||||||||||||||
| Walnut Hill Plaza | Petersburg, VA | 6 | 87,239 | 38.1 | % | 38.1 | % | 33,225 | 279 | 8.41 | ||||||||||||||||||||||
| Waterway Plaza | Little River, SC | 10 | 49,750 | 100.0 | % | 100.0 | % | 49,750 | 499 | 10.02 | ||||||||||||||||||||||
| Westland Square | West Columbia, SC | 9 | 62,735 | 82.6 | % | 82.6 | % | 51,785 | 437 | 8.44 | ||||||||||||||||||||||
| Winslow Plaza | Sicklerville, NJ | 18 | 40,695 | 100.0 | % | 100.0 | % | 40,695 | 639 | 15.68 | ||||||||||||||||||||||
Total Portfolio | 764 | 5,511,881 | 91.9 | % | 90.0 | % | 4,960,891 | $ | 47,285 | $ | 9.53 | |||||||||||||||||||||
WHLR | Financial & Operating Data | as of 6/30/2021 unless otherwise stated | 17 | ||||
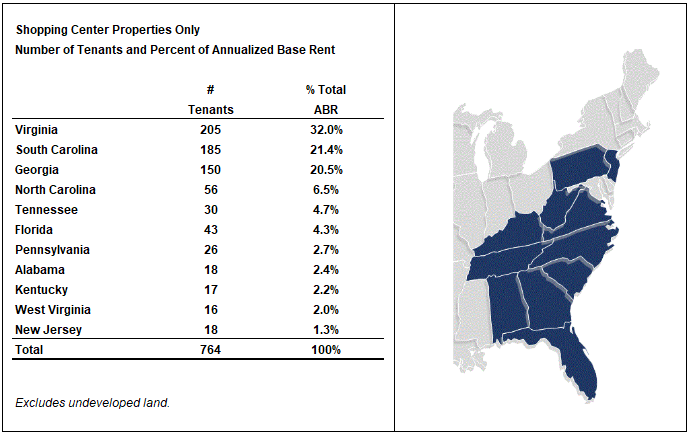
| Tenants | Annualized Base Rent ($ in 000s) | % of Total Annualized Base Rent | Total Occupied Square Feet | Percent Total Leasable Square Foot | Base Rent Per Occupied Square Foot | ||||||||||||||||||||||||||||||
| 1. | Food Lion | $ | 4,394 | 9.29 | % | 551,469 | 10.01 | % | $ | 7.97 | |||||||||||||||||||||||||
Kroger Co.(1) | 1,948 | 4.12 | % | 226,010 | 4.10 | % | 8.62 | ||||||||||||||||||||||||||||
| 2. | Piggly Wiggly | 1,488 | 3.15 | % | 202,968 | 3.68 | % | 7.33 | |||||||||||||||||||||||||||
| 3. | Lowes Foods (2) | 1,181 | 2.50 | % | 130,036 | 2.36 | % | 9.08 | |||||||||||||||||||||||||||
| 4. | Winn Dixie | 887 | 1.88 | % | 133,575 | 2.42 | % | 6.64 | |||||||||||||||||||||||||||
| 5. | Planet Fitness | 837 | 1.77 | % | 100,427 | 1.82 | % | 8.33 | |||||||||||||||||||||||||||
| 6. | Hobby Lobby | 717 | 1.52 | % | 114,298 | 2.07 | % | 6.27 | |||||||||||||||||||||||||||
| 7. | Big Lots | 679 | 1.44 | % | 105,674 | 1.92 | % | 6.43 | |||||||||||||||||||||||||||
| 8. | BJ's Wholesale Club | 651 | 1.38 | % | 147,400 | 2.67 | % | 4.42 | |||||||||||||||||||||||||||
| 10. | Dollar Tree | 593 | 1.25 | % | 70,379 | 1.28 | % | 8.43 | |||||||||||||||||||||||||||
| $ | 13,375 | 28.30 | % | 1,782,236 | 32.33 | % | $ | 7.50 | |||||||||||||||||||||||||||
| Lease Expiration Period | Number of Expiring Leases | Total Expiring Square Footage | % of Total Expiring Square Footage | % of Total Occupied Square Footage Expiring | Expiring Annualized Base Rent (in 000s) | % of Total Annualized Base Rent | Expiring Base Rent Per Occupied Square Foot | |||||||||||||||||||||||||||||||||||||
| Available | — | 550,990 | 10.00 | % | — | % | $ | — | — | % | $ | — | ||||||||||||||||||||||||||||||||
| Month-to-Month | 11 | 19,144 | 0.35 | % | 0.39 | % | 267 | 0.56 | % | 13.95 | ||||||||||||||||||||||||||||||||||
| 2021 | 36 | 138,652 | 2.52 | % | 2.79 | % | 1,162 | 2.46 | % | 8.38 | ||||||||||||||||||||||||||||||||||
| 2022 | 133 | 512,582 | 9.30 | % | 10.33 | % | 5,282 | 11.17 | % | 10.30 | ||||||||||||||||||||||||||||||||||
| 2023 | 131 | 863,789 | 15.67 | % | 17.41 | % | 7,492 | 15.84 | % | 8.67 | ||||||||||||||||||||||||||||||||||
| 2024 | 129 | 698,565 | 12.67 | % | 14.08 | % | 6,930 | 14.66 | % | 9.92 | ||||||||||||||||||||||||||||||||||
| 2025 | 104 | 805,941 | 14.62 | % | 16.25 | % | 7,875 | 16.65 | % | 9.77 | ||||||||||||||||||||||||||||||||||
| 2026 | 97 | 773,410 | 14.03 | % | 15.59 | % | 7,207 | 15.24 | % | 9.32 | ||||||||||||||||||||||||||||||||||
| 2027 | 34 | 224,681 | 4.08 | % | 4.53 | % | 2,654 | 5.61 | % | 11.81 | ||||||||||||||||||||||||||||||||||
| 2028 | 21 | 331,609 | 6.02 | % | 6.68 | % | 2,344 | 4.96 | % | 7.07 | ||||||||||||||||||||||||||||||||||
| 2029 | 17 | 121,579 | 2.21 | % | 2.45 | % | 1,243 | 2.63 | % | 10.22 | ||||||||||||||||||||||||||||||||||
| 2030 and thereafter | 51 | 470,939 | 8.53 | % | 9.50 | % | 4,829 | 10.22 | % | 10.25 | ||||||||||||||||||||||||||||||||||
| Total | 764 | 5,511,881 | 100.00 | % | 100.00 | % | $ | 47,285 | 100.00 | % | $ | 9.53 | ||||||||||||||||||||||||||||||||
WHLR | Financial & Operating Data | as of 6/30/2021 unless otherwise stated | 18 | ||||
| No Option | Option | ||||||||||||||||||||||||||||||||||
| Lease Expiration Six and Twelve Month Periods Ending December 31, | Number of Expiring Leases | Expiring Occupied Square Footage | Expiring Annualized Based Rent (in 000s) | % of Total Annualized Base Rent | Expiring Base Rent per Square Foot | Number of Expiring Leases | Expiring Occupied Square Footage | Expiring Annualized Based Rent (in 000s) | % of Total Annualized Base Rent | Expiring Base Rent per Square Foot | |||||||||||||||||||||||||
| Available | — | 148,758 | $ | — | — | % | $ | — | — | — | $ | — | — | % | $ | — | |||||||||||||||||||
| Month-to-Month | — | — | — | — | % | — | — | — | — | — | % | — | |||||||||||||||||||||||
2021 (2) | 1 | 58,473 | — | — | % | — | — | — | — | — | % | — | |||||||||||||||||||||||
| 2022 | — | — | — | — | % | — | 4 | 152,881 | 1,153 | 6.31 | % | 7.54 | |||||||||||||||||||||||
| 2023 | 2 | 43,392 | 329 | 19.22 | % | 7.58 | 15 | 523,775 | 3,349 | 18.32 | % | 6.39 | |||||||||||||||||||||||
| 2024 | 1 | 32,000 | 125 | 7.30 | % | 3.91 | 8 | 318,759 | 2,231 | 12.20 | % | 7.00 | |||||||||||||||||||||||
| 2025 | 2 | 84,633 | 619 | 36.16 | % | 7.31 | 12 | 472,936 | 3,777 | 20.66 | % | 7.99 | |||||||||||||||||||||||
| 2026 | 1 | 20,152 | 97 | 5.67 | % | 4.81 | 13 | 435,435 | 3,399 | 18.59 | % | 7.81 | |||||||||||||||||||||||
| 2027 | 1 | 20,050 | 170 | 9.93 | % | 8.48 | 2 | 57,345 | 447 | 2.44 | % | 7.79 | |||||||||||||||||||||||
| 2028 | — | — | % | — | 7 | 280,841 | 1,637 | 8.95 | % | 5.83 | |||||||||||||||||||||||||
| 2029 | 1 | 21,213 | 317 | 18.52 | % | 14.94 | 2 | 45,700 | 307 | 1.68 | % | 6.72 | |||||||||||||||||||||||
| 2030+ | 1 | 20,858 | 55 | 3.20 | % | 2.64 | 7 | 321,576 | 1,985 | 10.85 | % | 6.17 | |||||||||||||||||||||||
| Total | 10 | 449,529 | $ | 1,712 | 100.00 | % | $ | 5.69 | 70 | 2,609,248 | $ | 18,285 | 100.00 | % | $ | 7.01 | |||||||||||||||||||
| No Option | Option | ||||||||||||||||||||||||||||||||||
| Lease Expiration Six and Twelve Month Periods Ending December 31, | Number of Expiring Leases | Expiring Occupied Square Footage | Expiring Annualized Based Rent (in 000s) | % of Total Annualized Base Rent | Expiring Base Rent per Square Foot | Number of Expiring Leases | Expiring Occupied Square Footage | Expiring Annualized Based Rent (in 000s) | % of Total Annualized Base Rent | Expiring Base Rent per Square Foot | |||||||||||||||||||||||||
| Available | — | 402,232 | $ | — | — | % | $ | — | — | — | $ | — | — | % | $ | — | |||||||||||||||||||
| Month-to-Month | 10 | 16,244 | 237 | 1.92 | % | 14.59 | 1 | 2,900 | 30 | 0.20 | % | 10.34 | |||||||||||||||||||||||
| 2021 | 25 | 50,054 | 645 | 5.22 | % | 12.89 | 10 | 30,125 | 517 | 3.46 | % | 17.16 | |||||||||||||||||||||||
| 2022 | 72 | 170,207 | 1,931 | 15.62 | % | 11.35 | 57 | 189,494 | 2,198 | 14.73 | % | 11.60 | |||||||||||||||||||||||
| 2023 | 65 | 134,318 | 1,688 | 13.65 | % | 12.57 | 49 | 162,304 | 2,126 | 14.24 | % | 13.10 | |||||||||||||||||||||||
| 2024 | 74 | 174,590 | 2,239 | 18.11 | % | 12.82 | 46 | 173,216 | 2,335 | 15.64 | % | 13.48 | |||||||||||||||||||||||
| 2025 | 53 | 117,658 | 1,650 | 13.35 | % | 14.02 | 37 | 130,714 | 1,829 | 12.25 | % | 13.99 | |||||||||||||||||||||||
| 2026 | 48 | 144,687 | 1,769 | 14.31 | % | 12.23 | 35 | 173,136 | 1,942 | 13.01 | % | 11.22 | |||||||||||||||||||||||
| 2027 | 10 | 30,987 | 535 | 4.33 | % | 17.27 | 21 | 116,299 | 1,502 | 10.06 | % | 12.91 | |||||||||||||||||||||||
| 2028 | 10 | 31,652 | 495 | 4.00 | % | 15.64 | 4 | 19,116 | 212 | 1.42 | % | 11.09 | |||||||||||||||||||||||
| 2029 | 7 | 23,850 | 241 | 1.95 | % | 10.10 | 7 | 30,816 | 378 | 2.53 | % | 12.27 | |||||||||||||||||||||||
| 2030+ | 18 | 40,981 | 932 | 7.54 | % | 22.74 | 25 | 87,524 | 1,857 | 12.46 | % | 21.22 | |||||||||||||||||||||||
| Total | 392 | 1,337,460 | $ | 12,362 | 100.00 | % | $ | 13.22 | 292 | 1,115,644 | $ | 14,926 | 100.00 | % | $ | 13.38 | |||||||||||||||||||
WHLR | Financial & Operating Data | as of 6/30/2021 unless otherwise stated | 19 | ||||
| Three Months Ended June 30, | Six Months Ended June 30, | ||||||||||||||||||||||
| 2021 | 2020 | 2021 | 2020 | ||||||||||||||||||||
Renewals(1): | |||||||||||||||||||||||
| Leases renewed with rate increase (sq feet) | 34,629 | 255,380 | 179,802 | 392,979 | |||||||||||||||||||
| Leases renewed with rate decrease (sq feet) | 29,550 | 8,755 | 54,423 | 35,735 | |||||||||||||||||||
| Leases renewed with no rate change (sq feet) | 42,394 | 43,628 | 60,353 | 64,206 | |||||||||||||||||||
| Total leases renewed (sq feet) | 106,573 | 307,763 | 294,578 | 492,920 | |||||||||||||||||||
| Leases renewed with rate increase (count) | 15 | 53 | 42 | 83 | |||||||||||||||||||
| Leases renewed with rate decrease (count) | 4 | 6 | 9 | 11 | |||||||||||||||||||
| Leases renewed with no rate change (count) | 7 | 12 | 15 | 18 | |||||||||||||||||||
| Total leases renewed (count) | 26 | 71 | 66 | 112 | |||||||||||||||||||
| Option exercised (count) | 4 | 4 | 8 | 9 | |||||||||||||||||||
| Weighted average on rate increases (per sq foot) | $ | 0.91 | $ | 0.62 | $ | 0.73 | $ | 1.05 | |||||||||||||||
| Weighted average on rate decreases (per sq foot) | $ | (3.09) | $ | (0.40) | $ | (2.20) | $ | (1.76) | |||||||||||||||
| Weighted average rate on all renewals (per sq foot) | $ | (0.56) | $ | 0.50 | $ | 0.04 | $ | 0.71 | |||||||||||||||
| Weighted average change over prior rates | (5.37) | % | 4.92 | % | 0.39 | % | 6.81 | % | |||||||||||||||
New Leases(1) (2): | |||||||||||||||||||||||
| New leases (sq feet) | 113,865 | 81,780 | 226,459 | 109,402 | |||||||||||||||||||
| New leases (count) | 18 | 16 | 37 | 30 | |||||||||||||||||||
| Weighted average rate (per sq foot) | $ | 8.30 | $ | 9.46 | $ | 8.27 | $ | 11.00 | |||||||||||||||
| Gross Leasable Area ("GLA") expiring during the next 6 months, including month-to-month leases | 2.87 | % | 6.00 | % | 2.87 | % | 6.00 | % | |||||||||||||||
WHLR | Financial & Operating Data | as of 6/30/2021 unless otherwise stated | 20 | ||||
WHLR | Financial & Operating Data | as of 6/30/2021 unless otherwise stated | 21 | ||||
WHLR | Financial & Operating Data | as of 6/30/2021 unless otherwise stated | 22 | ||||