
| Table of Contents | |||||
| Page | |||||
| Company Overview | |||||
| Financial and Portfolio Overview | |||||
| Financial and Operating Results | |||||
| Financial Summary | |||||
| Consolidated Balance Sheets | |||||
| Consolidated Statements of Operations | |||||
| Reconciliation of Non-GAAP Measures | |||||
| Debt Summary | |||||
| Portfolio Summary | |||||
| Property Summary | |||||
| Top Ten Tenants by Annualized Base Rent and Lease Expiration Schedule | |||||
| Leasing Summary | |||||
| Definitions | |||||
WHLR | Financial & Operating Data | 2 | ||||
| Corporate Headquarters | ||||||||
| Wheeler Real Estate Investment Trust, Inc. | ||||||||
| Riversedge North | ||||||||
| 2529 Virginia Beach Boulevard Virginia Beach, VA 23452 | ||||||||
| Phone: (757) 627-9088 Toll Free: (866) 203-4864 | ||||||||
| Website: www.whlr.us | ||||||||
| Executive Management | ||||||||
| Daniel Khoshaba - CEO | ||||||||
| Crystal Plum - CFO | ||||||||
| M. Andrew Franklin - COO | ||||||||
| Board of Directors | ||||||||
Stefani D. Carter (Chairman) | Andrew R. Jones | |||||||
Clayton ("Chip") Andrews | Daniel Khoshaba (CEO) | |||||||
E. J. Borrack | Paula J. Poskon | |||||||
Kerry G. Campbell | Joseph D. Stilwell | |||||||
| Investor Relations Contact | ||||||||
| Mary Jensen mjensen@whlr.us 2529 Virginia Beach Boulevard Virginia Beach, VA 23452 Phone: (757) 627-9088 | ||||||||
| Transfer Agent and Registrar | ||||||||
| Computershare Trust Company, N.A. 250 Royall Street Canton, MA 02021 www.computershare.com | ||||||||
WHLR | Financial & Operating Data | 3 | ||||
Financial Results | |||||
| Net loss attributable to Wheeler REIT common shareholders (in 000s) | $ | (2,175) | |||
| Net loss per basic and diluted shares | $ | (0.22) | |||
Funds from operations available to common shareholders and Operating Partnership (OP) unitholders (FFO) (in 000s) (1) | $ | 4,935 | |||
| FFO per common share and OP unit | $ | 0.15 | |||
Adjusted FFO (AFFO) (in 000s) (1) | $ | 1,255 | |||
| AFFO per common share and OP unit | $ | 0.13 | |||
Assets and Leverage | |||||
| Investment Properties, net of $56.50 million accumulated depreciation (in 000s) | $ | 394,378 | |||
| Cash and Cash Equivalents (in 000s) | $ | 6,957 | |||
| Total Assets (in 000s) | $ | 474,338 | |||
Debt to Total Assets(3) | 70.95 | % | |||
| Debt to Gross Asset Value | 59.73 | % | |||
Market Capitalization | |||||
| Common shares outstanding | 9,699,461 | ||||
| OP units outstanding | 228,842 | ||||
| Total common shares and OP units | 9,928,303 | ||||
| Shares Outstanding at September 30, 2020 | Third Quarter stock price range | Stock price as of September 30, 2020 | |||||||||||||||
| Common Stock | 9,699,461 | $1.70 - $3.42 | $ | 3.04 | |||||||||||||
| Series B preferred shares | 1,875,748 | $7.17 - $11.35 | $ | 9.55 | |||||||||||||
| Series D preferred shares | 3,529,293 | $11.46 - $15.75 | $ | 15.18 | |||||||||||||
Total debt (in 000s)(3) | $ | 336,566 | |||
| Common Stock market capitalization (as of September 30, 2020 closing stock price, in 000s) | $ | 29,486 | |||
Portfolio Summary | |||||
| Total Leasable Area (GLA) in sq. ft. | 5,563,629 | ||||
| Occupancy Rate | 87.3 | % | |||
Leased Rate (2) | 88.3 | % | |||
| Annualized Base Rent (in 000s) | $ | 46,876 | |||
| Total number of leases signed or renewed during the third quarter of 2020 | 72 | ||||
| Total sq. ft. leases signed or renewed during the third quarter of 2020 | 463,753 | ||||
WHLR | Financial & Operating Data | as of 9/30/2020 unless otherwise stated | 4 | ||||
WHLR | Financial & Operating Data | as of 9/30/2020 unless otherwise stated | 5 | ||||
WHLR | Financial & Operating Data | as of 9/30/2020 unless otherwise stated | 6 | ||||
WHLR | Financial & Operating Data | as of 9/30/2020 unless otherwise stated | 7 | ||||
WHLR | Financial & Operating Data | as of 9/30/2020 unless otherwise stated | 8 | ||||
| September 30, 2020 | December 31, 2019 | ||||||||||
| (unaudited) | |||||||||||
| ASSETS: | |||||||||||
| Investment properties, net | $ | 394,378 | $ | 416,215 | |||||||
| Cash and cash equivalents | 6,957 | 5,451 | |||||||||
| Restricted cash | 17,240 | 16,140 | |||||||||
| Rents and other tenant receivables, net | 8,365 | 6,905 | |||||||||
| Assets held for sale | 15,064 | 1,737 | |||||||||
| Above market lease intangibles, net | 3,928 | 5,241 | |||||||||
| Operating lease right-of-use assets | 11,508 | 11,651 | |||||||||
| Deferred costs and other assets, net | 16,898 | 21,025 | |||||||||
| Total Assets | $ | 474,338 | $ | 484,365 | |||||||
| LIABILITIES: | |||||||||||
| Loans payable, net | $ | 318,230 | $ | 340,913 | |||||||
| Liabilities associated with assets held for sale | 14,912 | 2,026 | |||||||||
| Below market lease intangibles, net | 5,093 | 6,716 | |||||||||
| Operating lease liabilities | 11,917 | 11,921 | |||||||||
| Accounts payable, accrued expenses and other liabilities | 12,949 | 9,557 | |||||||||
| Total Liabilities | 363,101 | 371,133 | |||||||||
| Series D Cumulative Convertible Preferred Stock (no par value, 4,000,000 shares authorized, 3,529,293 and 3,600,636 shares issued and outstanding, respectively; $106.76 million and $101.66 million aggregate liquidation preference, respectively) | 93,046 | 87,225 | |||||||||
| EQUITY: | |||||||||||
| Series A Preferred Stock (no par value, 4,500 shares authorized, 562 shares issued and outstanding) | 453 | 453 | |||||||||
| Series B Convertible Preferred Stock (no par value, 5,000,000 authorized, 1,875,748 shares issued and outstanding; $46.90 million aggregate liquidation preference) | 41,152 | 41,087 | |||||||||
| Common Stock ($0.01 par value, 18,750,000 shares authorized, 9,699,461 and 9,694,284 shares issued and outstanding, respectively) | 97 | 97 | |||||||||
| Additional paid-in capital | 233,916 | 233,870 | |||||||||
| Accumulated deficit | (259,479) | (251,580) | |||||||||
| Total Shareholders’ Equity | 16,139 | 23,927 | |||||||||
| Noncontrolling interests | 2,052 | 2,080 | |||||||||
| Total Equity | 18,191 | 26,007 | |||||||||
| Total Liabilities and Equity | $ | 474,338 | $ | 484,365 | |||||||
WHLR | Financial & Operating Data | as of 9/30/2020 unless otherwise stated | 9 | ||||
| Three Months Ended September 30, | Nine Months Ended September 30, | ||||||||||||||||||||||
| 2020 | 2019 | 2020 | 2019 | ||||||||||||||||||||
| REVENUE: | |||||||||||||||||||||||
| Rental revenues | $ | 14,756 | $ | 15,385 | $ | 44,920 | $ | 46,546 | |||||||||||||||
| Other revenues | 208 | 180 | 787 | 546 | |||||||||||||||||||
| Total Revenue | 14,964 | 15,565 | 45,707 | 47,092 | |||||||||||||||||||
| OPERATING EXPENSES: | |||||||||||||||||||||||
| Property operations | 4,820 | 4,967 | 14,116 | 14,288 | |||||||||||||||||||
| Non-REIT management and leasing services | — | 1 | — | 25 | |||||||||||||||||||
| Depreciation and amortization | 4,215 | 5,066 | 13,460 | 16,169 | |||||||||||||||||||
| Impairment of notes receivable | — | — | — | 5,000 | |||||||||||||||||||
| Impairment of assets held for sale | — | 400 | 600 | 1,547 | |||||||||||||||||||
| Corporate general & administrative | 1,080 | 1,349 | 4,567 | 4,543 | |||||||||||||||||||
| Total Operating Expenses | 10,115 | 11,783 | 32,743 | 41,572 | |||||||||||||||||||
| (Loss) gain on disposal of properties | — | (81) | (26) | 1,427 | |||||||||||||||||||
| Operating Income | 4,849 | 3,701 | 12,938 | 6,947 | |||||||||||||||||||
| Interest income | — | 1 | 1 | 2 | |||||||||||||||||||
| Interest expense | (4,114) | (4,654) | (12,787) | (14,394) | |||||||||||||||||||
| Other expense | (15) | — | (1,039) | — | |||||||||||||||||||
| Net Income (Loss) Before Income Taxes | 720 | (952) | (887) | (7,445) | |||||||||||||||||||
| Income tax expense | — | (8) | (2) | (23) | |||||||||||||||||||
| Net Income (Loss) | 720 | (960) | (889) | (7,468) | |||||||||||||||||||
| Less: Net income (loss) attributable to noncontrolling interests | 13 | (1) | 18 | (100) | |||||||||||||||||||
| Net Income (Loss) Attributable to Wheeler REIT | 707 | (959) | (907) | (7,368) | |||||||||||||||||||
| Preferred Stock dividends - undeclared | (3,608) | (3,657) | (10,922) | (10,972) | |||||||||||||||||||
| Deemed contribution related to preferred stock redemption | 726 | — | 726 | — | |||||||||||||||||||
| Net Loss Attributable to Wheeler REIT Common Shareholders | $ | (2,175) | $ | (4,616) | $ | (11,103) | $ | (18,340) | |||||||||||||||
| Loss per share: | |||||||||||||||||||||||
| Basic and Diluted | $ | (0.22) | $ | (0.48) | $ | (1.14) | $ | (1.90) | |||||||||||||||
| Weighted-average number of shares: | |||||||||||||||||||||||
| Basic and Diluted | 9,699,461 | 9,693,271 | 9,696,554 | 9,664,582 | |||||||||||||||||||
WHLR | Financial & Operating Data | as of 9/30/2020 unless otherwise stated | 10 | ||||
Three Months Ended September 30, | Nine Months Ended September 30, | |||||||||||||||||||||||||
| 2020 | 2019 | 2020 | 2019 | |||||||||||||||||||||||
| Net Income (Loss) | $ | 720 | $ | (960) | $ | (889) | $ | (7,468) | ||||||||||||||||||
| Depreciation and amortization of real estate assets | 4,215 | 5,066 | 13,460 | 16,169 | ||||||||||||||||||||||
| Loss (Gain) on disposal of properties | — | 81 | 26 | (1,427) | ||||||||||||||||||||||
| Impairment of assets held for sale | — | 400 | 600 | 1,547 | ||||||||||||||||||||||
| FFO | 4,935 | 4,587 | 13,197 | 8,821 | ||||||||||||||||||||||
| Preferred stock dividends undeclared | (3,608) | (3,657) | (10,922) | (10,972) | ||||||||||||||||||||||
| Preferred stock redemption | — | — | 96 | — | ||||||||||||||||||||||
| Preferred stock accretion adjustments | 168 | 169 | 509 | 510 | ||||||||||||||||||||||
| FFO available to common shareholders and common unitholders | 1,495 | 1,099 | 2,880 | (1,641) | ||||||||||||||||||||||
| Impairment of notes receivable | — | — | — | 5,000 | ||||||||||||||||||||||
| Acquisition and development costs | — | 1 | 1 | 25 | ||||||||||||||||||||||
| Capital related costs | 151 | 4 | 185 | 140 | ||||||||||||||||||||||
Other non-recurring and non-cash expenses (2) | 17 | 35 | 1,090 | 61 | ||||||||||||||||||||||
| Share-based compensation | — | 72 | — | 244 | ||||||||||||||||||||||
| Straight-line rental revenue, net straight-line expense | (294) | (86) | (700) | (1) | ||||||||||||||||||||||
| Loan cost amortization | 234 | 409 | 796 | 1,336 | ||||||||||||||||||||||
| Above (below) market lease amortization | (70) | (165) | (443) | (585) | ||||||||||||||||||||||
| Recurring capital expenditures and tenant improvement reserves | (278) | (276) | (835) | (846) | ||||||||||||||||||||||
| AFFO | $ | 1,255 | $ | 1,093 | $ | 2,974 | $ | 3,733 | ||||||||||||||||||
| Weighted Average Common Shares | 9,699,461 | 9,693,271 | 9,696,554 | 9,664,582 | ||||||||||||||||||||||
| Weighted Average Common Units | 228,842 | 235,032 | 231,749 | 235,032 | ||||||||||||||||||||||
| Total Common Shares and Units | 9,928,303 | 9,928,303 | 9,928,303 | 9,899,614 | ||||||||||||||||||||||
| FFO per Common Share and Common Units | $ | 0.15 | $ | 0.11 | $ | 0.29 | $ | (0.17) | ||||||||||||||||||
| AFFO per Common Share and Common Units | $ | 0.13 | $ | 0.11 | $ | 0.30 | $ | 0.38 | ||||||||||||||||||
WHLR | Financial & Operating Data | as of 9/30/2020 unless otherwise stated | 11 | ||||
| Three Months Ended September 30, | |||||||||||||||||||||||||||||||||||
| Same Store | Non-same Store | Total | |||||||||||||||||||||||||||||||||
| 2020 | 2019 | 2020 | 2019 | 2020 | 2019 | ||||||||||||||||||||||||||||||
| (in thousands, unaudited) | |||||||||||||||||||||||||||||||||||
| Net Income (Loss) | $ | 726 | $ | (475) | $ | (6) | $ | (485) | $ | 720 | $ | (960) | |||||||||||||||||||||||
| Adjustments: | |||||||||||||||||||||||||||||||||||
| Income tax expense | — | 8 | — | — | — | 8 | |||||||||||||||||||||||||||||
| Other expense | 15 | — | — | — | 15 | — | |||||||||||||||||||||||||||||
| Interest expense | 4,114 | 4,644 | — | 10 | 4,114 | 4,654 | |||||||||||||||||||||||||||||
| Interest income | — | (1) | — | — | — | (1) | |||||||||||||||||||||||||||||
| Loss on disposal of properties | — | — | — | 81 | — | 81 | |||||||||||||||||||||||||||||
| Corporate general & administrative | 1,079 | 1,343 | 1 | 6 | 1,080 | 1,349 | |||||||||||||||||||||||||||||
| Impairment of assets held for sale | — | — | — | 400 | — | 400 | |||||||||||||||||||||||||||||
| Depreciation and amortization | 4,214 | 5,062 | 1 | 4 | 4,215 | 5,066 | |||||||||||||||||||||||||||||
| Non-REIT management and leasing services | — | 1 | — | — | — | 1 | |||||||||||||||||||||||||||||
| Other non-property revenue | (13) | (34) | — | — | (13) | (34) | |||||||||||||||||||||||||||||
| Property Net Operating Income (Loss) | $ | 10,135 | $ | 10,548 | $ | (4) | $ | 16 | $ | 10,131 | $ | 10,564 | |||||||||||||||||||||||
| Property revenues | $ | 14,951 | $ | 15,438 | $ | — | $ | 93 | $ | 14,951 | $ | 15,531 | |||||||||||||||||||||||
| Property expenses | 4,816 | 4,890 | 4 | 77 | 4,820 | 4,967 | |||||||||||||||||||||||||||||
| Property Net Operating Income (Loss) | $ | 10,135 | $ | 10,548 | $ | (4) | $ | 16 | $ | 10,131 | $ | 10,564 | |||||||||||||||||||||||
| Nine Months Ended September 30, | |||||||||||||||||||||||||||||||||||
| Same Store | Non-same Store | Total | |||||||||||||||||||||||||||||||||
| 2020 | 2019 | 2020 | 2019 | 2020 | 2019 | ||||||||||||||||||||||||||||||
| (in thousands, unaudited) | |||||||||||||||||||||||||||||||||||
| Net (Loss) | $ | (846) | $ | (7,432) | $ | (43) | $ | (36) | $ | (889) | $ | (7,468) | |||||||||||||||||||||||
| Adjustments: | |||||||||||||||||||||||||||||||||||
| Income tax expense | 2 | 23 | — | — | 2 | 23 | |||||||||||||||||||||||||||||
| Other expense | 1,039 | — | — | — | 1,039 | — | |||||||||||||||||||||||||||||
| Interest expense | 12,787 | 14,104 | — | 290 | 12,787 | 14,394 | |||||||||||||||||||||||||||||
| Interest income | (1) | (2) | — | — | (1) | (2) | |||||||||||||||||||||||||||||
| Loss (gain) on disposal of properties | — | — | 26 | (1,427) | 26 | (1,427) | |||||||||||||||||||||||||||||
| Corporate general & administrative | 4,565 | 4,527 | 2 | 16 | 4,567 | 4,543 | |||||||||||||||||||||||||||||
| Impairment of assets held for sale | 600 | — | — | 1,547 | 600 | 1,547 | |||||||||||||||||||||||||||||
| Impairment of notes receivable | — | 5,000 | — | — | — | 5,000 | |||||||||||||||||||||||||||||
| Depreciation and amortization | 13,459 | 16,091 | 1 | 78 | 13,460 | 16,169 | |||||||||||||||||||||||||||||
| Non-REIT management and leasing services | — | 25 | — | — | — | 25 | |||||||||||||||||||||||||||||
| Other non-property revenue | (256) | (107) | — | — | (256) | (107) | |||||||||||||||||||||||||||||
| Property Net Operating Income (Loss) | $ | 31,349 | $ | 32,229 | $ | (14) | $ | 468 | $ | 31,335 | $ | 32,697 | |||||||||||||||||||||||
| Property revenues | $ | 45,441 | $ | 46,249 | $ | 10 | $ | 736 | $ | 45,451 | $ | 46,985 | |||||||||||||||||||||||
| Property expenses | 14,092 | 14,020 | 24 | 268 | 14,116 | 14,288 | |||||||||||||||||||||||||||||
| Property Net Operating Income (Loss) | $ | 31,349 | $ | 32,229 | $ | (14) | $ | 468 | $ | 31,335 | $ | 32,697 | |||||||||||||||||||||||
WHLR | Financial & Operating Data | as of 9/30/2020 unless otherwise stated | 12 | ||||
| Three Months Ended September 30, | Nine Months Ended September 30, | |||||||||||||||||||||||||
| 2020 | 2019 | 2020 | 2019 | |||||||||||||||||||||||
Net Income (Loss) | $ | 720 | $ | (960) | $ | (889) | $ | (7,468) | ||||||||||||||||||
Add back: | Depreciation and amortization (1) | 4,145 | 4,901 | 13,017 | 15,584 | |||||||||||||||||||||
Interest Expense (2) | 4,114 | 4,654 | 12,787 | 14,394 | ||||||||||||||||||||||
Income tax expense | — | 8 | 2 | 23 | ||||||||||||||||||||||
EBITDA | 8,979 | 8,603 | 24,917 | 22,533 | ||||||||||||||||||||||
| Adjustments for items affecting comparability: | ||||||||||||||||||||||||||
Acquisition and development costs | — | 1 | 1 | 25 | ||||||||||||||||||||||
Capital related costs | 151 | 4 | 185 | 140 | ||||||||||||||||||||||
Other non-recurring and non-cash expenses (3) | 17 | 35 | 1,090 | 61 | ||||||||||||||||||||||
Impairment of notes receivable | — | — | — | 5,000 | ||||||||||||||||||||||
Impairment of assets held for sale | — | 400 | 600 | 1,547 | ||||||||||||||||||||||
Loss (Gain) on disposal of properties | — | 81 | 26 | (1,427) | ||||||||||||||||||||||
Adjusted EBITDA | $ | 9,147 | $ | 9,124 | $ | 26,819 | $ | 27,879 | ||||||||||||||||||
WHLR | Financial & Operating Data | as of 9/30/2020 unless otherwise stated | 13 | ||||
| Property/Description | Monthly Payment | Interest Rate | Maturity | September 30, 2020 | December 31, 2019 | ||||||||||||||||||||||||
First National Bank (7) | $ | 24,656 | LIBOR + 300 basis points | September 2020 | $ | 1,127 | $ | 1,214 | |||||||||||||||||||||
Lumber River (8) | $ | 10,723 | LIBOR + 350 basis points | October 2020 | 1,385 | 1,404 | |||||||||||||||||||||||
| Rivergate | $ | 102,795 | LIBOR + 295 basis points | October 2020 | 21,307 | 21,545 | |||||||||||||||||||||||
| Tuckernuck | $ | 33,880 | 3.88 | % | November 2020 | 5,244 | 5,344 | ||||||||||||||||||||||
| Columbia Fire Station | $ | 45,580 | 4.00 | % | December 2020 | 3,957 | 4,051 | ||||||||||||||||||||||
KeyBank Credit Agreement (6) | $ | 350,000 | LIBOR + 350 basis points | December 2020 | 4,350 | 17,879 | |||||||||||||||||||||||
| JANAF Bravo | $ | 36,935 | 4.65 | % | April 2021 | 6,300 | 6,372 | ||||||||||||||||||||||
| Walnut Hill Plaza | Interest only | 5.50 | % | December 2022 | 3,287 | 3,759 | |||||||||||||||||||||||
| Litchfield Market Village | $ | 46,057 | 5.50 | % | November 2022 | 7,418 | 7,452 | ||||||||||||||||||||||
| Twin City Commons | $ | 17,827 | 4.86 | % | January 2023 | 2,933 | 2,983 | ||||||||||||||||||||||
| New Market | $ | 48,747 | 5.65 | % | June 2023 | 6,561 | 6,713 | ||||||||||||||||||||||
Benefit Street Note (3) | $ | 53,185 | 5.71 | % | June 2023 | 7,201 | 7,361 | ||||||||||||||||||||||
Deutsche Bank Note (2) | $ | 33,340 | 5.71 | % | July 2023 | 5,586 | 5,642 | ||||||||||||||||||||||
| JANAF | $ | 333,159 | 4.49 | % | July 2023 | 49,317 | 50,599 | ||||||||||||||||||||||
| Tampa Festival | $ | 50,797 | 5.56 | % | September 2023 | 7,961 | 8,077 | ||||||||||||||||||||||
| Forrest Gallery | $ | 50,973 | 5.40 | % | September 2023 | 8,266 | 8,381 | ||||||||||||||||||||||
| Riversedge North | $ | 11,436 | 5.77 | % | December 2023 | 1,756 | 1,767 | ||||||||||||||||||||||
South Carolina Food Lions Note (5) | $ | 68,320 | 5.25 | % | January 2024 | 11,525 | 11,675 | ||||||||||||||||||||||
| Cypress Shopping Center | $ | 34,360 | 4.70 | % | July 2024 | 6,183 | 6,268 | ||||||||||||||||||||||
| Port Crossing | $ | 34,788 | 4.84 | % | August 2024 | 5,941 | 6,032 | ||||||||||||||||||||||
| Freeway Junction | $ | 41,798 | 4.60 | % | September 2024 | 7,619 | 7,725 | ||||||||||||||||||||||
| Harrodsburg Marketplace | $ | 19,112 | 4.55 | % | September 2024 | 3,362 | 3,416 | ||||||||||||||||||||||
| Bryan Station | $ | 23,489 | 4.52 | % | November 2024 | 4,333 | 4,394 | ||||||||||||||||||||||
| Crockett Square | Interest only | 4.47 | % | December 2024 | 6,338 | 6,338 | |||||||||||||||||||||||
| Pierpont Centre | $ | 39,435 | 4.15 | % | February 2025 | 8,035 | 8,113 | ||||||||||||||||||||||
| Shoppes at Myrtle Park | $ | 33,180 | 4.45 | % | February 2025 | 5,925 | — | ||||||||||||||||||||||
| Folly Road | $ | 41,482 | 4.65 | % | March 2025 | 7,262 | 5,922 | ||||||||||||||||||||||
| Alex City Marketplace | Interest only | 3.95 | % | April 2025 | 5,750 | 5,750 | |||||||||||||||||||||||
| Butler Square | Interest only | 3.90 | % | May 2025 | 5,640 | 5,640 | |||||||||||||||||||||||
| Brook Run Shopping Center | Interest only | 4.08 | % | June 2025 | 10,950 | 10,950 | |||||||||||||||||||||||
| Beaver Ruin Village I and II | Interest only | 4.73 | % | July 2025 | 9,400 | 9,400 | |||||||||||||||||||||||
| Sunshine Shopping Plaza | Interest only | 4.57 | % | August 2025 | 5,900 | 5,900 | |||||||||||||||||||||||
Barnett Portfolio (4) | Interest only | 4.30 | % | September 2025 | 8,770 | 8,770 | |||||||||||||||||||||||
| Fort Howard Shopping Center | Interest only | 4.57 | % | October 2025 | 7,100 | 7,100 | |||||||||||||||||||||||
| Conyers Crossing | Interest only | 4.67 | % | October 2025 | 5,960 | 5,960 | |||||||||||||||||||||||
| Grove Park Shopping Center | Interest only | 4.52 | % | October 2025 | 3,800 | 3,800 | |||||||||||||||||||||||
| Parkway Plaza | Interest only | 4.57 | % | October 2025 | 3,500 | 3,500 | |||||||||||||||||||||||
| Winslow Plaza | $ | 24,295 | 4.82 | % | December 2025 | 4,571 | 4,620 | ||||||||||||||||||||||
| JANAF BJ's | $ | 29,964 | 4.95 | % | January 2026 | 4,873 | 4,957 | ||||||||||||||||||||||
| Chesapeake Square | $ | 23,857 | 4.70 | % | August 2026 | 4,298 | 4,354 | ||||||||||||||||||||||
| Berkley/Sangaree/Tri-County | Interest only | 4.78 | % | December 2026 | 9,400 | 9,400 | |||||||||||||||||||||||
| Riverbridge | Interest only | 4.48 | % | December 2026 | 4,000 | 4,000 | |||||||||||||||||||||||
| Franklin Village | $ | 45,336 | 4.93 | % | January 2027 | 8,436 | 8,516 | ||||||||||||||||||||||
| Village of Martinsville | $ | 89,664 | 4.28 | % | July 2029 | 16,074 | 16,351 | ||||||||||||||||||||||
| Laburnum Square | Interest only | 4.28 | % | September 2029 | 7,665 | 7,665 | |||||||||||||||||||||||
Total Principal Balance (1) | 336,566 | 347,059 | |||||||||||||||||||||||||||
Unamortized debt issuance cost (1) | (3,716) | (4,172) | |||||||||||||||||||||||||||
| Total Loans Payable, including assets held for sale | 332,850 | 342,887 | |||||||||||||||||||||||||||
| Less loans payable on assets held for sale, net loan amortization costs | 14,620 | 1,974 | |||||||||||||||||||||||||||
| Total Loans Payable, net | $ | 318,230 | $ | 340,913 | |||||||||||||||||||||||||
WHLR | Financial & Operating Data | as of 9/30/2020 unless otherwise stated | 14 | ||||
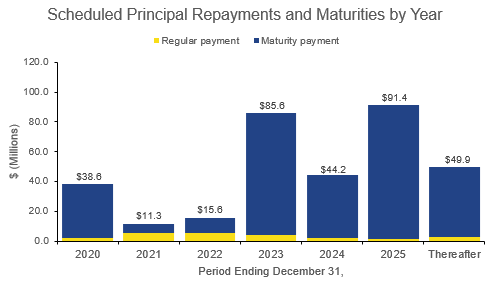
| Scheduled principal repayments and maturities by year | Amount | % Total Principal Payments and Maturities | ||||||||||||
| For the remaining three months ended December 31, 2020 | $ | 38,601 | 11.47 | % | ||||||||||
| December 31, 2021 | 11,287 | 3.35 | % | |||||||||||
| December 31, 2022 | 15,580 | 4.63 | % | |||||||||||
| December 31, 2023 | 85,576 | 25.43 | % | |||||||||||
| December 31, 2024 | 44,240 | 13.14 | % | |||||||||||
| December 31, 2025 | 91,426 | 27.16 | % | |||||||||||
| Thereafter | 49,856 | 14.82 | % | |||||||||||
| Total principal repayments and debt maturities | $ | 336,566 | 100.00 | % | ||||||||||
WHLR | Financial & Operating Data | as of 9/30/2020 unless otherwise stated | 15 | ||||
Property | Location | Number of Tenants (1) | Total Leasable Square Feet | Percentage Leased (1) | Percentage Occupied | Total SF Occupied | Annualized Base Rent (in 000's) (2) | Annualized Base Rent per Occupied Sq. Foot | ||||||||||||||||||||||||
| Alex City Marketplace | Alexander City, AL | 15 | 151,843 | 78.4 | % | 77.6 | % | 117,843 | $ | 980 | $ | 8.31 | ||||||||||||||||||||
| Amscot Building (3) | Tampa, FL | 1 | 2,500 | 100.0 | % | 100.0 | % | 2,500 | 83 | 33.00 | ||||||||||||||||||||||
| Beaver Ruin Village | Lilburn, GA | 28 | 74,038 | 90.4 | % | 90.4 | % | 66,948 | 1,157 | 17.27 | ||||||||||||||||||||||
| Beaver Ruin Village II | Lilburn, GA | 4 | 34,925 | 100.0 | % | 100.0 | % | 34,925 | 454 | 12.99 | ||||||||||||||||||||||
| Berkley (4) | Norfolk, VA | — | — | — | % | — | % | — | — | — | ||||||||||||||||||||||
| Berkley Shopping Center | Norfolk, VA | 10 | 47,945 | 42.0 | % | 42.0 | % | 20,140 | 180 | 8.93 | ||||||||||||||||||||||
| Brook Run Shopping Center | Richmond, VA | 20 | 147,738 | 93.3 | % | 93.3 | % | 137,802 | 1,266 | 9.19 | ||||||||||||||||||||||
| Brook Run Properties (4) | Richmond, VA | — | — | — | % | — | % | — | — | — | ||||||||||||||||||||||
| Bryan Station | Lexington, KY | 10 | 54,277 | 100.0 | % | 100.0 | % | 54,277 | 593 | 10.92 | ||||||||||||||||||||||
| Butler Square | Mauldin, SC | 15 | 82,400 | 94.9 | % | 94.9 | % | 78,196 | 811 | 10.37 | ||||||||||||||||||||||
| Cardinal Plaza | Henderson, NC | 9 | 50,000 | 100.0 | % | 100.0 | % | 50,000 | 493 | 9.85 | ||||||||||||||||||||||
| Chesapeake Square | Onley, VA | 12 | 108,982 | 96.5 | % | 96.5 | % | 105,182 | 795 | 7.56 | ||||||||||||||||||||||
| Clover Plaza | Clover, SC | 10 | 45,575 | 100.0 | % | 100.0 | % | 45,575 | 372 | 8.16 | ||||||||||||||||||||||
| Columbia Fire Station | Columbia, SC | 1 | 21,273 | 14.4 | % | 14.4 | % | 3,063 | 81 | 26.60 | ||||||||||||||||||||||
| Courtland Commons (4) | Courtland, VA | — | — | — | % | — | % | — | — | — | ||||||||||||||||||||||
| Conyers Crossing | Conyers, GA | 12 | 170,475 | 95.7 | % | 95.7 | % | 163,150 | 854 | 5.24 | ||||||||||||||||||||||
| Crockett Square | Morristown, TN | 4 | 107,122 | 100.0 | % | 100.0 | % | 107,122 | 940 | 8.78 | ||||||||||||||||||||||
| Cypress Shopping Center | Boiling Springs, SC | 17 | 80,435 | 41.2 | % | 41.2 | % | 33,175 | 452 | 13.62 | ||||||||||||||||||||||
| Darien Shopping Center | Darien, GA | 1 | 26,001 | 100.0 | % | 100.0 | % | 26,001 | 156 | 6.00 | ||||||||||||||||||||||
| Devine Street | Columbia, SC | 2 | 38,464 | 100.0 | % | 100.0 | % | 38,464 | 319 | 8.28 | ||||||||||||||||||||||
| Edenton Commons (4) | Edenton, NC | — | — | — | % | — | % | — | — | — | ||||||||||||||||||||||
| Folly Road | Charleston, SC | 5 | 47,794 | 100.0 | % | 100.0 | % | 47,794 | 730 | 15.26 | ||||||||||||||||||||||
| Forrest Gallery | Tullahoma, TN | 26 | 214,451 | 80.3 | % | 80.3 | % | 172,124 | 1,239 | 7.20 | ||||||||||||||||||||||
| Fort Howard Shopping Center | Rincon, GA | 19 | 113,652 | 95.1 | % | 95.1 | % | 108,120 | 1,048 | 9.69 | ||||||||||||||||||||||
| Freeway Junction | Stockbridge, GA | 19 | 156,834 | 100.0 | % | 100.0 | % | 156,834 | 1,293 | 8.24 | ||||||||||||||||||||||
| Franklin Village | Kittanning, PA | 26 | 151,821 | 98.0 | % | 94.1 | % | 142,921 | 1,202 | 8.41 | ||||||||||||||||||||||
| Franklinton Square | Franklinton, NC | 12 | 65,366 | 93.0 | % | 90.7 | % | 59,300 | 544 | 9.17 | ||||||||||||||||||||||
| Georgetown | Georgetown, SC | 2 | 29,572 | 100.0 | % | 100.0 | % | 29,572 | 267 | 9.04 | ||||||||||||||||||||||
| Grove Park | Orangeburg, SC | 12 | 93,265 | 97.7 | % | 96.0 | % | 89,521 | 687 | 7.68 | ||||||||||||||||||||||
| Harbor Point (4) | Grove, OK | — | — | — | % | — | % | — | — | — | ||||||||||||||||||||||
| Harrodsburg Marketplace | Harrodsburg, KY | 6 | 60,048 | 79.0 | % | 79.0 | % | 47,448 | 404 | 8.52 | ||||||||||||||||||||||
| JANAF (6) | Norfolk, VA | 110 | 800,026 | 83.6 | % | 82.3 | % | 658,538 | 7,909 | 12.01 | ||||||||||||||||||||||
| Laburnum Square | Richmond, VA | 20 | 109,405 | 97.5 | % | 97.5 | % | 106,705 | 982 | 9.21 | ||||||||||||||||||||||
| Ladson Crossing | Ladson, SC | 14 | 52,607 | 97.2 | % | 97.2 | % | 51,107 | 484 | 9.46 | ||||||||||||||||||||||
| LaGrange Marketplace | LaGrange, GA | 12 | 76,594 | 96.9 | % | 93.0 | % | 71,194 | 405 | 5.68 | ||||||||||||||||||||||
| Lake Greenwood Crossing | Greenwood, SC | 6 | 47,546 | 87.5 | % | 87.5 | % | 41,618 | 332 | 7.98 | ||||||||||||||||||||||
| Lake Murray | Lexington, SC | 3 | 39,218 | 96.9 | % | 90.8 | % | 35,618 | 203 | 5.70 | ||||||||||||||||||||||
| Litchfield Market Village | Pawleys Island, SC | 19 | 86,740 | 87.3 | % | 87.3 | % | 75,702 | 895 | 11.82 | ||||||||||||||||||||||
| Lumber River Village | Lumberton, NC | 11 | 66,781 | 98.2 | % | 98.2 | % | 65,581 | 479 | 7.31 | ||||||||||||||||||||||
| Moncks Corner | Moncks Corner, SC | 1 | 26,800 | 100.0 | % | 100.0 | % | 26,800 | 323 | 12.07 | ||||||||||||||||||||||
| Nashville Commons | Nashville, NC | 12 | 56,100 | 100.0 | % | 100.0 | % | 56,100 | 623 | 11.10 | ||||||||||||||||||||||
| New Market Crossing | Mt. Airy, NC | 10 | 117,076 | 89.0 | % | 89.0 | % | 104,138 | 920 | 8.84 | ||||||||||||||||||||||
| Parkway Plaza | Brunswick, GA | 4 | 52,365 | 81.7 | % | 81.7 | % | 42,785 | 351 | 8.20 | ||||||||||||||||||||||
| Pierpont Centre | Morgantown, WV | 14 | 111,162 | 87.0 | % | 87.0 | % | 96,658 | 890 | 9.21 | ||||||||||||||||||||||
| Port Crossing | Harrisonburg, VA | 8 | 65,365 | 97.9 | % | 97.9 | % | 64,000 | 851 | 13.30 | ||||||||||||||||||||||
| Ridgeland | Ridgeland, SC | 1 | 20,029 | 100.0 | % | 100.0 | % | 20,029 | 140 | 7.00 | ||||||||||||||||||||||
| Riverbridge Shopping Center | Carrollton, GA | 12 | 91,188 | 100.0 | % | 100.0 | % | 91,188 | 718 | 7.87 | ||||||||||||||||||||||
| Riversedge North (5) | Virginia Beach, VA | — | — | — | % | — | % | — | — | — | ||||||||||||||||||||||
| Rivergate Shopping Center | Macon, GA | 31 | 201,680 | 97.5 | % | 97.5 | % | 196,719 | 2,863 | 14.55 | ||||||||||||||||||||||
| Sangaree Plaza | Summerville, SC | 8 | 66,948 | 87.4 | % | 87.4 | % | 58,498 | 598 | 10.23 | ||||||||||||||||||||||
WHLR | Financial & Operating Data | as of 9/30/2020 unless otherwise stated | 16 | ||||
Property | Location | Number of Tenants (1) | Total Leasable Square Feet | Percentage Leased (1) | Percentage Occupied | Total SF Occupied | Annualized Base Rent (in 000's) (2) | Annualized Base Rent per Occupied Sq. Foot | ||||||||||||||||||||||||
| Shoppes at Myrtle Park | Bluffton, SC | 12 | 56,601 | 76.3 | % | 76.3 | % | 43,204 | $ | 551 | $ | 12.74 | ||||||||||||||||||||
| South Lake | Lexington, SC | 6 | 44,318 | 16.9 | % | 16.9 | % | 7,500 | 103 | 13.80 | ||||||||||||||||||||||
| South Park | Mullins, SC | 3 | 60,734 | 83.2 | % | 83.2 | % | 50,509 | 351 | 6.95 | ||||||||||||||||||||||
| South Square | Lancaster, SC | 5 | 44,350 | 74.2 | % | 74.2 | % | 32,900 | 276 | 8.39 | ||||||||||||||||||||||
| St. George Plaza | St. George, SC | 5 | 59,279 | 92.3 | % | 78.8 | % | 46,718 | 330 | 7.07 | ||||||||||||||||||||||
| Sunshine Plaza | Lehigh Acres, FL | 20 | 111,189 | 96.8 | % | 96.8 | % | 107,615 | 1,031 | 9.58 | ||||||||||||||||||||||
| Surrey Plaza | Hawkinsville, GA | 3 | 42,680 | 96.5 | % | 96.5 | % | 41,180 | 247 | 6.00 | ||||||||||||||||||||||
| Tampa Festival | Tampa, FL | 18 | 137,987 | 64.6 | % | 64.6 | % | 89,166 | 885 | 9.93 | ||||||||||||||||||||||
| Tri-County Plaza | Royston, GA | 7 | 67,577 | 94.1 | % | 94.1 | % | 63,577 | 416 | 6.55 | ||||||||||||||||||||||
| Tuckernuck | Richmond, VA | 13 | 93,624 | 90.6 | % | 90.6 | % | 84,787 | 941 | 11.10 | ||||||||||||||||||||||
| Tulls Creek (4) | Moyock, NC | — | — | — | % | — | % | — | — | — | ||||||||||||||||||||||
| Twin City Commons | Batesburg-Leesville, SC | 5 | 47,680 | 100.0 | % | 100.0 | % | 47,680 | 435 | 9.13 | ||||||||||||||||||||||
| Village of Martinsville | Martinsville, VA | 18 | 292,765 | 96.0 | % | 90.2 | % | 264,108 | 2,067 | 7.83 | ||||||||||||||||||||||
| Walnut Hill Plaza | Petersburg, VA | 6 | 87,239 | 38.1 | % | 38.1 | % | 33,225 | 268 | 8.06 | ||||||||||||||||||||||
| Waterway Plaza | Little River, SC | 10 | 49,750 | 100.0 | % | 100.0 | % | 49,750 | 490 | 9.84 | ||||||||||||||||||||||
| Westland Square | West Columbia, SC | 9 | 62,735 | 88.2 | % | 88.2 | % | 55,355 | 484 | 8.74 | ||||||||||||||||||||||
| Winslow Plaza | Sicklerville, NJ | 18 | 40,695 | 100.0 | % | 100.0 | % | 40,695 | 635 | 15.62 | ||||||||||||||||||||||
Total Portfolio | 752 | 5,563,629 | 88.3 | % | 87.3 | % | 4,858,944 | $ | 46,876 | $ | 9.65 | |||||||||||||||||||||
WHLR | Financial & Operating Data | as of 9/30/2020 unless otherwise stated | 17 | ||||
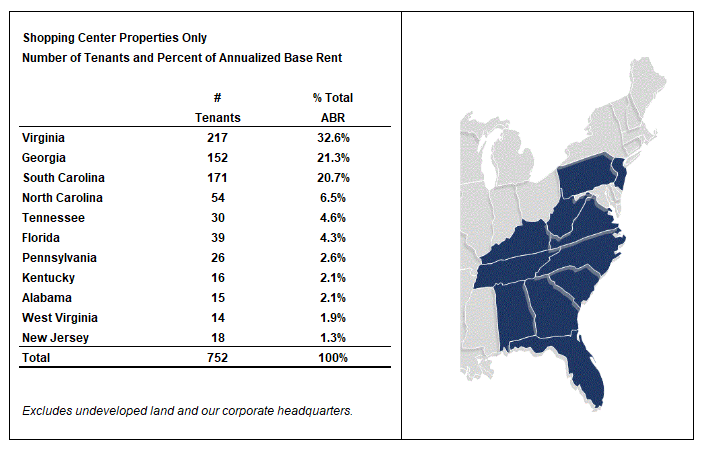
| Tenants | Annualized Base Rent ($ in 000s) | % of Total Annualized Base Rent | Total Occupied Square Feet | Percent Total Leasable Square Foot | Base Rent Per Occupied Square Foot | ||||||||||||||||||||||||||||||
| 1. | Food Lion | $ | 2,733 | 5.83 | % | 325,576 | 5.85 | % | $ | 8.39 | |||||||||||||||||||||||||
| 2. | BI-LO (1) | 2,729 | 5.82 | % | 380,675 | 6.84 | % | 7.17 | |||||||||||||||||||||||||||
| 3. | Kroger (2) | 1,355 | 2.89 | % | 186,064 | 3.34 | % | 7.28 | |||||||||||||||||||||||||||
| 4. | Piggly Wiggly | 1,322 | 2.82 | % | 169,750 | 3.05 | % | 7.79 | |||||||||||||||||||||||||||
| 5. | Winn Dixie (1) | 887 | 1.89 | % | 133,575 | 2.40 | % | 6.64 | |||||||||||||||||||||||||||
| 6. | Planet Fitness | 837 | 1.79 | % | 100,427 | 1.81 | % | 8.33 | |||||||||||||||||||||||||||
| 7. | Hobby Lobby | 717 | 1.53 | % | 114,298 | 2.05 | % | 6.27 | |||||||||||||||||||||||||||
| 8. | BJ's Wholesale Club | 646 | 1.38 | % | 147,400 | 2.65 | % | 4.38 | |||||||||||||||||||||||||||
| 9. | Harris Teeter (2) | 578 | 1.23 | % | 39,946 | 0.72 | % | 14.47 | |||||||||||||||||||||||||||
| 10. | Lowes Foods | 572 | 1.22 | % | 54,838 | 0.99 | % | 10.43 | |||||||||||||||||||||||||||
| $ | 12,376 | 26.40 | % | 1,652,549 | 29.70 | % | $ | 7.49 | |||||||||||||||||||||||||||
| Lease Expiration Period | Number of Expiring Leases | Total Expiring Square Footage | % of Total Expiring Square Footage | % of Total Occupied Square Footage Expiring | Expiring Annualized Base Rent (in 000s) | % of Total Annualized Base Rent | Expiring Base Rent Per Occupied Square Foot | |||||||||||||||||||||||||||||||||||||
| Available | — | 704,685 | 12.67 | % | — | % | $ | — | — | % | $ | — | ||||||||||||||||||||||||||||||||
| Month-to-Month | 13 | 31,413 | 0.56 | % | 0.65 | % | 409 | 0.87 | % | 13.02 | ||||||||||||||||||||||||||||||||||
| 2020 | 21 | 174,365 | 3.13 | % | 3.59 | % | 1,528 | 3.26 | % | 8.76 | ||||||||||||||||||||||||||||||||||
| 2021 | 120 | 451,841 | 8.12 | % | 9.30 | % | 4,961 | 10.58 | % | 10.98 | ||||||||||||||||||||||||||||||||||
| 2022 | 125 | 493,443 | 8.87 | % | 10.16 | % | 5,396 | 11.51 | % | 10.94 | ||||||||||||||||||||||||||||||||||
| 2023 | 125 | 831,141 | 14.94 | % | 17.11 | % | 7,183 | 15.32 | % | 8.64 | ||||||||||||||||||||||||||||||||||
| 2024 | 100 | 619,488 | 11.13 | % | 12.75 | % | 5,959 | 12.71 | % | 9.62 | ||||||||||||||||||||||||||||||||||
| 2025 | 100 | 776,894 | 13.96 | % | 15.99 | % | 7,616 | 16.25 | % | 9.80 | ||||||||||||||||||||||||||||||||||
| 2026 | 52 | 548,046 | 9.85 | % | 11.28 | % | 4,847 | 10.34 | % | 8.84 | ||||||||||||||||||||||||||||||||||
| 2027 | 25 | 131,215 | 2.36 | % | 2.70 | % | 1,720 | 3.67 | % | 13.11 | ||||||||||||||||||||||||||||||||||
| 2028 | 20 | 356,843 | 6.41 | % | 7.34 | % | 2,472 | 5.27 | % | 6.93 | ||||||||||||||||||||||||||||||||||
| 2029 and thereafter | 51 | 444,255 | 8.00 | % | 9.13 | % | 4,785 | 10.22 | % | 10.77 | ||||||||||||||||||||||||||||||||||
| Total | 752 | 5,563,629 | 100.00 | % | 100.00 | % | $ | 46,876 | 100.00 | % | $ | 9.65 | ||||||||||||||||||||||||||||||||
WHLR | Financial & Operating Data | as of 9/30/2020 unless otherwise stated | 18 | ||||
| No Option | Option | ||||||||||||||||||||||||||||||||||
| Lease Expiration Nine and Twelve Month Periods Ending December 31, | Number of Expiring Leases | Expiring Occupied Square Footage | Expiring Annualized Based Rent (in 000s) | % of Total Annualized Base Rent | Expiring Base Rent per Square Foot | Number of Expiring Leases | Expiring Occupied Square Footage | Expiring Annualized Based Rent (in 000s) | % of Total Annualized Base Rent | Expiring Base Rent per Square Foot | |||||||||||||||||||||||||
| Available | — | 246,844 | $ | — | — | % | $ | — | — | — | $ | — | — | % | $ | — | |||||||||||||||||||
| Month-to-Month | — | — | — | — | % | — | — | — | — | — | % | — | |||||||||||||||||||||||
| 2020 | 1 | 47,814 | 402 | 20.97 | % | 8.41 | 1 | 58,473 | 250 | 1.38 | % | 4.28 | |||||||||||||||||||||||
| 2021 | — | — | — | — | % | — | 6 | 183,292 | 1,315 | 7.25 | % | 7.17 | |||||||||||||||||||||||
| 2022 | — | — | — | — | % | — | 5 | 178,882 | 1,294 | 7.14 | % | 7.23 | |||||||||||||||||||||||
| 2023 | 1 | 22,032 | 215 | 11.22 | % | 9.76 | 15 | 523,775 | 3,323 | 18.33 | % | 6.34 | |||||||||||||||||||||||
| 2024 | 1 | 32,000 | 125 | 6.52 | % | 3.91 | 7 | 289,759 | 2,035 | 11.22 | % | 7.02 | |||||||||||||||||||||||
| 2025 | 2 | 84,633 | 590 | 30.77 | % | 6.97 | 11 | 437,850 | 3,560 | 19.63 | % | 8.13 | |||||||||||||||||||||||
| 2026 | 2 | 41,010 | 143 | 7.46 | % | 3.49 | 9 | 296,552 | 2,468 | 13.61 | % | 8.32 | |||||||||||||||||||||||
| 2027 | — | — | — | — | % | — | 1 | 24,945 | 212 | 1.17 | % | 8.50 | |||||||||||||||||||||||
| 2028 | — | — | — | — | % | — | 8 | 313,241 | 1,863 | 10.27 | % | 5.95 | |||||||||||||||||||||||
| 2029+ | 2 | 44,488 | 442 | 23.07 | % | 9.94 | 6 | 283,001 | 1,812 | 10.01 | % | 6.40 | |||||||||||||||||||||||
| Total | 9 | 518,821 | $ | 1,917 | 100.00 | % | $ | 7.05 | 69 | 2,589,770 | $ | 18,132 | 100.00 | % | $ | 7.00 | |||||||||||||||||||
| No Option | Option | ||||||||||||||||||||||||||||||||||
| Lease Expiration Nine and Twelve Month Periods Ending December 31, | Number of Expiring Leases | Expiring Occupied Square Footage | Expiring Annualized Based Rent (in 000s) | % of Total Annualized Base Rent | Expiring Base Rent per Square Foot | Number of Expiring Leases | Expiring Occupied Square Footage | Expiring Annualized Based Rent (in 000s) | % of Total Annualized Base Rent | Expiring Base Rent per Square Foot | |||||||||||||||||||||||||
| Available | — | 457,841 | $ | — | — | % | $ | — | — | — | $ | — | — | % | $ | — | |||||||||||||||||||
| Month-to-Month | 11 | 26,434 | 330 | 2.71 | % | 12.48 | 2 | 4,979 | 79 | 0.54 | % | 15.87 | |||||||||||||||||||||||
| 2020 | 13 | 37,960 | 389 | 3.20 | % | 10.25 | 6 | 30,118 | 487 | 3.32 | % | 16.17 | |||||||||||||||||||||||
| 2021 | 78 | 167,665 | 2,204 | 18.12 | % | 13.15 | 36 | 100,884 | 1,442 | 9.83 | % | 14.29 | |||||||||||||||||||||||
| 2022 | 59 | 113,696 | 1,620 | 13.32 | % | 14.25 | 61 | 200,865 | 2,482 | 16.92 | % | 12.36 | |||||||||||||||||||||||
| 2023 | 64 | 130,756 | 1,624 | 13.35 | % | 12.42 | 45 | 154,578 | 2,021 | 13.78 | % | 13.07 | |||||||||||||||||||||||
| 2024 | 53 | 125,415 | 1,578 | 12.98 | % | 12.58 | 39 | 172,314 | 2,221 | 15.14 | % | 12.89 | |||||||||||||||||||||||
| 2025 | 52 | 122,539 | 1,828 | 15.03 | % | 14.92 | 35 | 131,872 | 1,638 | 11.17 | % | 12.42 | |||||||||||||||||||||||
| 2026 | 22 | 77,836 | 905 | 7.44 | % | 11.63 | 19 | 132,648 | 1,331 | 9.08 | % | 10.03 | |||||||||||||||||||||||
| 2027 | 8 | 23,130 | 372 | 3.06 | % | 16.08 | 16 | 83,140 | 1,136 | 7.75 | % | 13.66 | |||||||||||||||||||||||
| 2028 | 9 | 26,796 | 432 | 3.55 | % | 16.12 | 3 | 16,806 | 177 | 1.21 | % | 10.53 | |||||||||||||||||||||||
| 2029+ | 20 | 50,778 | 879 | 7.23 | % | 17.31 | 23 | 65,988 | 1,652 | 11.25 | % | 25.03 | |||||||||||||||||||||||
| Total | 389 | 1,360,846 | $ | 12,161 | 100.00 | % | $ | 13.47 | 285 | 1,094,192 | $ | 14,666 | 100.00 | % | $ | 13.40 | |||||||||||||||||||
WHLR | Financial & Operating Data | as of 9/30/2020 unless otherwise stated | 19 | ||||
| Three Months Ended September 30, | Nine Months Ended September 30, | ||||||||||||||||||||||
2020 (3) | 2019 | 2020 (3) | 2019 | ||||||||||||||||||||
Renewals(1): | |||||||||||||||||||||||
| Leases renewed with rate increase (sq feet) | 135,063 | 193,609 | 528,042 | 374,580 | |||||||||||||||||||
| Leases renewed with rate decrease (sq feet) | 53,398 | 1,040 | 89,133 | 31,196 | |||||||||||||||||||
| Leases renewed with no rate change (sq feet) | 182,039 | 141,650 | 246,245 | 150,233 | |||||||||||||||||||
| Total leases renewed (sq feet) | 370,500 | 336,299 | 863,420 | 556,009 | |||||||||||||||||||
| Leases renewed with rate increase (count) | 28 | 39 | 111 | 88 | |||||||||||||||||||
| Leases renewed with rate decrease (count) | 6 | 1 | 17 | 9 | |||||||||||||||||||
| Leases renewed with no rate change (count) | 20 | 6 | 38 | 11 | |||||||||||||||||||
| Total leases renewed (count) | 54 | 46 | 166 | 108 | |||||||||||||||||||
| Option exercised (count) | 8 | 15 | 17 | 28 | |||||||||||||||||||
| Weighted average on rate increases (per sq foot) | $ | 1.29 | $ | 0.73 | $ | 1.11 | $ | 0.77 | |||||||||||||||
| Weighted average on rate decreases (per sq foot) | $ | (0.72) | $ | (2.46) | $ | (1.14) | $ | (3.02) | |||||||||||||||
| Weighted average rate on all renewals (per sq foot) | $ | 0.37 | $ | 0.41 | $ | 0.56 | $ | 0.35 | |||||||||||||||
| Weighted average change over prior rates | 3.98 | % | 5.46 | % | 5.68 | % | 3.92 | % | |||||||||||||||
| Weighted average change over prior rates, excluding bankruptcy negotiations | 4.16 | % | 5.84 | % | |||||||||||||||||||
New Leases(1) (2): | |||||||||||||||||||||||
| New leases (sq feet) | 93,253 | 29,756 | 202,655 | 76,974 | |||||||||||||||||||
| New leases (count) | 18 | 11 | 48 | 30 | |||||||||||||||||||
| Weighted average rate (per sq foot) | $ | 8.58 | $ | 12.10 | $ | 9.89 | $ | 12.95 | |||||||||||||||
| Gross Leasable Area ("GLA") expiring during the next 3 months, including month-to-month leases | 3.69 | % | 2.86 | % | 3.69 | % | 2.86 | % | |||||||||||||||
WHLR | Financial & Operating Data | as of 9/30/2020 unless otherwise stated | 20 | ||||
WHLR | Financial & Operating Data | as of 9/30/2020 unless otherwise stated | 21 | ||||
WHLR | Financial & Operating Data | as of 9/30/2020 unless otherwise stated | 22 | ||||