Exhibit 99.2

Financial and Operating Results
For the three months ended March 31, 2020
Table of Contents | |
Page | |
Company Overview | |
Financial and Portfolio Overview | |
Financial and Operating Results | |
Financial Summary | |
Consolidated Balance Sheets | |
Consolidated Statements of Operations | |
Reconciliation of Non-GAAP Measures | |
Debt Summary | |
Portfolio Summary | |
Property Summary | |
Top Ten Tenants by Annualized Base Rent and Lease Expiration Schedule | |
Leasing Summary | |
Definitions | |
Forward-Looking Statements
This document contains forward-looking statements that are based on current expectations, forecasts and assumptions that involve risks and uncertainties that could cause actual outcomes and results to differ materially. These risks include, without limitation: adverse economic or real estate developments in the retail industry or the markets in which Wheeler Real Estate Investment Trust, Inc. operates; defaults on or non-renewal of leases by tenants; increased interest rates and operating costs; decreased rental rates or increased vacancy rates; Wheeler Real Estate Investment Trust, Inc.'s failure to obtain necessary outside financing on favorable terms or at all; Wheeler Real Estate Investment Trust, Inc.'s inability to successfully acquire, sell, or operate properties; and Wheeler Real Estate Investment Trust, Inc.'s failure to qualify or maintain its status as a REIT. Currently, one of the most significant factors, however, is the potential adverse effect of the current coronavirus, or COVID-19, on the financial condition, results of operations, cash flows and performance of the Company and its tenants, the real estate market and the global economy and financial markets. The extent to which COVID-19 impacts the Company and its tenants will depend on future developments, which are highly uncertain and cannot be predicted with confidence, including the scope, severity and duration of the pandemic, the actions taken to contain the pandemic or mitigate its impact, and the direct and indirect economic effects of the pandemic and containment measures, among others. For a description of such risks and uncertainties that could impact Wheeler Real Estate Investment Trust, Inc.'s future results, performance or transactions, see the reports filed by Wheeler Real Estate Investment Trust, Inc. with the Securities and Exchange Commission, including its quarterly reports on Form 10-Q and annual reports on Form 10-K. Wheeler Real Estate Investment Trust, Inc. disclaims any intention or obligation to update or revise any forward-looking statements, whether as a result of new information, future events or otherwise.
WHLR | Financial & Operating Data | 2 |
Company Overview
Headquartered in Virginia Beach, VA, Wheeler Real Estate Investment Trust, Inc. is a fully-integrated, self-managed commercial real estate investment company focused on owning and operating income-producing retail properties with a primary focus on grocery-anchored centers. Wheeler’s portfolio contains well-located, potentially dominant retail properties in secondary and tertiary markets that generate attractive, risk-adjusted returns. Wheeler’s common stock, Series B convertible preferred stock and Series D cumulative convertible preferred stock trade publicly on the Nasdaq under the symbols “WHLR”, “WHLRP” and "WHLRD", respectively.
Corporate Headquarters | |
Wheeler Real Estate Investment Trust, Inc. | |
Riversedge North | |
2529 Virginia Beach Boulevard Virginia Beach, VA 23452 | |
Phone: (757) 627-9088 Toll Free: (866) 203-4864 | |
Website: www.whlr.us | |
Executive Management | |
Daniel Khoshaba - CEO | |
Crystal Plum - CFO | |
M. Andrew Franklin - COO | |
Board of Directors | |
Daniel Khoshaba (CEO) | Kerry G. Campbell |
Andrew R. Jones | Deborah Markus |
Stefani D. Carter | Joseph D. Stilwell |
Clayton ("Chip") Andrews | Paula J. Poskon |
Investor Relations Contact | Transfer Agent and Registrar |
Mary Jensen mjensen@whlr.us 2529 Virginia Beach Boulevard Virginia Beach, VA 23452 Phone: (757) 627-9088 | Computershare Trust Company, N.A. 250 Royall Street Canton, MA 02021 www.computershare.com |
WHLR | Financial & Operating Data | 3 |
Financial and Portfolio Overview
Financial Results | |||
Net loss attributable to Wheeler REIT common shareholders (in 000s) | $ | (5,525 | ) |
Net loss per basic and diluted shares | $ | (0.57 | ) |
Funds from operations available to common shareholders and Operating Partnership (OP) unitholders (FFO) (in 000s) (1) | $ | 61 | |
FFO per common share and OP unit | $ | 0.01 | |
Adjusted FFO (AFFO) (in 000s) (1) | $ | 843 | |
AFFO per common share and OP unit | $ | 0.08 | |
Assets and Leverage | |||
Investment Properties, net of $52.76 million accumulated depreciation (in 000s) | $ | 406,815 | |
Cash and Cash Equivalents (in 000s) | $ | 6,695 | |
Total Assets (in 000s) | $ | 479,149 | |
Debt to Total Assets(3) | 71.89 | % | |
Debt to Gross Asset Value | 61.37 | % | |
Market Capitalization | |||
Common shares outstanding | 9,694,284 | ||
OP units outstanding | 234,019 | ||
Total common shares and OP units | 9,928,303 | ||
Shares Outstanding at March 31, 2020 | First Quarter stock price range | Stock price as of March 31, 2020 | ||||||
Common Stock | 9,694,284 | $0.64 - $1.88 | $ | 1.00 | ||||
Series B preferred shares | 1,875,748 | $3.63 - $13.09 | $ | 6.17 | ||||
Series D preferred shares | 3,600,636 | $4.50 - $15.58 | $ | 8.82 | ||||
Total debt (in 000s)(3) | $ | 344,470 | |
Common Stock market capitalization (as of March 31, 2020 closing stock price, in 000s) | $ | 9,694 | |
Portfolio Summary | |||
Total Leasable Area (GLA) in sq. ft. | 5,564,882 | ||
Occupancy Rate | 89.2 | % | |
Leased Rate (2) | 89.2 | % | |
Annualized Base Rent (in 000s) | $ | 48,085 | |
Total number of leases signed or renewed during the first quarter of 2020 | 55 | ||
Total sq. ft. leases signed or renewed during the first quarter of 2020 | 212,779 | ||
(1) See page 20 for the Company's definition of this non-GAAP measurement and reasons for using it.
(2) | Reflects leases executed through April 2, 2020 that commence subsequent to the end of current period. The leased rate is 89.8% including a 32,400 square foot space that became vacant in January 2020 and was re-leased subsequent to April 2, 2020. |
(3) Includes debt associated with assets held for sale.
WHLR | Financial & Operating Data | as of 3/31/2020 unless otherwise stated | 4 |
Financial and Operating Results
WHLR Real Estate Investment Trust, Inc. (NASDAQ:WHLR) (“WHLR” or the “Company”) today reported financial and operating results for the three months ended March 31, 2020.
2020 FIRST QUARTER HIGHLIGHTS
(all comparisons to the same prior year period unless otherwise noted)
• | Net loss attributable to WHLR's common stock, $0.01 par value per share ("Common Stock") shareholders of $5.5 million, or ($0.57) per share. |
• | Adjusted Funds from Operations ("AFFO") of $.08 per share of the Company's Common Stock and common unit ("Common Unit") in our operating partnership, Wheeler REIT, L.P. |
• | Total revenue from continuing operations decreased by 2.63% or $421 thousand primarily due to sold properties. |
• | Total operating expenses from continuing operations decreased by 3.11% or $385 thousand primarily due to a $1.0 million decrease in depreciation and amortization resulting from lease intangibles becoming fully amortized and sold properties and partially offset by a $600 thousand increase in impairment of assets held for sale. |
• | Executed 41 lease renewals totaling 185,157 square feet at a weighted-average increase of $0.94 per square foot, representing an increase of 8.60% over in-place rental rates. |
• | Signed 14 new leases totaling approximately 27,622 square feet with a weighted-average rental rate of $13.89 per square foot. |
• | Same store property revenues decreased 0.21%. |
• | Same store Net Operating Income ("NOI") decreased by 1.03% and by 0.31% on a cash basis. |
• | NOI from property operations decreased $385 thousand with same stores accounting for a decrease of $113 thousand, while non-same stores had a decrease of $272 thousand, resulting from the loss of NOI associated with sold properties. |
• | Paid down the KeyBank Credit Agreement to $9.3 million with proceeds from the following sources: |
• | $5.8 million from refinancing Shoppes at Myrtle Park; |
• | $1.8 million paydown from St. Matthews sale proceeds; and |
• | $1.1 million in monthly scheduled principal payments. |
• | Recognized $600 thousand in impairment charges on Columbia Fire Station, which is currently held for sale. |
• | $1.0 million in other expense, including $585 thousand in legal settlement costs and $439 thousand in reimbursement of the Stilwell Group's proxy solicitation expenses in connection with the Company's 2019 annual meeting of stockholders. |
COVID-19 UPDATE
During this time of crisis, WHLR is proactively contacting and communicating with its tenants to assist them during this difficult time. The Company continues to prioritize tenants’ requests based on the immediate and long-term impact to their businesses by evaluating all requests for rent relief on an individual basis and considering a number of factors. Not all tenant requests will ultimately result in modification agreements, nor is the Company forgoing its contractual rights under its lease agreements.
• | The Company’s 60 retail shopping centers are open and operating in compliance with federal, state and local COVID-19 guidelines and mandates. All of the Company’s shopping centers feature necessity-based tenants, with 45 of the 60 properties anchored by grocery and/or drug stores. |
• | Approximately 86% of the Company’s tenants are open and operating. |
• | The Company has received payment of approximately 72% of contractual base rent and tenant reimbursement billed for the month of April. |
• | Of those with April rent in arrears, 38% are considered to be national retailers. |
• | The Company agreed to relief agreements with 236 tenants, primarily in the form of a rent deferral, representing approximately 4% of annual base rent. |
• | Our geographical location by state is depicted on page 16. The Southeast and Mid-Atlantic regions represent 61% and 35%, respectively, of the total annualized base rent. 35 properties are in Georgia and South Carolina, which have seen loosening of COVID-19 guidelines and mandates. |
WHLR | Financial & Operating Data | as of 3/31/2020 unless otherwise stated | 5 |
• | Additionally, as a result of COVID-19 the Company has been granted forbearance on 8 loans resulting in deferral of approximately $928 thousand in principal and interest payments. |
BALANCE SHEET
• | Cash and cash equivalents totaled $6.7 million at March 31, 2020, compared to $5.5 million at December 31, 2019. |
• | Restricted cash totaled $16.5 million at March 31, 2020, compared to $16.1 million at December 31, 2019. These funds are held in lender reserves for the purpose of tenant improvements, lease commissions, real estate taxes and insurance expenses. |
• | Total debt was $344.5 million at March 31, 2020 (including debt associated with assets held for sale), compared to $347.1 million at December 31, 2019. |
• | WHLR's weighted-average interest rate was 4.68% with a term of 4.19 years at March 31, 2020 (including debt associated with assets held for sale). |
• | Net investment properties as of March 31, 2020 totaled $413.0 million (including assets held for sale), compared to $417.9 million as of December 31, 2019. |
DIVIDENDS
• | At March 31, 2020, the Company had accumulated undeclared dividends of approximately $20.5 million to holders of shares of our Series A Preferred Stock, Series B Preferred Stock, and Series D Preferred Stock of which $3.5 million is attributable to the three months ended March 31, 2020. |
SUBSEQUENT EVENTS
• | On April 28, 2020, the Company received loan proceeds of $552 thousand (the “Loan”) pursuant to the Paycheck Protection Program (the “PPP”) under the Coronavirus Aid, Relief, and Economic Security (“CARES”) Act. The Loan bears interest at a fixed rate of 1% per annum, payable monthly commencing in seven months. Under the terms of the PPP, the principal may be forgiven if the Loan proceeds are used for qualifying expenses as described in the CARES Act, such as payroll costs, mortgage interest, rent, and utilities. No assurance can be provided that the Company will obtain forgiveness of the Loan in whole or in part. |
• | On April 13, 2020, Daniel Khoshaba was appointed Chief Executive Officer of the Company and is not receiving a salary, a savings of $400 thousand annually. |
• | On April 30, 2020, the Company extended the maturity date on the Rivergate loan to June 20, 2020 from March 20, 2020 and in tandem Synovus Bank agreed to defer all payments until June 20, 2020. |
• | On May 4, 2020, the Company extended the $4.0 million Columbia Fire Station promissory note to September 3, 2020, with principal and interest payments due monthly starting on July 3, 2020 in the amount of $26 thousand. |
• | The Company entered into a non-binding term sheet (the "Term Sheet") to extend the $5.29 million Tuckernuck promissory note ("Tuckernuck Loan") to August 1, 2020. The Term Sheet is not a binding commitment and will be superseded by a formal contract amendment, subject to customary closing conditions. |
• | Although the Company has made and continues to make the required monthly principal payments, the Company did not meet the April 30, 2020 required outstanding balance paydown. The Company remains in negotiations with KeyBank to extend the maturity date to December 31, 2020. Additionally, KeyBank has agreed to allow the Company to retain the $1.26 million in proceeds received from the Folly Road refinance during negotiations. As of May 12, 2020, the balance on the KeyBank Credit Agreement is $8.60 million. |
OPERATIONS AND LEASING
• | The Company's real estate portfolio is 89.2% leased as of March 31, 2020. The leased rate was 89.8% as of April 17, 2020, which includes a 32,400 square foot space that became vacant in January 2020 and was re-leased. |
• | Executed 41 lease renewals totaling 185,157 square feet at a weighted-average increase of $0.94 per square foot, representing an increase of 8.60% over in-place rental rates. |
• | Signed 14 new leases totaling approximately 27,622 square feet with a weighted-average rental rate of $13.89 per square foot. |
WHLR | Financial & Operating Data | as of 3/31/2020 unless otherwise stated | 6 |
• | The Company’s gross leasable area ("GLA"), which is subject to leases that expire over the next nine months and includes month-to-month leases, increased to approximately 9.33% at March 31, 2020, compared to 5.75% at March 31, 2019. At March 31, 2020, 38.14% of this expiring GLA is subject to renewal options (please see lease expiration schedule on page 17 of this document). |
SAME STORE RESULTS
The same store property pool includes those properties owned during all periods presented in their entirety, while the non-same stores property pool consists of those properties acquired or disposed of during the periods presented.
• | Same store NOI for the three months ended March 31, 2020 compared to March 31, 2019, decreased by 1.03% and 0.31% on a cash basis. Same store results were impacted by a 1.7% increase in property expenses, primarily due to increased repairs and maintenance partially offset by a decrease to grounds and landscaping expenses. |
DISPOSITIONS
• | Sold St. Matthews for a contract price of $1.8 million, generating a loss of $26 thousand and net proceeds of $1.7 million. |
ADDITIONAL INFORMATION
The enclosed information should be read in conjunction with the Company's filings with the Securities and Exchange Commission, including, but not limited to, its quarterly and annual filings on Forms 10-Q and 10-K.
These documents are or will be available upon filing via the U.S. Securities and Exchange Commission website (www.sec.gov) or through Wheeler’s website at www.whlr.us.
WHLR | Financial & Operating Data | as of 3/31/2020 unless otherwise stated | 7 |
Consolidated Balance Sheets
$ in 000s
March 31, 2020 | December 31, 2019 | ||||||
(unaudited) | |||||||
ASSETS: | |||||||
Investment properties, net | $ | 406,815 | $ | 416,215 | |||
Cash and cash equivalents | 6,695 | 5,451 | |||||
Restricted cash | 16,543 | 16,140 | |||||
Rents and other tenant receivables, net | 6,126 | 6,905 | |||||
Assets held for sale | 6,258 | 1,737 | |||||
Above market lease intangibles, net | 4,832 | 5,241 | |||||
Operating lease right-of-use assets | 11,603 | 11,651 | |||||
Deferred costs and other assets, net | 20,277 | 21,025 | |||||
Total Assets | $ | 479,149 | $ | 484,365 | |||
LIABILITIES: | |||||||
Loans payable, net | $ | 336,277 | $ | 340,913 | |||
Liabilities associated with assets held for sale | 4,049 | 2,026 | |||||
Below market lease intangibles, net | 6,035 | 6,716 | |||||
Operating lease liabilities | 11,920 | 11,921 | |||||
Accounts payable, accrued expenses and other liabilities | 9,513 | 9,557 | |||||
Total Liabilities | 367,794 | 371,133 | |||||
Series D Cumulative Convertible Preferred Stock (no par value, 4,000,000 shares authorized, 3,600,636 shares issued and outstanding; $104.08 million and $101.66 million aggregate liquidation preference, respectively) | 89,792 | 87,225 | |||||
EQUITY: | |||||||
Series A Preferred Stock (no par value, 4,500 shares authorized, 562 shares issued and outstanding) | 453 | 453 | |||||
Series B Convertible Preferred Stock (no par value, 5,000,000 authorized, 1,875,748 shares issued and outstanding; $46.90 million aggregate liquidation preference) | 41,109 | 41,087 | |||||
Common Stock ($0.01 par value, 18,750,000 shares authorized, 9,694,284 shares issued and outstanding) | 97 | 97 | |||||
Additional paid-in capital | 233,870 | 233,870 | |||||
Accumulated deficit | (256,037 | ) | (251,580 | ) | |||
Total Shareholders’ Equity | 19,492 | 23,927 | |||||
Noncontrolling interests | 2,071 | 2,080 | |||||
Total Equity | 21,563 | 26,007 | |||||
Total Liabilities and Equity | $ | 479,149 | $ | 484,365 | |||
WHLR | Financial & Operating Data | 8 |
Consolidated Statements of Operations
$ in 000s
Three Months Ended March 31, | |||||||
2020 | 2019 | ||||||
REVENUE: | |||||||
Rental revenues | $ | 15,355 | $ | 15,770 | |||
Other revenues | 219 | 225 | |||||
Total Revenue | 15,574 | 15,995 | |||||
OPERATING EXPENSES: | |||||||
Property operations | 4,723 | 4,726 | |||||
Non-REIT management and leasing services | — | 23 | |||||
Depreciation and amortization | 4,799 | 5,816 | |||||
Impairment of assets held for sale | 600 | — | |||||
Corporate general & administrative | 1,872 | 1,814 | |||||
Total Operating Expenses | 11,994 | 12,379 | |||||
(Loss) gain on disposal of properties | (26 | ) | 1,839 | ||||
Operating Income | 3,554 | 5,455 | |||||
Interest income | 1 | 1 | |||||
Interest expense | (4,400 | ) | (4,793 | ) | |||
Other expense | (1,024 | ) | — | ||||
Net (Loss) Income Before Income Taxes | (1,869 | ) | 663 | ||||
Income tax expense | (8 | ) | (8 | ) | |||
Net (Loss) Income | (1,877 | ) | 655 | ||||
Less: Net (loss) income income attributable to noncontrolling interests | (9 | ) | 13 | ||||
Net (Loss) Income Attributable to Wheeler REIT | (1,868 | ) | 642 | ||||
Preferred Stock dividends - undeclared | (3,657 | ) | (3,657 | ) | |||
Net Loss Attributable to Wheeler REIT Common Shareholders | $ | (5,525 | ) | $ | (3,015 | ) | |
Loss per share: | |||||||
Basic and Diluted | $ | (0.57 | ) | $ | (0.31 | ) | |
Weighted-average number of shares: | |||||||
Basic and Diluted | 9,694,284 | 9,606,249 | |||||
WHLR | Financial & Operating Data | 9 |
Reconciliation of Non-GAAP Measures
FFO and AFFO (1)
$ in 000s
Three Months Ended March 31, | ||||||||
2020 | 2019 | |||||||
Net (Loss) Income | $ | (1,877 | ) | $ | 655 | |||
Depreciation and amortization of real estate assets | 4,799 | 5,816 | ||||||
Loss (Gain) on disposal of properties | 26 | (1,839 | ) | |||||
Impairment of assets held for sale | 600 | — | ||||||
FFO | 3,548 | 4,632 | ||||||
Preferred stock dividends undeclared | (3,657 | ) | (3,657 | ) | ||||
Preferred stock accretion adjustments | 170 | 170 | ||||||
FFO available to common shareholders and common unitholders | 61 | 1,145 | ||||||
Acquisition and development costs | 1 | 4 | ||||||
Capital related costs | 4 | 74 | ||||||
Other non-recurring and non-cash expenses (2) | 1,024 | 24 | ||||||
Share-based compensation | — | 90 | ||||||
Straight-line rental revenue, net straight-line expense | (5 | ) | (155 | ) | ||||
Loan cost amortization | 310 | 392 | ||||||
Above (below) market lease amortization | (273 | ) | (226 | ) | ||||
Recurring capital expenditures and tenant improvement reserves | (279 | ) | (284 | ) | ||||
AFFO | $ | 843 | $ | 1,064 | ||||
Weighted Average Common Shares | 9,694,284 | 9,606,249 | ||||||
Weighted Average Common Units | 234,019 | 235,032 | ||||||
Total Common Shares and Units | 9,928,303 | 9,841,281 | ||||||
FFO per Common Share and Common Units | $ | 0.01 | $ | 0.12 | ||||
AFFO per Common Share and Common Units | $ | 0.08 | $ | 0.11 | ||||
(1) | See page 20 for the Company's definition of this non-GAAP measurement and reasons for using it. |
(2) | Other non-recurring expenses are described in "Management's Discussion and Analysis of Financial Condition and Results of Operations" included in our Quarterly Report on Form 10-Q for the three months ended March 31, 2020. |
WHLR | Financial & Operating Data | 10 |
Reconciliation of Non-GAAP Measures (continued)
Property Net Operating Income (1)
$ in 000s
Three Months Ended March 31, | |||||||||||||||||||||||
Same Store | Non-same Store | Total | |||||||||||||||||||||
2020 | 2019 | 2020 | 2019 | 2020 | 2019 | ||||||||||||||||||
Net (Loss) Income | $ | (1,844 | ) | $ | (1,213 | ) | $ | (33 | ) | $ | 1,868 | $ | (1,877 | ) | $ | 655 | |||||||
Adjustments: | |||||||||||||||||||||||
Income tax expense | 8 | 8 | — | — | 8 | 8 | |||||||||||||||||
Other expense | 1,024 | — | — | — | 1,024 | — | |||||||||||||||||
Interest expense | 4,400 | 4,623 | — | 170 | 4,400 | 4,793 | |||||||||||||||||
Interest income | (1 | ) | (1 | ) | — | — | (1 | ) | (1 | ) | |||||||||||||
Loss (gain) on disposal of properties | — | — | 26 | (1,839 | ) | 26 | (1,839 | ) | |||||||||||||||
Corporate general & administrative | 1,871 | 1,808 | 1 | 6 | 1,872 | 1,814 | |||||||||||||||||
Impairment of assets held for sale | 600 | — | — | — | 600 | — | |||||||||||||||||
Depreciation and amortization | 4,799 | 5,755 | — | 61 | 4,799 | 5,816 | |||||||||||||||||
Non-REIT management and leasing services | — | 23 | — | — | — | 23 | |||||||||||||||||
Asset management and commission revenues | (22 | ) | (55 | ) | — | — | (22 | ) | (55 | ) | |||||||||||||
Property Net Operating Income | $ | 10,835 | $ | 10,948 | $ | (6 | ) | $ | 266 | $ | 10,829 | $ | 11,214 | ||||||||||
Property revenues | $ | 15,542 | $ | 15,575 | $ | 10 | $ | 365 | $ | 15,552 | $ | 15,940 | |||||||||||
Property expenses | 4,707 | 4,627 | 16 | 99 | 4,723 | 4,726 | |||||||||||||||||
Property Net Operating Income | $ | 10,835 | $ | 10,948 | $ | (6 | ) | $ | 266 | $ | 10,829 | $ | 11,214 | ||||||||||
(1) | See page 21 for the Company's definition of this non-GAAP measurement and reasons for using it. |
WHLR | Financial & Operating Data | 11 |
Reconciliation of Non-GAAP Measures (continued)
EBITDA (4)
$ in 000s
Three Months Ended March 31, | ||||||||
2020 | 2019 | |||||||
Net (Loss) Income | $ | (1,877 | ) | $ | 655 | |||
Add back: | Depreciation and amortization (1) | 4,526 | 5,590 | |||||
Interest Expense (2) | 4,400 | 4,793 | ||||||
Income tax expense | 8 | 8 | ||||||
EBITDA | 7,057 | 11,046 | ||||||
Adjustments for items affecting comparability: | ||||||||
Acquisition and development costs | 1 | 4 | ||||||
Capital related costs | 4 | 74 | ||||||
Other non-recurring and non-cash expenses (3) | 1,024 | 24 | ||||||
Impairment of assets held for sale | 600 | — | ||||||
Loss (Gain) on disposal of properties | 26 | (1,839 | ) | |||||
Adjusted EBITDA | $ | 8,712 | $ | 9,309 | ||||
(1) | Includes above (below) market lease amortization. |
(2) | Includes loan cost amortization. |
(3) | Other non-recurring expenses are described in "Management's Discussion and Analysis of Financial Condition and Results of Operations" included in our Quarterly Report on Form 10-Q for the period ended March 31, 2020. |
(4) | See page 20 for the Company's definition of this non-GAAP measurement and reasons for using it. |
WHLR | Financial & Operating Data | 12 |
Debt Summary
$ in 000s
Loans Payable: | $344.47 million |
Weighted Average Interest Rate: | 4.68% |
Property/Description | Monthly Payment | Interest Rate | Maturity | March 31, 2020 | December 31, 2019 | ||||||||||||
KeyBank Credit Agreement (6) | $ | 350,000 | LIBOR + 350 basis points | Various (6) | $ | 9,300 | $ | 17,879 | |||||||||
Rivergate | $ | 127,267 | LIBOR + 295 basis points | March 2020 | 21,402 | 21,545 | |||||||||||
Columbia Fire Station (1) | $ | 25,452 | 4.00 | % | May 2020 | 4,015 | 4,051 | ||||||||||
Tuckernuck | $ | 33,880 | 3.88 | % | May 2020 | 5,294 | 5,344 | ||||||||||
First National Bank Line of Credit (7) | $ | 24,656 | LIBOR + 300 basis points | September 2020 | 1,156 | 1,214 | |||||||||||
Lumber River | $ | 10,723 | LIBOR + 350 basis points | October 2020 | 1,390 | 1,404 | |||||||||||
JANAF Bravo | $ | 36,935 | 4.65 | % | January 2021 | 6,336 | 6,372 | ||||||||||
Walnut Hill Plaza | $ | 26,850 | 5.50 | % | September 2022 | 3,730 | 3,759 | ||||||||||
Litchfield Market Village | $ | 46,057 | 5.50 | % | November 2022 | 7,418 | 7,452 | ||||||||||
Twin City Commons | $ | 17,827 | 4.86 | % | January 2023 | 2,966 | 2,983 | ||||||||||
New Market | $ | 48,747 | 5.65 | % | June 2023 | 6,663 | 6,713 | ||||||||||
Benefit Street Note (3) | $ | 53,185 | 5.71 | % | June 2023 | 7,308 | 7,361 | ||||||||||
Deutsche Bank Note (2) | $ | 33,340 | 5.71 | % | July 2023 | 5,624 | 5,642 | ||||||||||
JANAF | $ | 333,159 | 4.49 | % | July 2023 | 50,173 | 50,599 | ||||||||||
Tampa Festival | $ | 50,797 | 5.56 | % | September 2023 | 8,038 | 8,077 | ||||||||||
Forrest Gallery | $ | 50,973 | 5.40 | % | September 2023 | 8,342 | 8,381 | ||||||||||
Riversedge North | $ | 11,436 | 5.77 | % | December 2023 | 1,758 | 1,767 | ||||||||||
South Carolina Food Lions Note (5) | $ | 68,320 | 5.25 | % | January 2024 | 11,624 | 11,675 | ||||||||||
Cypress Shopping Center | $ | 34,360 | 4.70 | % | July 2024 | 6,239 | 6,268 | ||||||||||
Port Crossing | $ | 34,788 | 4.84 | % | August 2024 | 6,002 | 6,032 | ||||||||||
Freeway Junction | $ | 41,798 | 4.60 | % | September 2024 | 7,690 | 7,725 | ||||||||||
Harrodsburg Marketplace | $ | 19,112 | 4.55 | % | September 2024 | 3,398 | 3,416 | ||||||||||
Bryan Station | $ | 23,489 | 4.52 | % | November 2024 | 4,373 | 4,394 | ||||||||||
Crockett Square | Interest only | 4.47 | % | December 2024 | 6,338 | 6,338 | |||||||||||
Pierpont Centre | $ | 39,435 | 4.15 | % | February 2025 | 8,100 | 8,113 | ||||||||||
Shoppes at Myrtle Park | $ | 33,180 | 4.45 | % | February 2025 | 5,988 | — | ||||||||||
Folly Road | $ | 41,482 | 4.65 | % | March 2025 | 7,350 | 5,922 | ||||||||||
Alex City Marketplace | Interest only | 3.95 | % | April 2025 | 5,750 | 5,750 | |||||||||||
Butler Square | Interest only | 3.90 | % | May 2025 | 5,640 | 5,640 | |||||||||||
Brook Run Shopping Center | Interest only | 4.08 | % | June 2025 | 10,950 | 10,950 | |||||||||||
Beaver Ruin Village I and II | Interest only | 4.73 | % | July 2025 | 9,400 | 9,400 | |||||||||||
Sunshine Shopping Plaza | Interest only | 4.57 | % | August 2025 | 5,900 | 5,900 | |||||||||||
Barnett Portfolio (4) | Interest only | 4.30 | % | September 2025 | 8,770 | 8,770 | |||||||||||
Fort Howard Shopping Center | Interest only | 4.57 | % | October 2025 | 7,100 | 7,100 | |||||||||||
Conyers Crossing | Interest only | 4.67 | % | October 2025 | 5,960 | 5,960 | |||||||||||
Grove Park Shopping Center | Interest only | 4.52 | % | October 2025 | 3,800 | 3,800 | |||||||||||
Parkway Plaza | Interest only | 4.57 | % | October 2025 | 3,500 | 3,500 | |||||||||||
Winslow Plaza | $ | 41,482 | 4.82 | % | December 2025 | 4,603 | 4,620 | ||||||||||
JANAF BJ's | $ | 29,964 | 4.95 | % | January 2026 | 4,929 | 4,957 | ||||||||||
Chesapeake Square | $ | 23,857 | 4.70 | % | August 2026 | 4,336 | 4,354 | ||||||||||
Berkley/Sangaree/Tri-County | Interest only | 4.78 | % | December 2026 | 9,400 | 9,400 | |||||||||||
Riverbridge | Interest only | 4.48 | % | December 2026 | 4,000 | 4,000 | |||||||||||
Franklin Village | $ | 45,336 | 4.93 | % | January 2027 | 8,494 | 8,516 | ||||||||||
Village of Martinsville | $ | 89,664 | 4.28 | % | July 2029 | 16,258 | 16,351 | ||||||||||
Laburnum Square | Interest only | 4.28 | % | September 2029 | 7,665 | 7,665 | |||||||||||
Total Principal Balance (1) | 344,470 | 347,059 | |||||||||||||||
Unamortized debt issuance cost (1) | (4,189 | ) | (4,172 | ) | |||||||||||||
Total Loans Payable, including assets held for sale | 340,281 | 342,887 | |||||||||||||||
Less loans payable on assets held for sale, net loan amortization costs | 4,004 | 1,974 | |||||||||||||||
Total Loans Payable, net | $ | 336,277 | $ | 340,913 | |||||||||||||
(1) Includes loans payable on assets held for sale.
(2) Collateralized by LaGrange Marketplace, Ridgeland and Georgetown.
(3) Collateralized by Ladson Crossing, Lake Greenwood Crossing and South Park.
(4) Collateralized by Cardinal Plaza, Franklinton Square, and Nashville Commons.
(5) Collateralized by Clover Plaza, South Square, St. George, Waterway Plaza and Westland Square.
(6) Collateralized by Darien Shopping Center, Devine Street, Lake Murray, Moncks Corner and South Lake. The various maturity dates are disclosed within Note 5 included in our Quarterly Report on Form 10-Q for the three months ended March 31, 2020, under the KeyBank Credit Agreement.
(7) Collateralized by Surrey Plaza and Amscot Building.
WHLR | Financial & Operating Data | as of 3/31/2020 unless otherwise stated | 13 |
Debt Summary (continued)
Total Debt
$ in 000s
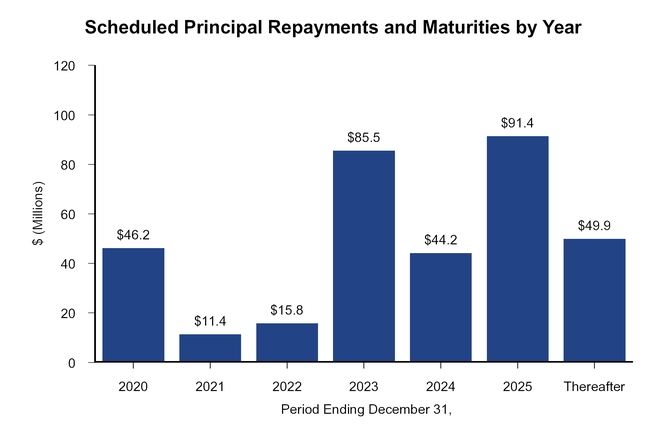
Scheduled principal repayments and maturities by year | Amount | % Total Principal Payments and Maturities | |||||
For the remaining nine months ended December 31, 2020 | $ | 46,171 | 13.40 | % | |||
December 31, 2021 | 11,394 | 3.31 | % | ||||
December 31, 2022 | 15,848 | 4.60 | % | ||||
December 31, 2023 | 85,537 | 24.83 | % | ||||
December 31, 2024 | 44,240 | 12.84 | % | ||||
December 31, 2025 | 91,426 | 26.54 | % | ||||
Thereafter | 49,854 | 14.48 | % | ||||
Total principal repayments and debt maturities | $ | 344,470 | 100.00 | % | |||
WHLR | Financial & Operating Data | as of 3/31/2020 unless otherwise stated | 14 |
Property Summary
Property | Location | Number of Tenants (1) | Total Leasable Square Feet | Percentage Leased (1) | Percentage Occupied | Total SF Occupied | Annualized Base Rent (in 000's) (2) | Annualized Base Rent per Occupied Sq. Foot | |||||||||||
Alex City Marketplace | Alexander City, AL | 17 | 147,791 | 96.8 | % | 96.8 | % | 142,991 | $ | 1,148 | $ | 8.03 | |||||||
Amscot Building (3) | Tampa, FL | 1 | 2,500 | 100.0 | % | 100.0 | % | 2,500 | 83 | 33.00 | |||||||||
Beaver Ruin Village | Lilburn, GA | 28 | 74,038 | 90.4 | % | 90.4 | % | 66,948 | 1,148 | 17.15 | |||||||||
Beaver Ruin Village II | Lilburn, GA | 4 | 34,925 | 100.0 | % | 100.0 | % | 34,925 | 453 | 12.96 | |||||||||
Berkley (4) | Norfolk, VA | — | — | — | % | — | % | — | — | — | |||||||||
Berkley Shopping Center | Norfolk, VA | 10 | 47,945 | 42.0 | % | 42.0 | % | 20,140 | 245 | 12.18 | |||||||||
Brook Run Shopping Center | Richmond, VA | 19 | 147,738 | 92.2 | % | 92.2 | % | 136,187 | 1,402 | 10.29 | |||||||||
Brook Run Properties (4) | Richmond, VA | — | — | — | % | — | % | — | — | — | |||||||||
Bryan Station | Lexington, KY | 10 | 54,397 | 100.0 | % | 100.0 | % | 54,397 | 597 | 10.97 | |||||||||
Butler Square | Mauldin, SC | 14 | 82,400 | 87.6 | % | 87.6 | % | 72,196 | 775 | 10.74 | |||||||||
Cardinal Plaza | Henderson, NC | 9 | 50,000 | 100.0 | % | 100.0 | % | 50,000 | 479 | 9.58 | |||||||||
Chesapeake Square | Onley, VA | 12 | 108,982 | 96.5 | % | 96.5 | % | 105,182 | 795 | 7.56 | |||||||||
Clover Plaza | Clover, SC | 10 | 45,575 | 100.0 | % | 100.0 | % | 45,575 | 366 | 8.03 | |||||||||
Columbia Fire Station | Columbia, SC | 3 | 21,273 | 77.3 | % | 77.3 | % | 16,450 | 450 | 27.35 | |||||||||
Courtland Commons (4) | Courtland, VA | — | — | — | % | — | % | — | — | — | |||||||||
Conyers Crossing | Conyers, GA | 12 | 170,475 | 97.1 | % | 97.1 | % | 165,475 | 876 | 5.29 | |||||||||
Crockett Square | Morristown, TN | 4 | 107,122 | 100.0 | % | 100.0 | % | 107,122 | 920 | 8.59 | |||||||||
Cypress Shopping Center | Boiling Springs, SC | 17 | 80,435 | 41.2 | % | 41.2 | % | 33,175 | 448 | 13.51 | |||||||||
Darien Shopping Center | Darien, GA | 1 | 26,001 | 100.0 | % | 100.0 | % | 26,001 | 156 | 6.00 | |||||||||
Devine Street | Columbia, SC | 2 | 38,464 | 100.0 | % | 100.0 | % | 38,464 | 319 | 8.28 | |||||||||
Edenton Commons (4) | Edenton, NC | — | — | — | % | — | % | — | — | — | |||||||||
Folly Road | Charleston, SC | 5 | 47,794 | 100.0 | % | 100.0 | % | 47,794 | 729 | 15.25 | |||||||||
Forrest Gallery | Tullahoma, TN | 27 | 214,451 | 95.5 | % | 95.5 | % | 204,804 | 1,418 | 6.92 | |||||||||
Fort Howard Shopping Center | Rincon, GA | 19 | 113,652 | 95.1 | % | 95.1 | % | 108,120 | 923 | 8.53 | |||||||||
Freeway Junction | Stockbridge, GA | 18 | 156,834 | 99.1 | % | 99.1 | % | 155,343 | 1,265 | 8.14 | |||||||||
Franklin Village | Kittanning, PA | 27 | 151,821 | 97.4 | % | 97.4 | % | 147,821 | 1,255 | 8.49 | |||||||||
Franklinton Square | Franklinton, NC | 13 | 65,366 | 93.0 | % | 93.0 | % | 60,800 | 572 | 9.40 | |||||||||
Georgetown | Georgetown, SC | 2 | 29,572 | 100.0 | % | 100.0 | % | 29,572 | 267 | 9.04 | |||||||||
Grove Park | Orangeburg, SC | 13 | 93,265 | 99.4 | % | 98.4 | % | 91,741 | 719 | 7.83 | |||||||||
Harbor Point (4) | Grove, OK | — | — | — | % | — | % | — | — | — | |||||||||
Harrodsburg Marketplace | Harrodsburg, KY | 6 | 60,048 | 79.0 | % | 79.0 | % | 47,448 | 402 | 8.48 | |||||||||
JANAF (6) | Norfolk, VA | 111 | 800,026 | 85.3 | % | 85.3 | % | 682,160 | 8,217 | 12.05 | |||||||||
Laburnum Square | Richmond, VA | 20 | 109,405 | 97.5 | % | 97.5 | % | 106,705 | 975 | 9.14 | |||||||||
Ladson Crossing | Ladson, SC | 15 | 52,607 | 100.0 | % | 100.0 | % | 52,607 | 499 | 9.49 | |||||||||
LaGrange Marketplace | LaGrange, GA | 11 | 76,594 | 88.3 | % | 88.3 | % | 67,594 | 378 | 5.59 | |||||||||
Lake Greenwood Crossing | Greenwood, SC | 6 | 47,546 | 87.5 | % | 87.5 | % | 41,618 | 331 | 7.96 | |||||||||
Lake Murray | Lexington, SC | 5 | 39,218 | 100.0 | % | 100.0 | % | 39,218 | 258 | 6.57 | |||||||||
Litchfield Market Village | Pawleys Island, SC | 18 | 86,740 | 87.9 | % | 87.9 | % | 76,263 | 931 | 12.20 | |||||||||
Lumber River Village | Lumberton, NC | 11 | 66,781 | 98.2 | % | 98.2 | % | 65,581 | 451 | 6.88 | |||||||||
Moncks Corner | Moncks Corner, SC | 1 | 26,800 | 100.0 | % | 100.0 | % | 26,800 | 323 | 12.07 | |||||||||
Nashville Commons | Nashville, NC | 12 | 56,100 | 100.0 | % | 100.0 | % | 56,100 | 604 | 10.76 | |||||||||
New Market Crossing | Mt. Airy, NC | 13 | 117,076 | 96.0 | % | 96.0 | % | 112,368 | 1,000 | 8.90 | |||||||||
Parkway Plaza | Brunswick, GA | 4 | 52,365 | 81.7 | % | 81.7 | % | 42,785 | 350 | 8.18 | |||||||||
Pierpont Centre | Morgantown, WV | 17 | 111,162 | 97.2 | % | 97.2 | % | 108,001 | 1,210 | 11.21 | |||||||||
Port Crossing | Harrisonburg, VA | 8 | 65,365 | 97.9 | % | 97.9 | % | 64,000 | 847 | 13.23 | |||||||||
Ridgeland | Ridgeland, SC | 1 | 20,029 | 100.0 | % | 100.0 | % | 20,029 | 140 | 7.00 | |||||||||
Riverbridge Shopping Center | Carrollton, GA | 11 | 91,188 | 100.0 | % | 98.5 | % | 89,788 | 695 | 7.74 | |||||||||
Riversedge North (5) | Virginia Beach, VA | — | — | — | % | — | % | — | — | — | |||||||||
Rivergate Shopping Center | Macon, GA | 30 | 201,680 | 96.6 | % | 96.6 | % | 194,819 | 2,830 | 14.53 | |||||||||
Sangaree Plaza | Summerville, SC | 8 | 66,948 | 87.4 | % | 87.4 | % | 58,498 | 597 | 10.20 | |||||||||
WHLR | Financial & Operating Data | as of 3/31/2020 unless otherwise stated | 15 |
Property Summary (continued)
Property | Location | Number of Tenants (1) | Total Leasable Square Feet | Percentage Leased (1) | Percentage Occupied | Total SF Occupied | Annualized Base Rent (in 000's) (2) | Annualized Base Rent per Occupied Sq. Foot | |||||||||||
Shoppes at Myrtle Park | Bluffton, SC | 13 | 56,601 | 99.3 | % | 99.3 | % | 56,181 | $ | 665 | $ | 11.83 | |||||||
South Lake | Lexington, SC | 5 | 44,318 | 14.2 | % | 14.2 | % | 6,300 | 91 | 14.37 | |||||||||
South Park | Mullins, SC | 3 | 60,734 | 83.2 | % | 83.2 | % | 50,509 | 351 | 6.95 | |||||||||
South Square | Lancaster, SC | 5 | 44,350 | 74.2 | % | 74.2 | % | 32,900 | 275 | 8.37 | |||||||||
St. George Plaza | St. George, SC | 5 | 59,279 | 78.8 | % | 78.8 | % | 46,718 | 316 | 6.76 | |||||||||
Sunshine Plaza | Lehigh Acres, FL | 22 | 111,189 | 98.2 | % | 98.2 | % | 109,186 | 1,015 | 9.30 | |||||||||
Surrey Plaza | Hawkinsville, GA | 3 | 42,680 | 96.5 | % | 96.5 | % | 41,180 | 247 | 6.00 | |||||||||
Tampa Festival | Tampa, FL | 16 | 137,987 | 63.8 | % | 63.8 | % | 87,966 | 664 | 7.55 | |||||||||
Tri-County Plaza | Royston, GA | 6 | 67,577 | 88.8 | % | 88.8 | % | 59,977 | 393 | 6.56 | |||||||||
Tuckernuck | Richmond, VA | 12 | 93,624 | 53.5 | % | 53.5 | % | 50,063 | 715 | 14.28 | |||||||||
Tulls Creek (4) | Moyock, NC | — | — | — | % | — | % | — | — | — | |||||||||
Twin City Commons | Batesburg-Leesville, SC | 5 | 47,680 | 100.0 | % | 100.0 | % | 47,680 | 435 | 9.12 | |||||||||
Village of Martinsville | Martinsville, VA | 18 | 297,950 | 96.2 | % | 96.2 | % | 286,494 | 2,257 | 7.88 | |||||||||
Walnut Hill Plaza | Petersburg, VA | 6 | 87,239 | 38.1 | % | 38.1 | % | 33,225 | 268 | 8.06 | |||||||||
Waterway Plaza | Little River, SC | 10 | 49,750 | 100.0 | % | 100.0 | % | 49,750 | 489 | 9.83 | |||||||||
Westland Square | West Columbia, SC | 8 | 62,735 | 74.4 | % | 74.4 | % | 46,690 | 429 | 9.20 | |||||||||
Winslow Plaza | Sicklerville, NJ | 18 | 40,695 | 100.0 | % | 100.0 | % | 40,695 | 629 | 15.47 | |||||||||
Total Portfolio | 760 | 5,564,882 | 89.2 | % | 89.2 | % | 4,961,619 | $ | 48,085 | $ | 9.69 | ||||||||
(1) | Reflects leases executed through April 2, 2020 that commence subsequent to the end of current period. The leased rate was 89.8% as of April 17, 2020, which includes a 32,400 square foot space that became vacant in January 2020 and was re-leased. |
(2) | Annualized based rent per occupied square foot, assumes base rent as of the end of the current reporting period, excludes the impact of tenant concessions and rent abatements. |
(3) | We own the Amscot building, but we do not own the land underneath the buildings and instead lease the land pursuant to ground leases. As discussed in the financial statements, these ground leases require us to make annual rental payments and contain escalation clauses and renewal options. |
(4) | This information is not available because the property is undeveloped. |
(5) | This property is our corporate headquarters that we 100% occupy. |
(6) | Square footage is net of management office the Company occupies on premise and buildings on ground lease which the Company only leases the land. |
WHLR | Financial & Operating Data | as of 3/31/2020 unless otherwise stated | 16 |
Top Ten Tenants by Annualized Base Rent
Total Tenants : 760
Tenants | Annualized Base Rent ($ in 000s) | % of Total Annualized Base Rent | Total Occupied Square Feet | Percent Total Leasable Square Foot | Base Rent Per Occupied Square Foot | |||||||||||||
1. | BI-LO (1) | $ | 2,717 | 5.65 | % | 380,675 | 6.84 | % | $ | 7.14 | ||||||||
2. | Food Lion | 2,692 | 5.60 | % | 325,576 | 5.85 | % | 8.27 | ||||||||||
3. | Kroger (2) | 1,340 | 2.79 | % | 186,064 | 3.34 | % | 7.20 | ||||||||||
4. | Piggly Wiggly | 1,322 | 2.75 | % | 169,750 | 3.05 | % | 7.79 | ||||||||||
5. | Winn Dixie (1) | 863 | 1.80 | % | 133,575 | 2.40 | % | 6.46 | ||||||||||
6. | Planet Fitness | 837 | 1.74 | % | 96,375 | 1.73 | % | 8.68 | ||||||||||
7. | Hobby Lobby | 675 | 1.40 | % | 114,298 | 2.05 | % | 5.91 | ||||||||||
8. | BJ's Wholesale Club | 646 | 1.34 | % | 147,400 | 2.65 | % | 4.38 | ||||||||||
9. | Harris Teeter (2) | 578 | 1.20 | % | 39,946 | 0.72 | % | 14.47 | ||||||||||
10. | Lowes Foods | 571 | 1.19 | % | 54,838 | 0.99 | % | 10.41 | ||||||||||
$ | 12,241 | 25.46 | % | 1,648,497 | 29.62 | % | $ | 7.43 | ||||||||||
(1) These tenants are both owned by Southeastern Grocers.
(2) These tenants are both owned by The Kroger Company.
Lease Expiration Schedule
Lease Expiration Period | Number of Expiring Leases | Total Expiring Square Footage | % of Total Expiring Square Footage | % of Total Occupied Square Footage Expiring | Expiring Annualized Base Rent (in 000s) | % of Total Annualized Base Rent | Expiring Base Rent Per Occupied Square Foot | ||||||||||||||||
Available | — | 603,263 | 10.84 | % | — | % | $ | — | — | % | $ | — | |||||||||||
Month-to-Month | 7 | 14,963 | 0.27 | % | 0.30 | % | 221 | 0.46 | % | 14.77 | |||||||||||||
2020 | 101 | 504,285 | 9.06 | % | 10.16 | % | 4,900 | 10.19 | % | 9.72 | |||||||||||||
2021 | 139 | 632,189 | 11.36 | % | 12.74 | % | 6,411 | 13.33 | % | 10.14 | |||||||||||||
2022 | 150 | 573,948 | 10.31 | % | 11.57 | % | 6,571 | 13.67 | % | 11.45 | |||||||||||||
2023 | 111 | 798,165 | 14.34 | % | 16.09 | % | 6,805 | 14.15 | % | 8.53 | |||||||||||||
2024 | 91 | 608,773 | 10.94 | % | 12.27 | % | 5,744 | 11.95 | % | 9.44 | |||||||||||||
2025 | 64 | 636,514 | 11.44 | % | 12.83 | % | 6,012 | 12.50 | % | 9.45 | |||||||||||||
2026 | 30 | 395,482 | 7.11 | % | 7.97 | % | 3,652 | 7.59 | % | 9.23 | |||||||||||||
2027 | 15 | 102,285 | 1.84 | % | 2.06 | % | 1,234 | 2.57 | % | 12.06 | |||||||||||||
2028 | 16 | 329,155 | 5.91 | % | 6.63 | % | 2,475 | 5.15 | % | 7.52 | |||||||||||||
2029 and thereafter | 36 | 365,860 | 6.58 | % | 7.38 | % | 4,060 | 8.44 | % | 11.10 | |||||||||||||
Total | 760 | 5,564,882 | 100.00 | % | 100.00 | % | $ | 48,085 | 100.00 | % | $ | 9.69 | |||||||||||
WHLR | Financial & Operating Data | as of 3/31/2020 unless otherwise stated | 17 |
Leasing Summary
Anchor Lease Expiration Schedule (1)
No Option | Option | ||||||||||||||||||||||||
Lease Expiration Nine and Twelve Month Periods Ending December 31, | Number of Expiring Leases | Expiring Occupied Square Footage | Expiring Annualized Based Rent (in 000s) | % of Total Annualized Base Rent | Expiring Base Rent per Square Foot | Number of Expiring Leases | Expiring Occupied Square Footage | Expiring Annualized Based Rent (in 000s) | % of Total Annualized Base Rent | Expiring Base Rent per Square Foot | |||||||||||||||
Available | — | 218,564 | $ | — | — | % | $ | — | — | — | $ | — | — | % | $ | — | |||||||||
Month-to-Month | — | — | — | — | % | — | — | — | — | — | % | — | |||||||||||||
2020 | 3 | 127,145 | 836 | 39.01 | % | 6.58 | 3 | 115,976 | 794 | 4.38 | % | 6.84 | |||||||||||||
2021 | 2 | 43,427 | 88 | 4.11 | % | 2.03 | 8 | 240,002 | 1,837 | 10.13 | % | 7.66 | |||||||||||||
2022 | — | — | — | — | % | — | 6 | 207,882 | 1,486 | 8.20 | % | 7.15 | |||||||||||||
2023 | 1 | 22,032 | 215 | 10.03 | % | 9.76 | 15 | 523,775 | 3,322 | 18.33 | % | 6.34 | |||||||||||||
2024 | 1 | 32,000 | 125 | 5.83 | % | 3.91 | 7 | 289,759 | 2,035 | 11.23 | % | 7.02 | |||||||||||||
2025 | 2 | 84,633 | 562 | 26.21 | % | 6.64 | 10 | 373,397 | 3,023 | 16.68 | % | 8.10 | |||||||||||||
2026 | — | — | — | — | % | — | 8 | 272,522 | 2,176 | 12.00 | % | 7.98 | |||||||||||||
2027 | — | — | — | — | % | — | 1 | 24,945 | 212 | 1.17 | % | 8.50 | |||||||||||||
2028 | — | — | — | — | % | — | 7 | 280,841 | 1,637 | 9.03 | % | 5.83 | |||||||||||||
2029+ | 1 | 21,213 | 317 | 14.81 | % | 14.95 | 5 | 254,001 | 1,605 | 8.85 | % | 6.32 | |||||||||||||
Total | 10 | 549,014 | $ | 2,143 | 100.00 | % | $ | 6.49 | 70 | 2,583,100 | $ | 18,127 | 100.00 | % | $ | 7.02 | |||||||||
(1) Anchors defined as leases occupying 20,000 square feet or more.
Non-anchor Lease Expiration Schedule
No Option | Option | ||||||||||||||||||||||||
Lease Expiration Nine and Twelve Month Periods Ending December 31, | Number of Expiring Leases | Expiring Occupied Square Footage | Expiring Annualized Based Rent (in 000s) | % of Total Annualized Base Rent | Expiring Base Rent per Square Foot | Number of Expiring Leases | Expiring Occupied Square Footage | Expiring Annualized Based Rent (in 000s) | % of Total Annualized Base Rent | Expiring Base Rent per Square Foot | |||||||||||||||
Available | — | 384,699 | $ | — | — | % | $ | — | — | — | $ | — | — | % | $ | — | |||||||||
Month-to-Month | 5 | 11,863 | 183 | 1.49 | % | 15.43 | 2 | 3,100 | 38 | 0.24 | % | 12.26 | |||||||||||||
2020 | 72 | 182,222 | 2,157 | 17.60 | % | 11.84 | 23 | 78,942 | 1,113 | 7.15 | % | 14.10 | |||||||||||||
2021 | 78 | 184,953 | 2,235 | 18.23 | % | 12.08 | 51 | 163,807 | 2,251 | 14.47 | % | 13.74 | |||||||||||||
2022 | 74 | 138,256 | 2,030 | 16.56 | % | 14.68 | 70 | 227,810 | 3,055 | 19.64 | % | 13.41 | |||||||||||||
2023 | 53 | 105,049 | 1,393 | 11.36 | % | 13.26 | 42 | 147,309 | 1,875 | 12.05 | % | 12.73 | |||||||||||||
2024 | 44 | 113,200 | 1,380 | 11.26 | % | 12.19 | 39 | 173,814 | 2,204 | 14.17 | % | 12.68 | |||||||||||||
2025 | 27 | 72,775 | 992 | 8.09 | % | 13.63 | 25 | 105,709 | 1,435 | 9.22 | % | 13.58 | |||||||||||||
2026 | 8 | 19,224 | 395 | 3.22 | % | 20.55 | 14 | 103,736 | 1,081 | 6.95 | % | 10.42 | |||||||||||||
2027 | 1 | 5,350 | 86 | 0.70 | % | 16.07 | 13 | 71,990 | 936 | 6.02 | % | 13.00 | |||||||||||||
2028 | 6 | 31,508 | 661 | 5.39 | % | 20.98 | 3 | 16,806 | 177 | 1.14 | % | 10.53 | |||||||||||||
2029+ | 12 | 48,510 | 747 | 6.10 | % | 15.40 | 18 | 42,136 | 1,391 | 8.95 | % | 33.01 | |||||||||||||
Total | 380 | 1,297,609 | $ | 12,259 | 100.00 | % | $ | 13.43 | 300 | 1,135,159 | $ | 15,556 | 100.00 | % | $ | 13.70 | |||||||||
WHLR | Financial & Operating Data | as of 3/31/2020 unless otherwise stated | 18 |
Leasing Summary
Leasing Renewals, New Leases and Expirations
Three Months Ended March 31, 2020 | |||||||
2020 | 2019 | ||||||
Renewals(1): | |||||||
Leases renewed with rate increase (sq feet) | 137,599 | 90,858 | |||||
Leases renewed with rate decrease (sq feet) | 26,980 | 27,656 | |||||
Leases renewed with no rate change (sq feet) | 20,578 | 2,400 | |||||
Total leases renewed (sq feet) | 185,157 | 120,914 | |||||
Leases renewed with rate increase (count) | 30 | 19 | |||||
Leases renewed with rate decrease (count) | 5 | 7 | |||||
Leases renewed with no rate change (count) | 6 | 2 | |||||
Total leases renewed (count) | 41 | 28 | |||||
Option exercised (count) | 5 | 3 | |||||
Weighted average on rate increases (per sq foot) | $ | 1.70 | $ | 0.71 | |||
Weighted average on rate decreases (per sq foot) | $ | (2.20 | ) | $ | (2.11 | ) | |
Weighted average rate on all renewals (per sq foot) | $ | 0.94 | $ | 0.05 | |||
Weighted average change over prior rates | 8.60 | % | 0.63 | % | |||
New Leases(1) (2): | |||||||
New leases (sq feet) | 27,622 | 31,200 | |||||
New leases (count) | 14 | 8 | |||||
Weighted average rate (per sq foot) | $ | 13.89 | $ | 12.77 | |||
Gross Leasable Area ("GLA") expiring during the next 9 months, including month-to-month leases | 9.33 | % | 5.75 | % | |||
(1) | Lease data presented is based on average rate per square foot over the renewed or new lease term. |
(2) | The Company does not include ground leases entered into for the purposes of new lease sq feet and weighted average rate (per sq foot) on new leases. |
WHLR | Financial & Operating Data | as of 3/31/2020 unless otherwise stated | 19 |
Definitions
Funds from Operations (FFO): an alternative measure of a REIT's operating performance, specifically as it relates to results of operations and liquidity. FFO is a measurement that is not in accordance with accounting principles generally accepted in the United States (GAAP). Wheeler computes FFO in accordance with standards established by the Board of Governors of NAREIT in its March 1995 White Paper (as amended in November 1999 and December 2018). As defined by NAREIT, FFO represents net income (computed in accordance with GAAP), excluding gains (or losses) from sales of property, plus real estate related depreciation and amortization (excluding amortization of loan origination costs), plus impairment of real estate related long-lived assets and after adjustments for unconsolidated partnerships and joint ventures.
Most industry analysts and equity REITs, including Wheeler, consider FFO to be an appropriate supplemental measure of operating performance because, by excluding gains or losses on dispositions and excluding depreciation, FFO is a helpful tool that can assist in the comparison of the operating performance of a company’s real estate between periods, or as compared to different companies. Management uses FFO as a supplemental measure to conduct and evaluate the business because there are certain limitations associated with using GAAP net income alone as the primary measure of our operating performance. Historical cost accounting for real estate assets in accordance with GAAP implicitly assumes that the value of real estate assets diminishes predictably over time, while historically real estate values have risen or fallen with market conditions.
Adjusted FFO (AFFO): Management believes that the computation of FFO in accordance with NAREIT’s definition includes certain items that are not indicative of the operating performance of the Company’s real estate assets. These items include, but are not limited to, non-recurring expenses, legal settlements, acquisition costs and capital raise costs. Management uses AFFO, which is a non-GAAP financial measure, to exclude such items. Management believes that reporting AFFO in addition to FFO is a useful supplemental measure for the investment community to use when evaluating the operating performance of the Company on a comparative basis. The Company also presents Pro Forma AFFO which shows the impact of certain activities assuming they occurred at the beginning of the year.
Earnings Before Interest, Taxes, Depreciation and Amortization (EBITDA): another widely-recognized non-GAAP financial measure that the Company believes, when considered with financial statements prepared in accordance with GAAP, is useful to investors and lenders in understanding financial performance and providing a relevant basis for comparison among other companies, including REITs. While EBITDA should not be considered as a substitute for net income attributable to the Company’s common shareholders, net operating income, cash flow from operating activities, or other income or cash flow data prepared in accordance with GAAP, the Company believes that EBITDA may provide additional information with respect to the Company’s performance or ability to meet its future debt service requirements, capital expenditures and working capital requirements. The Company computes EBITDA by excluding interest expense, net loss attributable to noncontrolling interests, depreciation and amortization and impairment of long-lived assets and notes receivable, from income from continuing operations. The Company also presents Adjusted EBITDA which excludes affecting the comparability of the periods presented, including but not limited to, costs associated with acquisitions and capital related activities.
WHLR | Financial & Operating Data | 20 |
Net Operating Income (NOI): The Company believes that NOI is a useful measure of the Company's property operating performance. The Company defines NOI as property revenues (rental and other revenues) less property and related expenses (property operation and maintenance and real estate taxes). Because NOI excludes general and administrative expenses, depreciation and amortization, interest expense, interest income, provision for income taxes, gain or loss on sale or capital expenditures and leasing costs, it provides a performance measure, that when compared year over year, reflects the revenues and expenses directly associated with owning and operating commercial real estate properties and the impact to operations from trends in occupancy rates, rental rates and operating costs, providing perspective not immediately apparent from net income. The Company uses NOI to evaluate its operating performance since NOI allows the Company to evaluate the impact of factors, such as occupancy levels, lease structure, lease rates and tenant base, have on the Company's results, margins and returns. NOI should not be viewed as a measure of the Company's overall financial performance since it does not reflect general and administrative expenses, depreciation and amortization, impairment of impairment of long-lived assets, involuntary conversion, interest expense, interest income, provision for income taxes, gain or loss on sale or disposition of assets, and the level of capital expenditures and leasing costs necessary to maintain the operating performance of the Company's properties. Other REITs may use different methodologies for calculating NOI, and accordingly, the Company's NOI may not be comparable to that of other REITs.
WHLR | Financial & Operating Data | 21 |