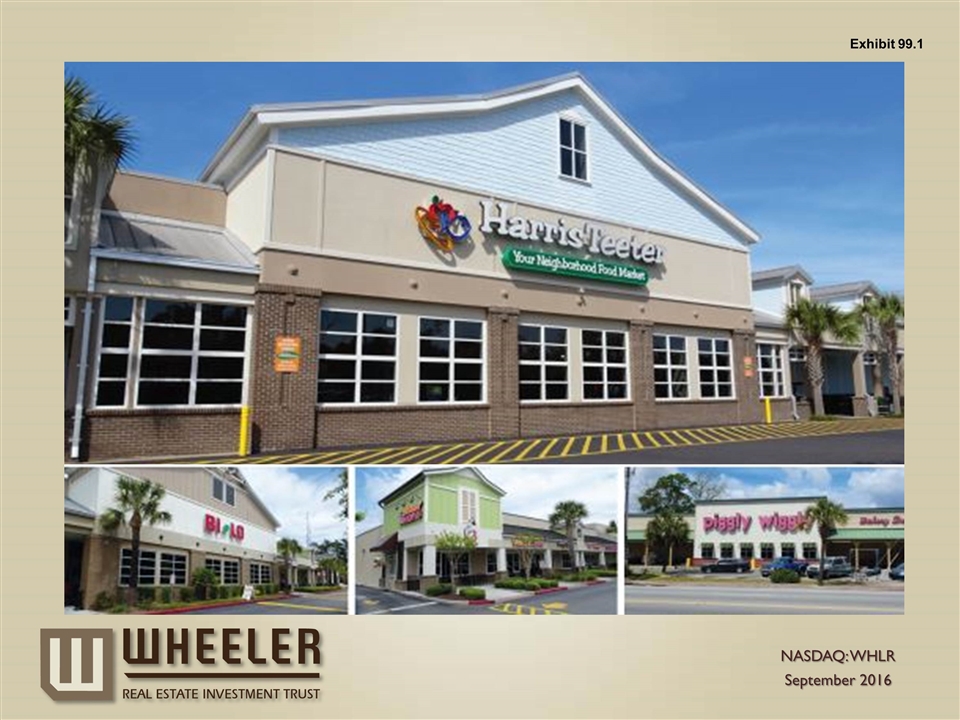

NASDAQ: WHLR September 2016 Exhibit 99.1
SAFE HARBOR This presentation may contain “forward-looking” statements as defined in the Private Securities Litigation Reform Act of 1995. When the Company uses words such as “may,” “will,” “intend,” “should,” “believe,” “expect,” “anticipate,” “project,” “estimate” or similar expressions that do not relate solely to historical matters, it is making forward-looking statements. Forward-looking statements are not guarantees of future performance and involve risks and uncertainties that may cause the actual results to differ materially from the Company’s expectations discussed in the forward-looking statements. Although the Company believes that the expectations reflected in such forward-looking statements are based upon reasonable assumptions it can give no assurance that expected results will be achieved, and actual results may differ materially from expectations. Specifically, the Company’s statements regarding: (i) the anticipated implementation of the Company’s growth, acquisition and disposition strategy; (ii) the future generation of value to the Company from the acquisition of service orientated retail properties in secondary and tertiary, and the ability of the Company to acquire service oriented retail properties, including the current pipeline of assets; (iii) the development and return on undeveloped properties; and (iv) anticipated dividend coverage are forward-looking statements. These statements are not guarantees of future performance and are subject to risks, uncertainties and other factors, some of which are beyond our control, are difficult to predict and could cause actual results to differ materially from those expressed or forecasted in the forward-looking statements. For these reasons, among others, investors are cautioned not to place undue reliance upon any forward-looking statements in this press release. For additional factors that could cause the operations of the Company to differ materially from those listed in the forward-looking statements are discussed in the Company's filings with the U.S. Securities and Exchange Commission, which are available for review at www.sec.gov. The Company undertakes no obligation to publicly revise these forward‐looking statements to reflect events or circumstances that arise after the date hereof.
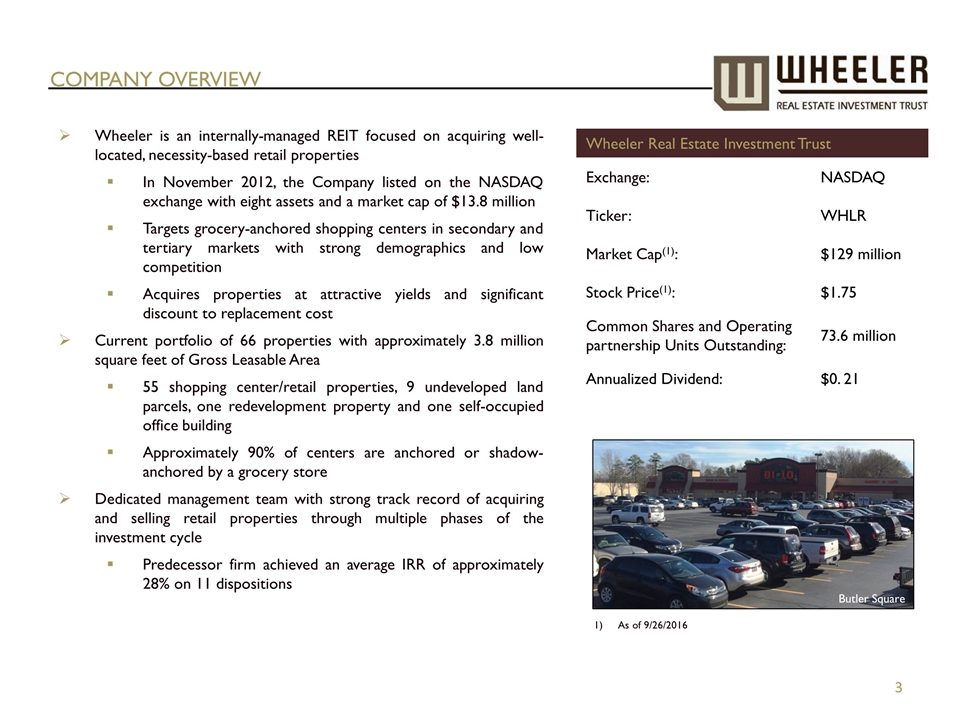
COMPANY OVERVIEW Wheeler is an internally-managed REIT focused on acquiring well-located, necessity-based retail properties In November 2012, the Company listed on the NASDAQ exchange with eight assets and a market cap of $13.8 million Targets grocery-anchored shopping centers in secondary and tertiary markets with strong demographics and low competition Acquires properties at attractive yields and significant discount to replacement cost Current portfolio of 66 properties with approximately 3.8 million square feet of Gross Leasable Area 55 shopping center/retail properties, 9 undeveloped land parcels, one redevelopment property and one self-occupied office building Approximately 90% of centers are anchored or shadow-anchored by a grocery store Dedicated management team with strong track record of acquiring and selling retail properties through multiple phases of the investment cycle Predecessor firm achieved an average IRR of approximately 28% on 11 dispositions Wheeler Real Estate Investment Trust Exchange: NASDAQ Ticker: WHLR Market Cap(1): $129 million Stock Price(1): $1.75 Common Shares and Operating partnership Units Outstanding: 73.6 million Annualized Dividend: $0. 21 As of 9/26/2016 Butler Square
Eight Directors- 6 Independent Directors and 2 Non-Independent Directors Institutional representation from Westport Capital Partners INVESTMENT HIGHLIGHTS Industry leading occupancy rate of approximately 93.8%, as of June 30, 2016 National and Regional merchants represent majority of Wheeler’s tenants Predominately grocery-anchored portfolio, located throughout the Southeast Since July 2015, Company has acquired 25 properties totaling over $150 million Wheeler properties serve the essential day-to-day shopping needs of the surrounding communities Majority of tenants provide non-cyclical consumer goods and services that are less impacted by fluctuations in the economy and E-commerce High Quality Existing Portfolio Seven properties currently under LOI, totaling $91.79 million Average cap rate of 8.03% with in place leases Company routinely evaluates and/or negotiates LOIs with a total value of $75 - $100 million Necessity-Based Retail Ability to scale platform as the Company grows results in improved profitability Create value through intensive leasing and property expense management Deep retailer relationships provide unique market knowledge Third-party property management and development fees create additional revenue stream Experienced management team with over 150 years of real estate experience Robust Pipeline Internally-Managed, Scalable Platform Board of Directors Predominantly fixed rate, long-term debt Paid down $21 million on Key Bank line of credit earlier in 3Q 2016 resulting in a 250bps reduction in interest expense on remaining $46.1 million balance Recently raised $40M of 8.75% Series D Convertible Preferred Stock ($2.12 conversion) Strong Balance Sheet & Cash Flow
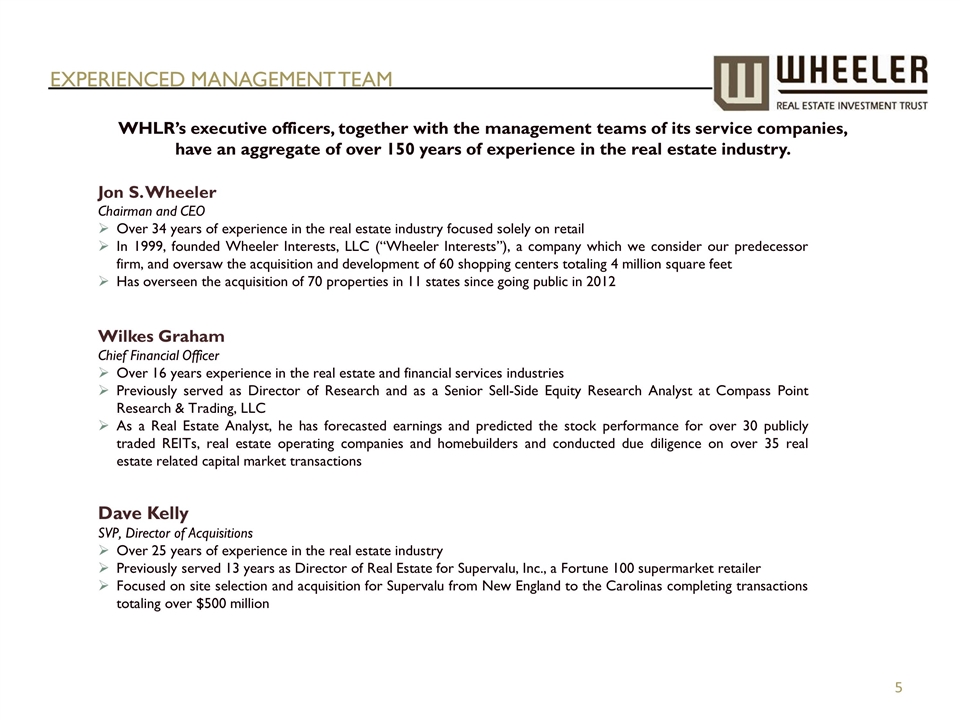
Wilkes Graham Chief Financial Officer Over 16 years experience in the real estate and financial services industries Previously served as Director of Research and as a Senior Sell-Side Equity Research Analyst at Compass Point Research & Trading, LLC As a Real Estate Analyst, he has forecasted earnings and predicted the stock performance for over 30 publicly traded REITs, real estate operating companies and homebuilders and conducted due diligence on over 35 real estate related capital market transactions Jon S. Wheeler Chairman and CEO Over 34 years of experience in the real estate industry focused solely on retail In 1999, founded Wheeler Interests, LLC (“Wheeler Interests”), a company which we consider our predecessor firm, and oversaw the acquisition and development of 60 shopping centers totaling 4 million square feet Has overseen the acquisition of 70 properties in 11 states since going public in 2012 WHLR’s executive officers, together with the management teams of its service companies, have an aggregate of over 150 years of experience in the real estate industry. EXPERIENCED Management Team Dave Kelly SVP, Director of Acquisitions Over 25 years of experience in the real estate industry Previously served 13 years as Director of Real Estate for Supervalu, Inc., a Fortune 100 supermarket retailer Focused on site selection and acquisition for Supervalu from New England to the Carolinas completing transactions totaling over $500 million
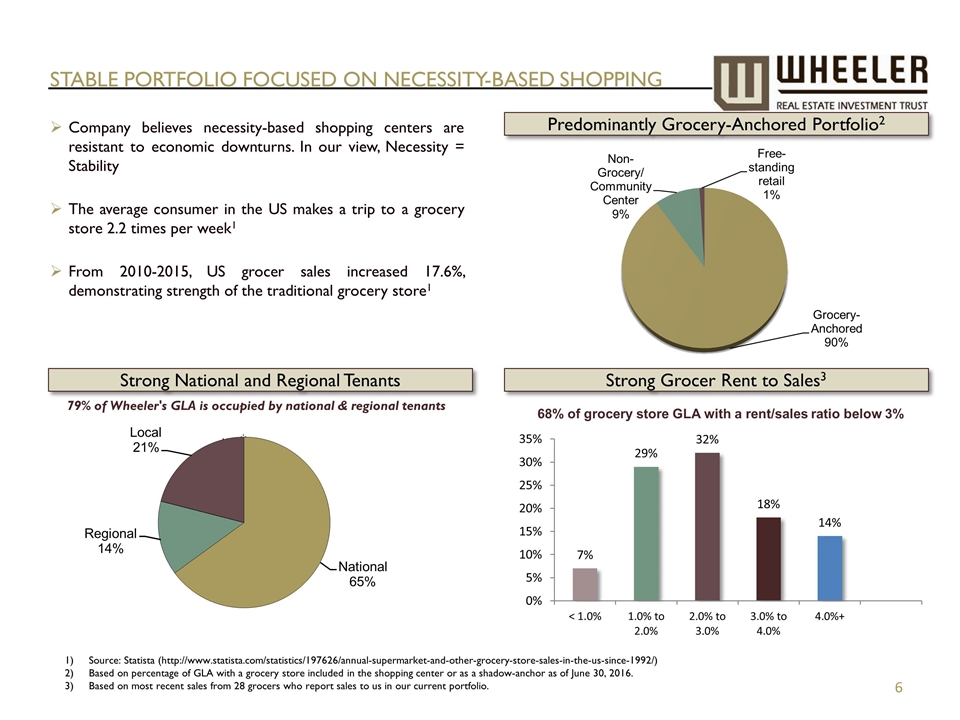
STABLE PORTFOLIO FOCUSED ON NECESSITY-BASED SHOPPING Predominantly Grocery-Anchored Portfolio2 Strong Grocer Rent to Sales3 68% of grocery store GLA with a rent/sales ratio below 3% Company believes necessity-based shopping centers are resistant to economic downturns. In our view, Necessity = Stability The average consumer in the US makes a trip to a grocery store 2.2 times per week1 From 2010-2015, US grocer sales increased 17.6%, demonstrating strength of the traditional grocery store1 Strong National and Regional Tenants 79% of Wheeler's GLA is occupied by national & regional tenants Source: Statista (http://www.statista.com/statistics/197626/annual-supermarket-and-other-grocery-store-sales-in-the-us-since-1992/) Based on percentage of GLA with a grocery store included in the shopping center or as a shadow-anchor as of June 30, 2016. Based on most recent sales from 28 grocers who report sales to us in our current portfolio. National 65% Regional 14% Local 21%
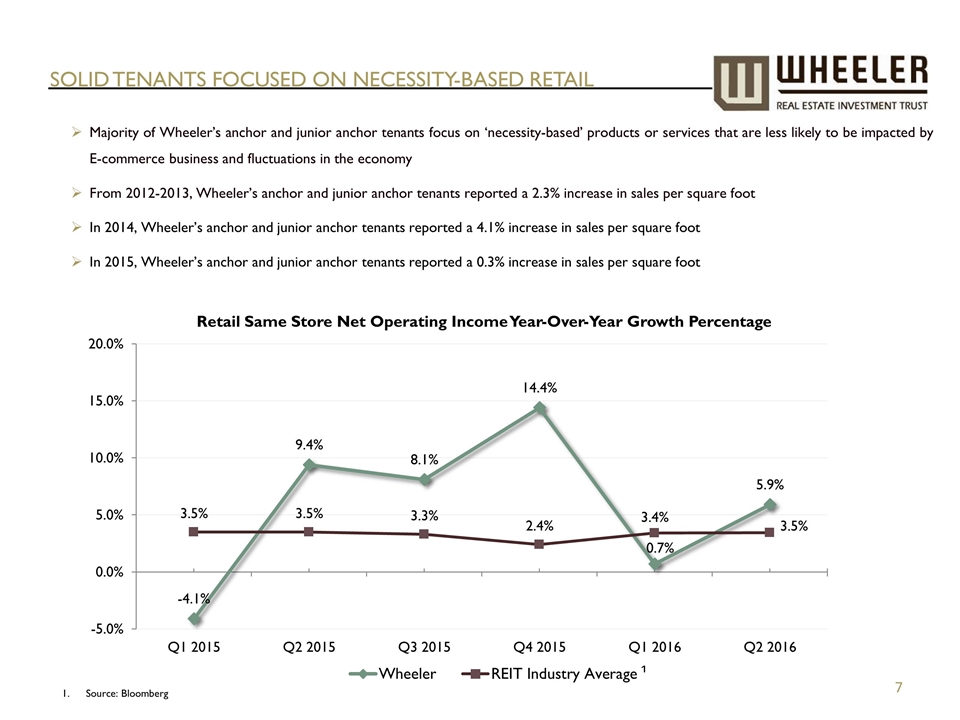
Majority of Wheeler’s anchor and junior anchor tenants focus on ‘necessity-based’ products or services that are less likely to be impacted by E-commerce business and fluctuations in the economy From 2012-2013, Wheeler’s anchor and junior anchor tenants reported a 2.3% increase in sales per square foot In 2014, Wheeler’s anchor and junior anchor tenants reported a 4.1% increase in sales per square foot In 2015, Wheeler’s anchor and junior anchor tenants reported a 0.3% increase in sales per square foot SOLID TENANTS FOCUSED ON NECESSITY-BASED RETAIL Source: Bloomberg
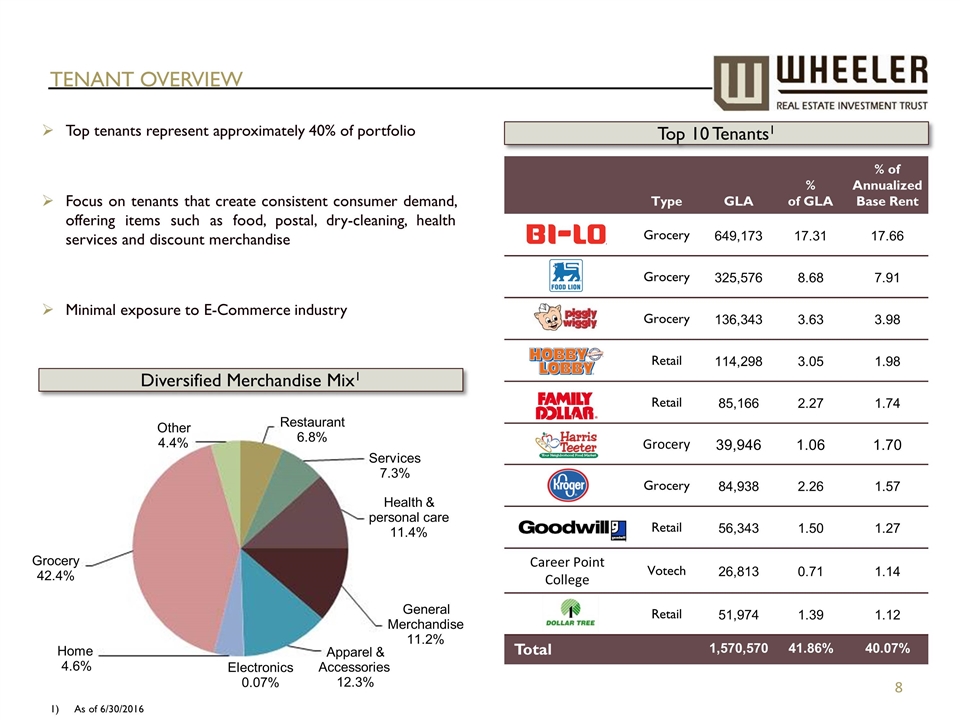
TENANT OVERVIEW Top tenants represent approximately 40% of portfolio Focus on tenants that create consistent consumer demand, offering items such as food, postal, dry-cleaning, health services and discount merchandise Minimal exposure to E-Commerce industry As of 6/30/2016 Top 10 Tenants1 Diversified Merchandise Mix1 Type GLA % of GLA % of Annualized Base Rent Grocery 649,173 17.31 17.66 Grocery 325,576 8.68 7.91 Grocery 136,343 3.63 3.98 Retail 114,298 3.05 1.98 Retail 85,166 2.27 1.74 Grocery 39,946 1.06 1.70 Grocery 84,938 2.26 1.57 Retail 56,343 1.50 1.27 Career Point College Votech 26,813 0.71 1.14 Retail 51,974 1.39 1.12 Total 1,570,570 41.86% 40.07% Restaurant 6.8% Services 7.3% Health & personal care 11.4% General Merchandise 11.2% Apparel & Accessories 12.3% Electronics 0.07% Home 4.6% Grocery 42.4% Other 4.4%
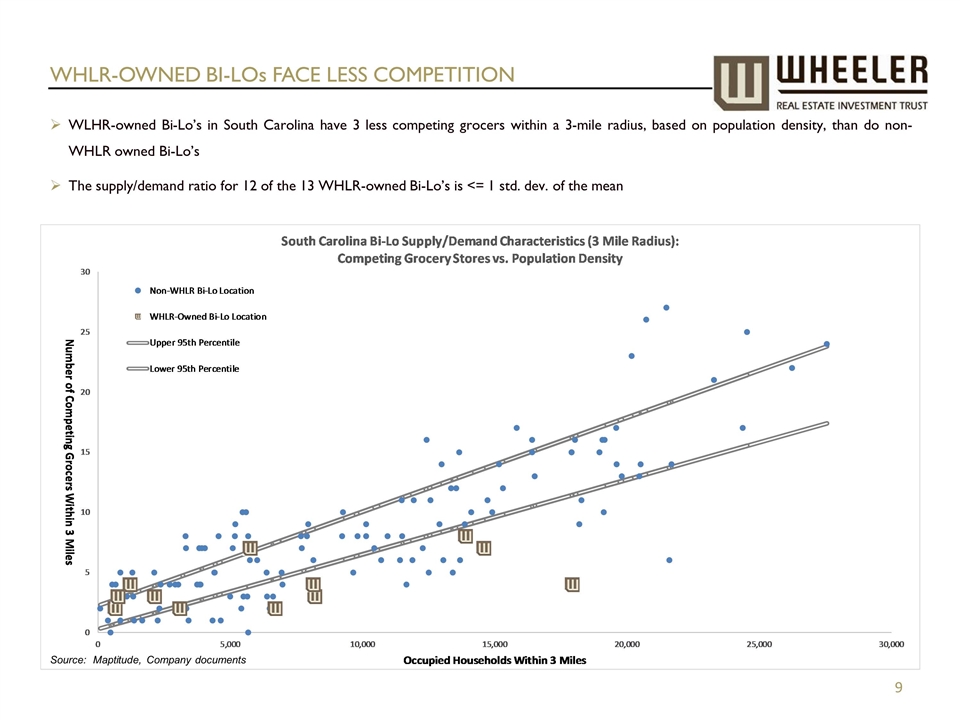
WHLR-OWNED BI-LOs FACE LESS COMPETITION WLHR-owned Bi-Lo’s in South Carolina have 3 less competing grocers within a 3-mile radius, based on population density, than do non-WHLR owned Bi-Lo’s The supply/demand ratio for 12 of the 13 WHLR-owned Bi-Lo’s is <= 1 std. dev. of the mean Source: Maptitude, Company documents
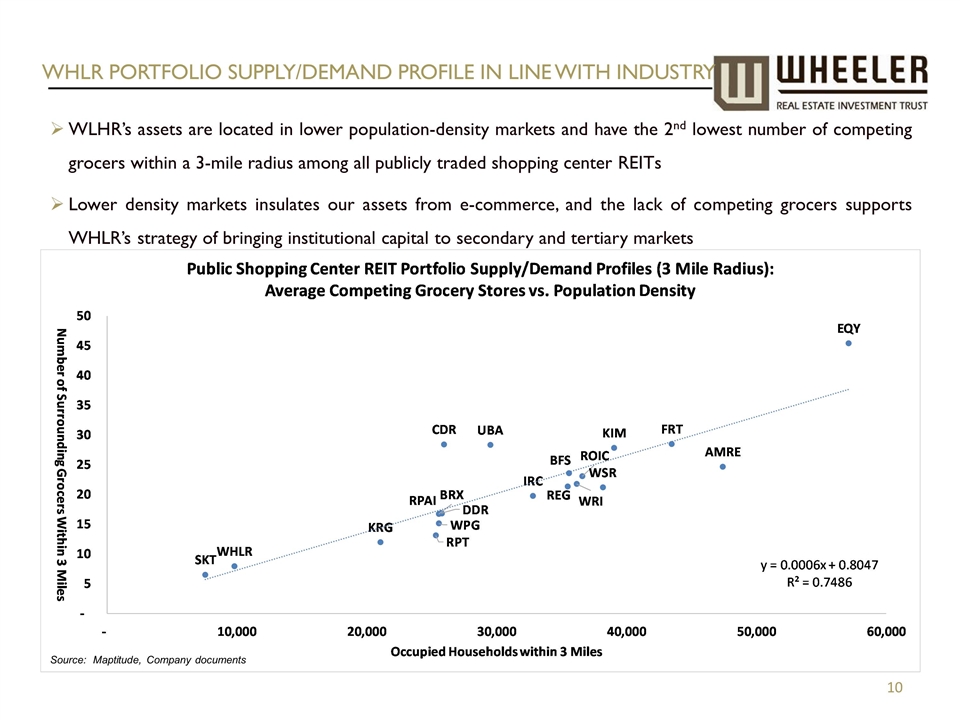
WHLR PORTFOLIO SUPPLY/DEMAND PROFILE IN LINE WITH INDUSTRY WLHR’s assets are located in lower population-density markets and have the 2nd lowest number of competing grocers within a 3-mile radius among all publicly traded shopping center REITs Lower density markets insulates our assets from e-commerce, and the lack of competing grocers supports WHLR’s strategy of bringing institutional capital to secondary and tertiary markets Source: Maptitude, Company documents
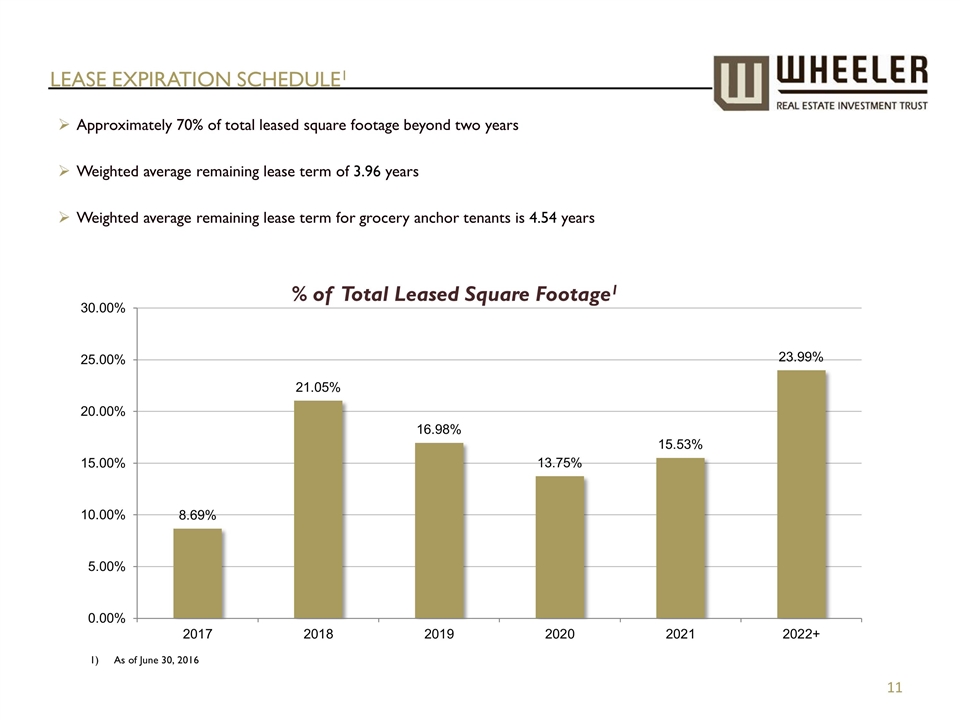
LEASE EXPIRATION SCHEDULE1 Approximately 70% of total leased square footage beyond two years Weighted average remaining lease term of 3.96 years Weighted average remaining lease term for grocery anchor tenants is 4.54 years As of June 30, 2016
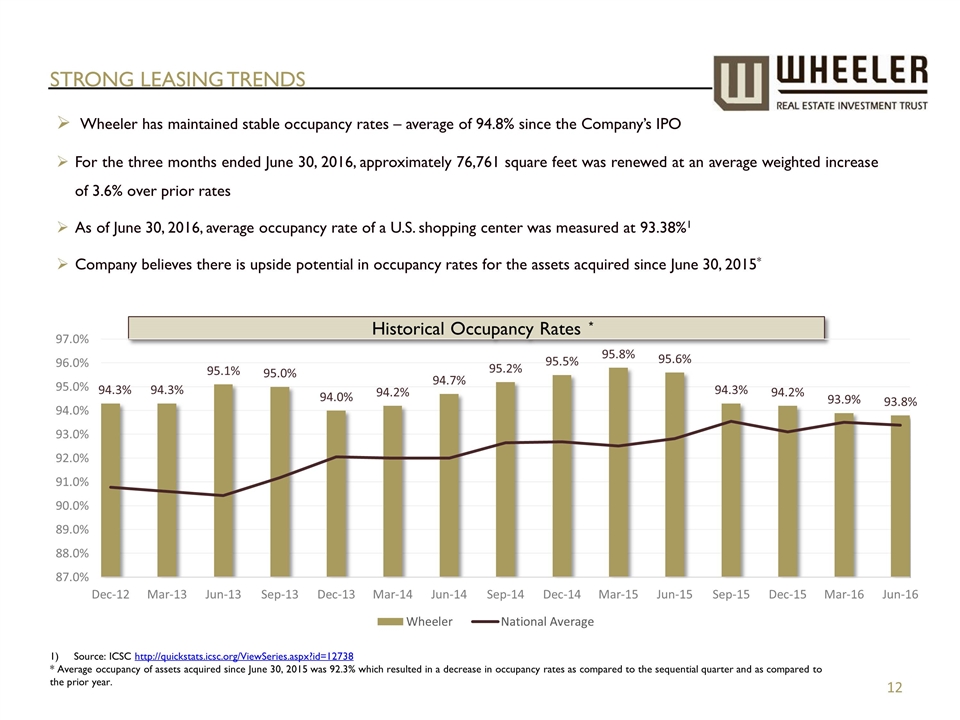
STRONG LEASING TRENDS Wheeler has maintained stable occupancy rates – average of 94.8% since the Company’s IPO For the three months ended June 30, 2016, approximately 76,761 square feet was renewed at an average weighted increase of 3.6% over prior rates As of June 30, 2016, average occupancy rate of a U.S. shopping center was measured at 93.38%1 Company believes there is upside potential in occupancy rates for the assets acquired since June 30, 2015* Historical Occupancy Rates Source: ICSC http://quickstats.icsc.org/ViewSeries.aspx?id=12738 * Average occupancy of assets acquired since June 30, 2015 was 92.3% which resulted in a decrease in occupancy rates as compared to the sequential quarter and as compared to the prior year. *
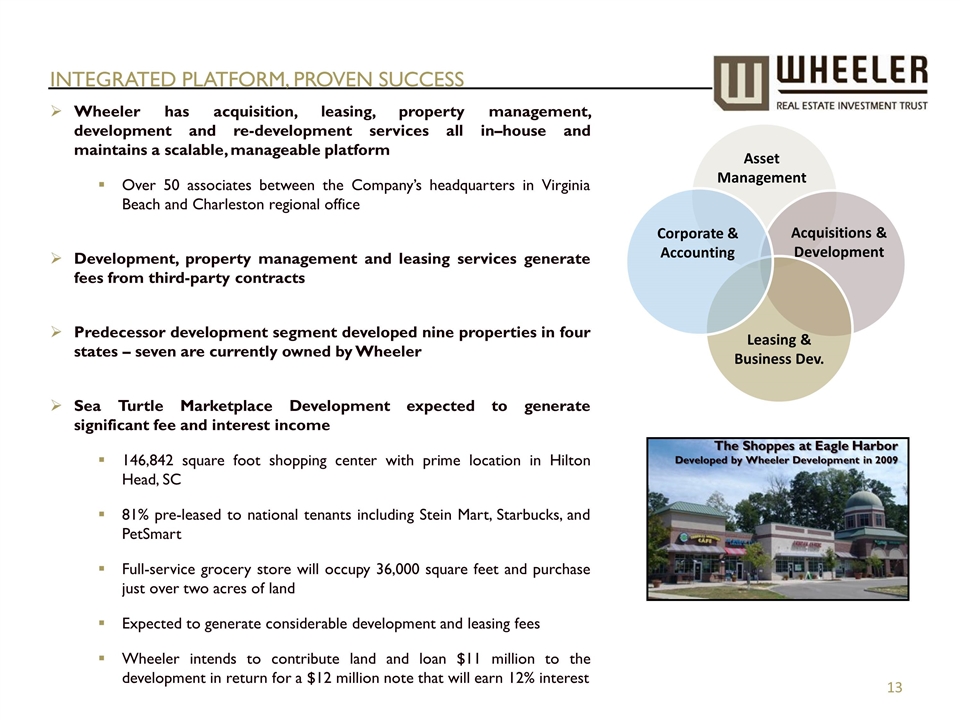
Integrated Platform, Proven Success Wheeler has acquisition, leasing, property management, development and re-development services all in–house and maintains a scalable, manageable platform Over 50 associates between the Company’s headquarters in Virginia Beach and Charleston regional office Development, property management and leasing services generate fees from third-party contracts Predecessor development segment developed nine properties in four states – seven are currently owned by Wheeler Sea Turtle Marketplace Development expected to generate significant fee and interest income 146,842 square foot shopping center with prime location in Hilton Head, SC 81% pre-leased to national tenants including Stein Mart, Starbucks, and PetSmart Full-service grocery store will occupy 36,000 square feet and purchase just over two acres of land Expected to generate considerable development and leasing fees Wheeler intends to contribute land and loan $11 million to the development in return for a $12 million note that will earn 12% interest Asset Management Acquisitions & Development Leasing & Business Dev. The Shoppes at Eagle Harbor Developed by Wheeler Development in 2009 Corporate & Accounting
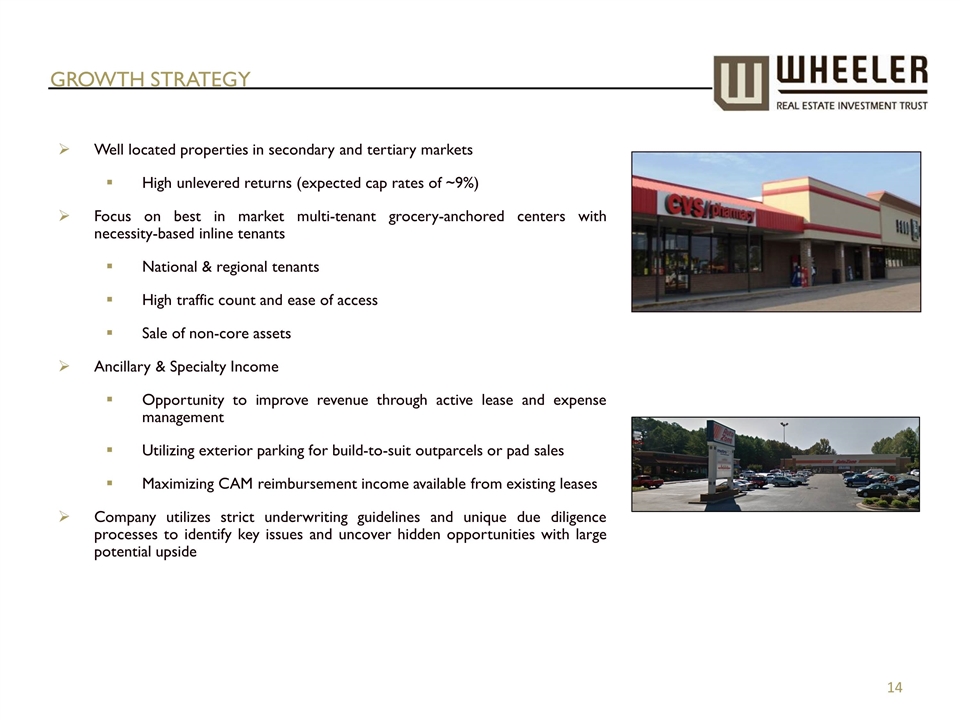
GROWTH STRATEGY Well located properties in secondary and tertiary markets High unlevered returns (expected cap rates of ~9%) Focus on best in market multi-tenant grocery-anchored centers with necessity-based inline tenants National & regional tenants High traffic count and ease of access Sale of non-core assets Ancillary & Specialty Income Opportunity to improve revenue through active lease and expense management Utilizing exterior parking for build-to-suit outparcels or pad sales Maximizing CAM reimbursement income available from existing leases Company utilizes strict underwriting guidelines and unique due diligence processes to identify key issues and uncover hidden opportunities with large potential upside
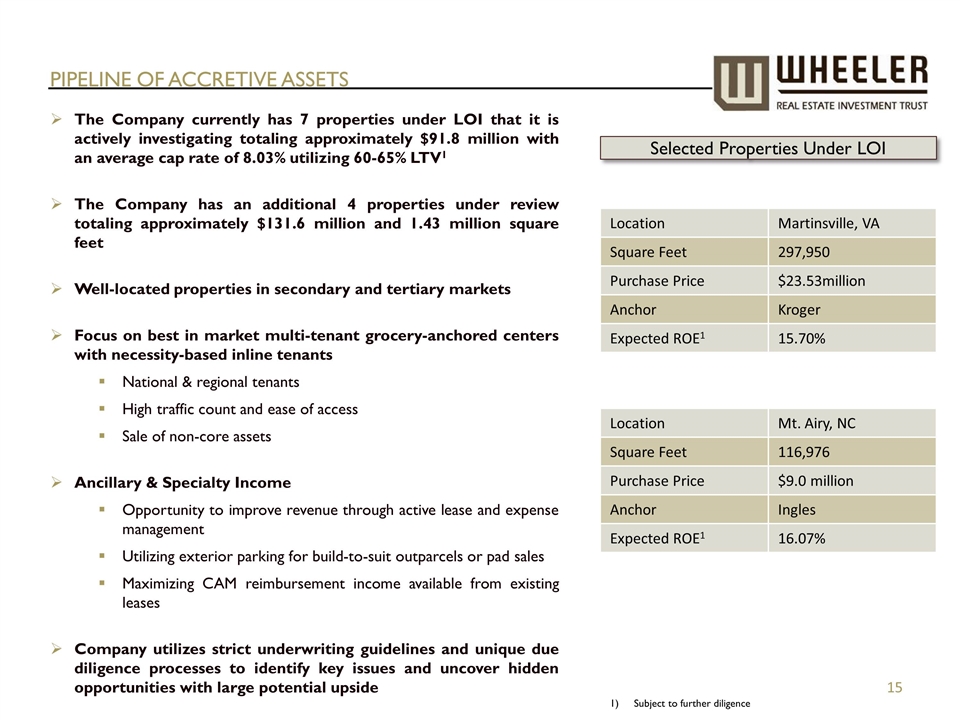
PIPELINE OF ACCRETIVE ASSETS Butler Square The Company currently has 7 properties under LOI that it is actively investigating totaling approximately $91.8 million with an average cap rate of 8.03% utilizing 60-65% LTV1 The Company has an additional 4 properties under review totaling approximately $131.6 million and 1.43 million square feet Well-located properties in secondary and tertiary markets Focus on best in market multi-tenant grocery-anchored centers with necessity-based inline tenants National & regional tenants High traffic count and ease of access Sale of non-core assets Ancillary & Specialty Income Opportunity to improve revenue through active lease and expense management Utilizing exterior parking for build-to-suit outparcels or pad sales Maximizing CAM reimbursement income available from existing leases Company utilizes strict underwriting guidelines and unique due diligence processes to identify key issues and uncover hidden opportunities with large potential upside Selected Properties Under LOI Location Martinsville, VA Square Feet 297,950 Purchase Price $23.53million Anchor Kroger Expected ROE1 15.70% Location Mt. Airy, NC Square Feet 116,976 Purchase Price $9.0 million Anchor Ingles Expected ROE1 16.07% Subject to further diligence
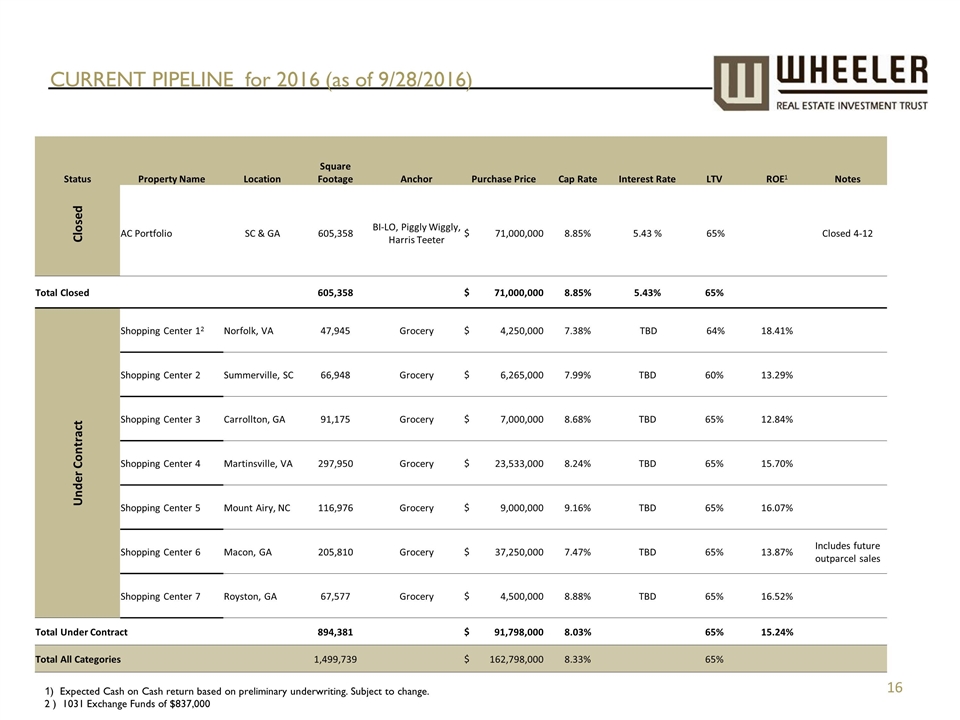
CURRENT PIPELINE for 2016 (as of 9/28/2016) Status Property Name Location Square Footage Anchor Purchase Price Cap Rate Interest Rate LTV ROE1 Notes Closed AC Portfolio SC & GA 605,358 BI-LO, Piggly Wiggly, Harris Teeter $ 71,000,000 8.85% 5.43 % 65% Closed 4-12 Total Closed 605,358 $ 71,000,000 8.85% 5.43% 65% Under Contract Shopping Center 12 Norfolk, VA 47,945 Grocery $ 4,250,000 7.38% TBD 64% 18.41% Shopping Center 2 Summerville, SC 66,948 Grocery $ 6,265,000 7.99% TBD 60% 13.29% Shopping Center 3 Carrollton, GA 91,175 Grocery $ 7,000,000 8.68% TBD 65% 12.84% Shopping Center 4 Martinsville, VA 297,950 Grocery $ 23,533,000 8.24% TBD 65% 15.70% Shopping Center 5 Mount Airy, NC 116,976 Grocery $ 9,000,000 9.16% TBD 65% 16.07% Shopping Center 6 Macon, GA 205,810 Grocery $ 37,250,000 7.47% TBD 65% 13.87% Includes future outparcel sales Shopping Center 7 Royston, GA 67,577 Grocery $ 4,500,000 8.88% TBD 65% 16.52% Total Under Contract 894,381 $ 91,798,000 8.03% 65% 15.24% Total All Categories 1,499,739 $ 162,798,000 8.33% 65% 1) Expected Cash on Cash return based on preliminary underwriting. Subject to change. 2 ) 1031 Exchange Funds of $837,000
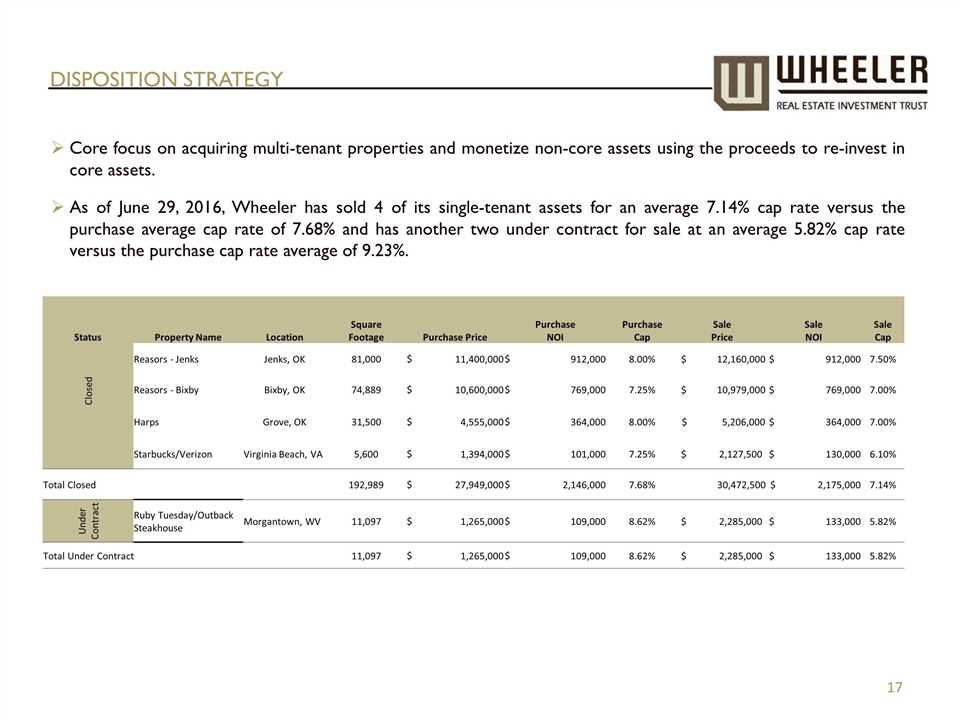
DISPOSITION STRATEGY Status Property Name Location Square Footage Purchase Price Purchase NOI Purchase Cap Sale Price Sale NOI Sale Cap Closed Reasors - Jenks Jenks, OK 81,000 $ 11,400,000 $ 912,000 8.00% $ 12,160,000 $ 912,000 7.50% Reasors - Bixby Bixby, OK 74,889 $ 10,600,000 $ 769,000 7.25% $ 10,979,000 $ 769,000 7.00% Harps Grove, OK 31,500 $ 4,555,000 $ 364,000 8.00% $ 5,206,000 $ 364,000 7.00% Starbucks/Verizon Virginia Beach, VA 5,600 $ 1,394,000 $ 101,000 7.25% $ 2,127,500 $ 130,000 6.10% Total Closed 192,989 $ 27,949,000 $ 2,146,000 7.68% 30,472,500 $ 2,175,000 7.14% Under Contract Ruby Tuesday/Outback Steakhouse Morgantown, WV 11,097 $ 1,265,000 $ 109,000 8.62% $ 2,285,000 $ 133,000 5.82% Total Under Contract 11,097 $ 1,265,000 $ 109,000 8.62% $ 2,285,000 $ 133,000 5.82% Core focus on acquiring multi-tenant properties and monetize non-core assets using the proceeds to re-invest in core assets. As of June 29, 2016, Wheeler has sold 4 of its single-tenant assets for an average 7.14% cap rate versus the purchase average cap rate of 7.68% and has another two under contract for sale at an average 5.82% cap rate versus the purchase cap rate average of 9.23%.
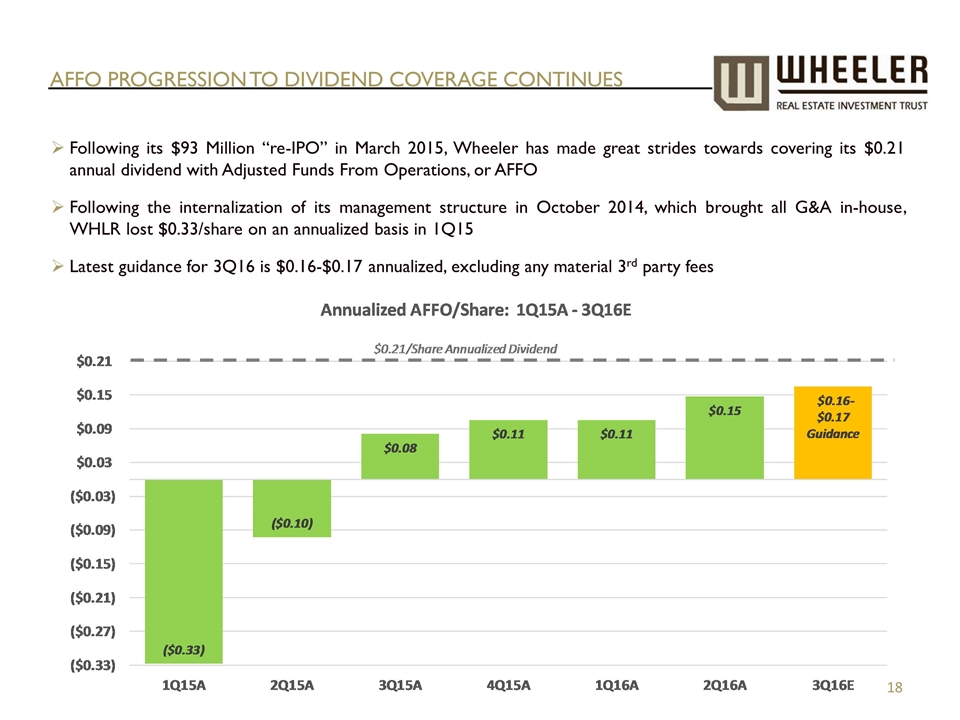
AFFO PROGRESSION TO DIVIDEND COVERAGE CONTINUES Following its $93 Million “re-IPO” in March 2015, Wheeler has made great strides towards covering its $0.21 annual dividend with Adjusted Funds From Operations, or AFFO Following the internalization of its management structure in October 2014, which brought all G&A in-house, WHLR lost $0.33/share on an annualized basis in 1Q15 Latest guidance for 3Q16 is $0.16-$0.17 annualized, excluding any material 3rd party fees
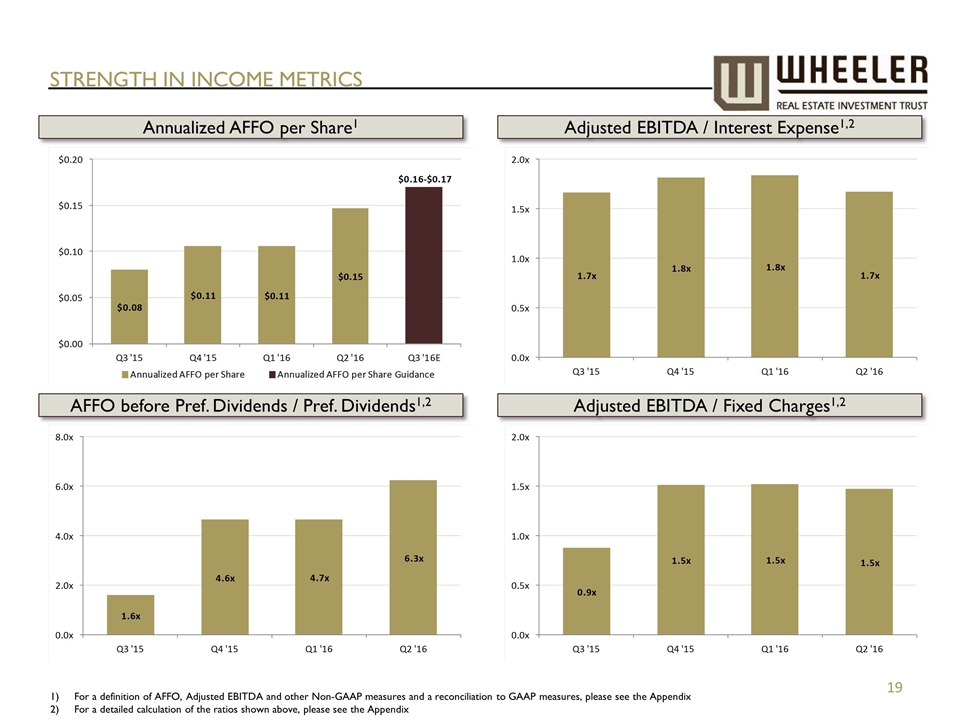
STRENGTH IN INCOME METRICS Butler Square Adjusted EBITDA / Interest Expense1,2 Adjusted EBITDA / Fixed Charges1,2 AFFO before Pref. Dividends / Pref. Dividends1,2 Annualized AFFO per Share1 For a definition of AFFO, Adjusted EBITDA and other Non-GAAP measures and a reconciliation to GAAP measures, please see the Appendix For a detailed calculation of the ratios shown above, please see the Appendix
Appendix
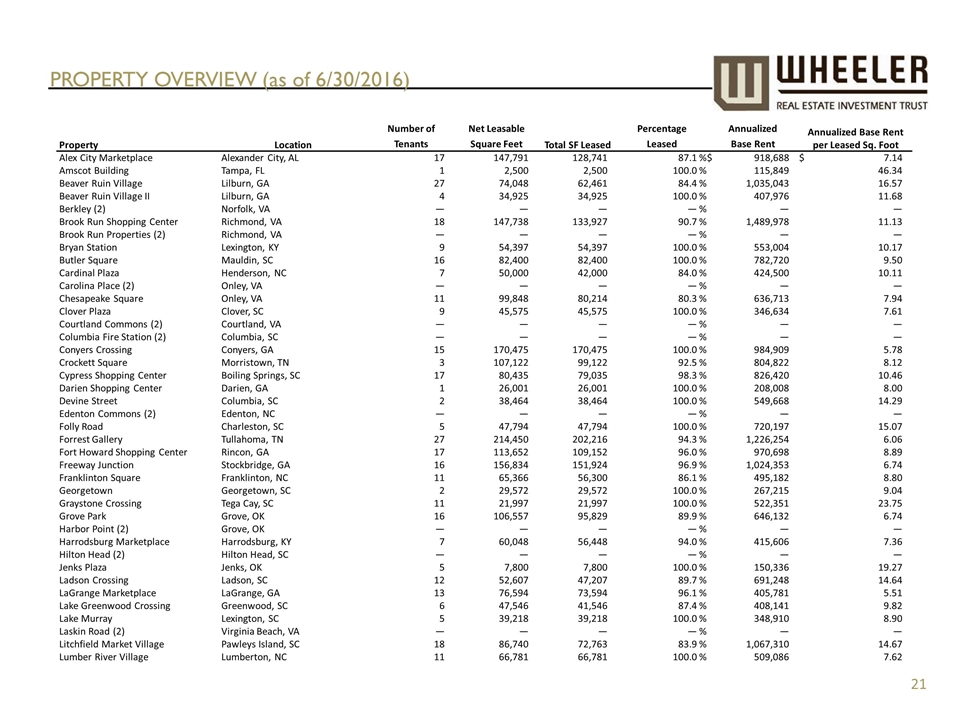
PROPERTY OVERVIEW (as of 6/30/2016) Property Location Number of Tenants Net Leasable Square Feet Total SF Leased Percentage Leased Annualized Base Rent Annualized Base Rent per Leased Sq. Foot Alex City Marketplace Alexander City, AL 17 147,791 128,741 87.1 % $ 918,688 $ 7.14 Amscot Building Tampa, FL 1 2,500 2,500 100.0 % 115,849 46.34 Beaver Ruin Village Lilburn, GA 27 74,048 62,461 84.4 % 1,035,043 16.57 Beaver Ruin Village II Lilburn, GA 4 34,925 34,925 100.0 % 407,976 11.68 Berkley (2) Norfolk, VA — — — — % — — Brook Run Shopping Center Richmond, VA 18 147,738 133,927 90.7 % 1,489,978 11.13 Brook Run Properties (2) Richmond, VA — — — — % — — Bryan Station Lexington, KY 9 54,397 54,397 100.0 % 553,004 10.17 Butler Square Mauldin, SC 16 82,400 82,400 100.0 % 782,720 9.50 Cardinal Plaza Henderson, NC 7 50,000 42,000 84.0 % 424,500 10.11 Carolina Place (2) Onley, VA — — — — % — — Chesapeake Square Onley, VA 11 99,848 80,214 80.3 % 636,713 7.94 Clover Plaza Clover, SC 9 45,575 45,575 100.0 % 346,634 7.61 Courtland Commons (2) Courtland, VA — — — — % — — Columbia Fire Station (2) Columbia, SC — — — — % — — Conyers Crossing Conyers, GA 15 170,475 170,475 100.0 % 984,909 5.78 Crockett Square Morristown, TN 3 107,122 99,122 92.5 % 804,822 8.12 Cypress Shopping Center Boiling Springs, SC 17 80,435 79,035 98.3 % 826,420 10.46 Darien Shopping Center Darien, GA 1 26,001 26,001 100.0 % 208,008 8.00 Devine Street Columbia, SC 2 38,464 38,464 100.0 % 549,668 14.29 Edenton Commons (2) Edenton, NC — — — — % — — Folly Road Charleston, SC 5 47,794 47,794 100.0 % 720,197 15.07 Forrest Gallery Tullahoma, TN 27 214,450 202,216 94.3 % 1,226,254 6.06 Fort Howard Shopping Center Rincon, GA 17 113,652 109,152 96.0 % 970,698 8.89 Freeway Junction Stockbridge, GA 16 156,834 151,924 96.9 % 1,024,353 6.74 Franklinton Square Franklinton, NC 11 65,366 56,300 86.1 % 495,182 8.80 Georgetown Georgetown, SC 2 29,572 29,572 100.0 % 267,215 9.04 Graystone Crossing Tega Cay, SC 11 21,997 21,997 100.0 % 522,351 23.75 Grove Park Grove, OK 16 106,557 95,829 89.9 % 646,132 6.74 Harbor Point (2) Grove, OK — — — — % — — Harrodsburg Marketplace Harrodsburg, KY 7 60,048 56,448 94.0 % 415,606 7.36 Hilton Head (2) Hilton Head, SC — — — — % — — Jenks Plaza Jenks, OK 5 7,800 7,800 100.0 % 150,336 19.27 Ladson Crossing Ladson, SC 12 52,607 47,207 89.7 % 691,248 14.64 LaGrange Marketplace LaGrange, GA 13 76,594 73,594 96.1 % 405,781 5.51 Lake Greenwood Crossing Greenwood, SC 6 47,546 41,546 87.4 % 408,141 9.82 Lake Murray Lexington, SC 5 39,218 39,218 100.0 % 348,910 8.90 Laskin Road (2) Virginia Beach, VA — — — — % — — Litchfield Market Village Pawleys Island, SC 18 86,740 72,763 83.9 % 1,067,310 14.67 Lumber River Village Lumberton, NC 11 66,781 66,781 100.0 % 509,086 7.62
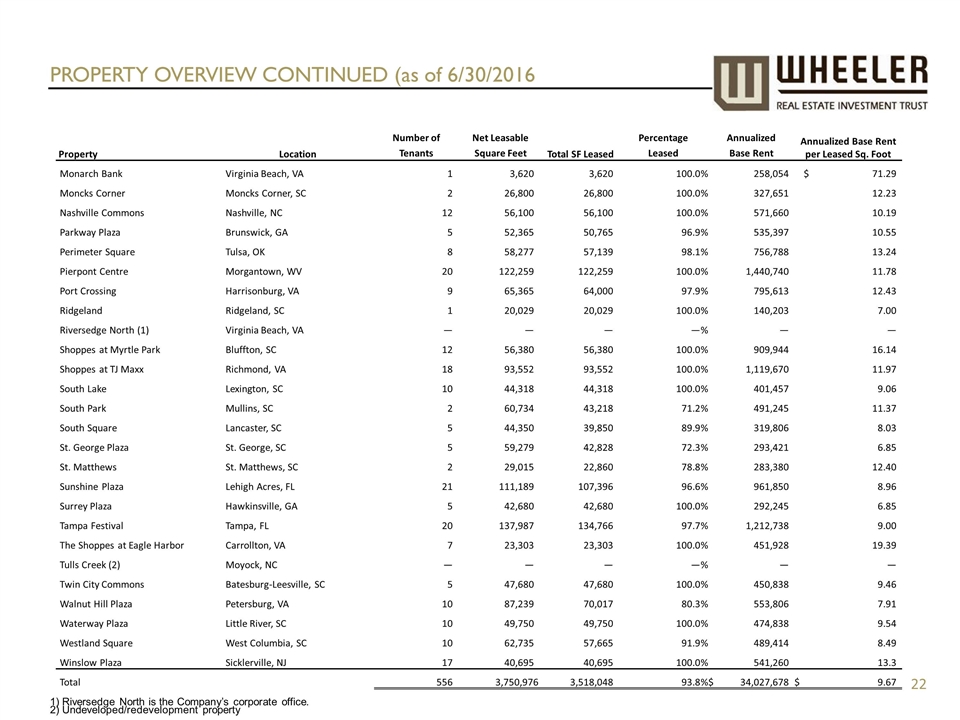
PROPERTY OVERVIEW CONTINUED (as of 6/30/2016 Property Location Number of Tenants Net Leasable Square Feet Total SF Leased Percentage Leased Annualized Base Rent Annualized Base Rent per Leased Sq. Foot Monarch Bank Virginia Beach, VA 1 3,620 3,620 100.0 % 258,054 $ 71.29 Moncks Corner Moncks Corner, SC 2 26,800 26,800 100.0 % 327,651 12.23 Nashville Commons Nashville, NC 12 56,100 56,100 100.0 % 571,660 10.19 Parkway Plaza Brunswick, GA 5 52,365 50,765 96.9 % 535,397 10.55 Perimeter Square Tulsa, OK 8 58,277 57,139 98.1 % 756,788 13.24 Pierpont Centre Morgantown, WV 20 122,259 122,259 100.0 % 1,440,740 11.78 Port Crossing Harrisonburg, VA 9 65,365 64,000 97.9 % 795,613 12.43 Ridgeland Ridgeland, SC 1 20,029 20,029 100.0 % 140,203 7.00 Riversedge North (1) Virginia Beach, VA — — — — % — — Shoppes at Myrtle Park Bluffton, SC 12 56,380 56,380 100.0 % 909,944 16.14 Shoppes at TJ Maxx Richmond, VA 18 93,552 93,552 100.0 % 1,119,670 11.97 South Lake Lexington, SC 10 44,318 44,318 100.0 % 401,457 9.06 South Park Mullins, SC 2 60,734 43,218 71.2 % 491,245 11.37 South Square Lancaster, SC 5 44,350 39,850 89.9 % 319,806 8.03 St. George Plaza St. George, SC 5 59,279 42,828 72.3 % 293,421 6.85 St. Matthews St. Matthews, SC 2 29,015 22,860 78.8 % 283,380 12.40 Sunshine Plaza Lehigh Acres, FL 21 111,189 107,396 96.6 % 961,850 8.96 Surrey Plaza Hawkinsville, GA 5 42,680 42,680 100.0 % 292,245 6.85 Tampa Festival Tampa, FL 20 137,987 134,766 97.7 % 1,212,738 9.00 The Shoppes at Eagle Harbor Carrollton, VA 7 23,303 23,303 100.0 % 451,928 19.39 Tulls Creek (2) Moyock, NC — — — — % — — Twin City Commons Batesburg-Leesville, SC 5 47,680 47,680 100.0 % 450,838 9.46 Walnut Hill Plaza Petersburg, VA 10 87,239 70,017 80.3 % 553,806 7.91 Waterway Plaza Little River, SC 10 49,750 49,750 100.0 % 474,838 9.54 Westland Square West Columbia, SC 10 62,735 57,665 91.9 % 489,414 8.49 Winslow Plaza Sicklerville, NJ 17 40,695 40,695 100.0 % 541,260 13.3 Total 556 3,750,976 3,518,048 93.8 % $ 34,027,678 $ 9.67 Riversedge North is the Company’s corporate office. Undeveloped/redevelopment property
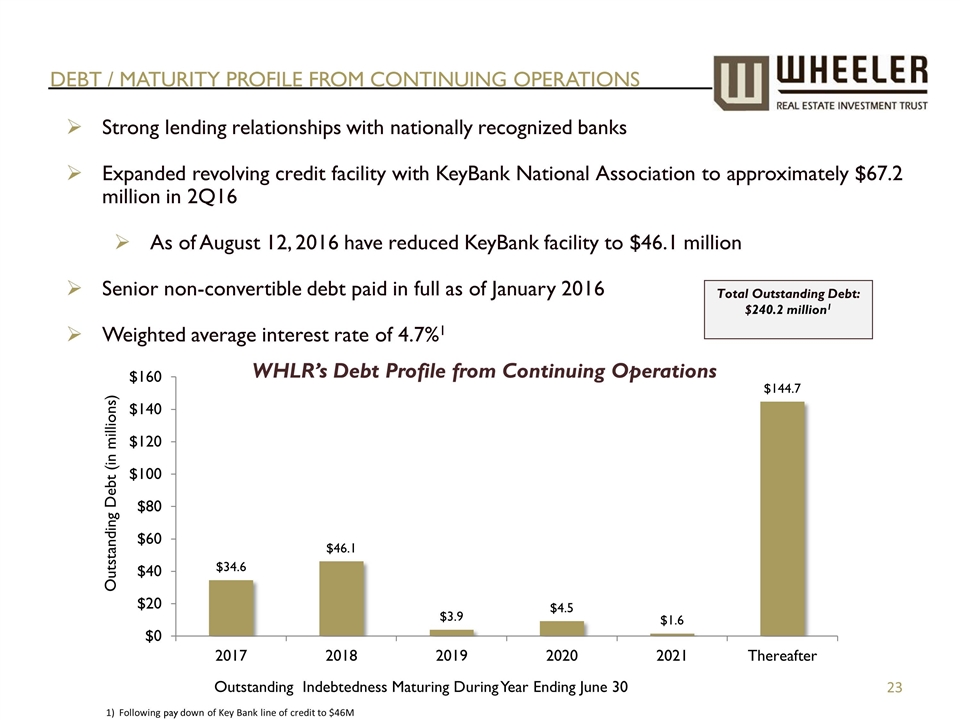
Strong lending relationships with nationally recognized banks Expanded revolving credit facility with KeyBank National Association to approximately $67.2 million in 2Q16 As of August 12, 2016 have reduced KeyBank facility to $46.1 million Senior non-convertible debt paid in full as of January 2016 Weighted average interest rate of 4.7%1 WHLR’s Debt Profile from Continuing Operations Debt / Maturity profile FROM CONTINUING OPERATIONS Total Outstanding Debt: $240.2 million1 1) Following pay down of Key Bank line of credit to $46M
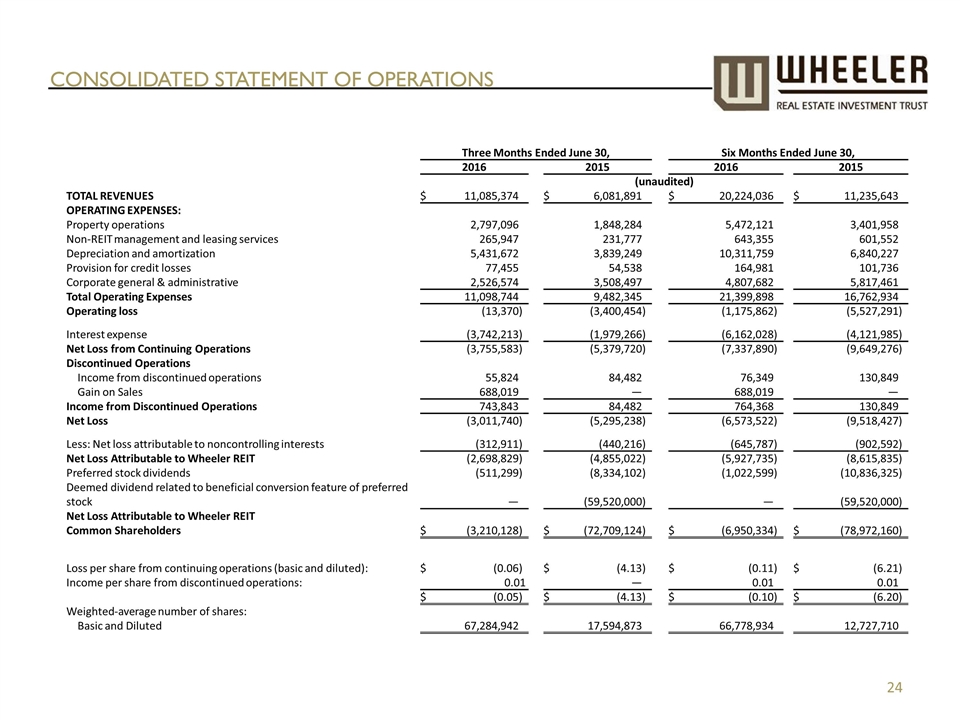
CONSOLIDATED STATEMENT OF OPERATIONS Three Months Ended June 30, Six Months Ended June 30, 2016 2015 2016 2015 (unaudited) TOTAL REVENUES $ 11,085,374 $ 6,081,891 $ 20,224,036 $ 11,235,643 OPERATING EXPENSES: Property operations 2,797,096 1,848,284 5,472,121 3,401,958 Non-REIT management and leasing services 265,947 231,777 643,355 601,552 Depreciation and amortization 5,431,672 3,839,249 10,311,759 6,840,227 Provision for credit losses 77,455 54,538 164,981 101,736 Corporate general & administrative 2,526,574 3,508,497 4,807,682 5,817,461 Total Operating Expenses 11,098,744 9,482,345 21,399,898 16,762,934 Operating loss (13,370 ) (3,400,454 ) (1,175,862 ) (5,527,291 ) Interest expense (3,742,213 ) (1,979,266 ) (6,162,028 ) (4,121,985 ) Net Loss from Continuing Operations (3,755,583 ) (5,379,720 ) (7,337,890 ) (9,649,276 ) Discontinued Operations Income from discontinued operations 55,824 84,482 76,349 130,849 Gain on Sales 688,019 — 688,019 — Income from Discontinued Operations 743,843 84,482 764,368 130,849 Net Loss (3,011,740 ) (5,295,238 ) (6,573,522 ) (9,518,427 ) Less: Net loss attributable to noncontrolling interests (312,911 ) (440,216 ) (645,787 ) (902,592 ) Net Loss Attributable to Wheeler REIT (2,698,829 ) (4,855,022 ) (5,927,735 ) (8,615,835 ) Preferred stock dividends (511,299 ) (8,334,102 ) (1,022,599 ) (10,836,325 ) Deemed dividend related to beneficial conversion feature of preferred stock — (59,520,000 ) — (59,520,000 ) Net Loss Attributable to Wheeler REIT Common Shareholders $ (3,210,128 ) $ (72,709,124 ) $ (6,950,334 ) $ (78,972,160 ) Loss per share from continuing operations (basic and diluted): $ (0.06 ) $ (4.13 ) $ (0.11 ) $ (6.21 ) Income per share from discontinued operations: 0.01 — 0.01 0.01 $ (0.05 ) $ (4.13 ) $ (0.10 ) $ (6.20 ) Weighted-average number of shares: Basic and Diluted 67,284,942 17,594,873 66,778,934 12,727,710
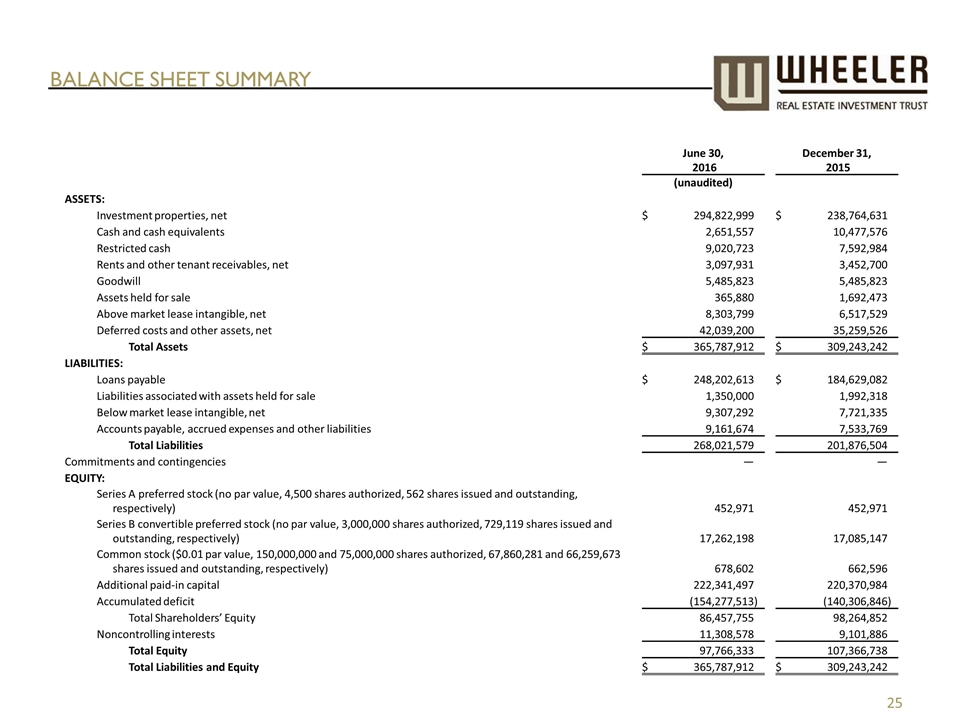
Balance sheet summary June 30, 2016 December 31, 2015 (unaudited) ASSETS: Investment properties, net $ 294,822,999 $ 238,764,631 Cash and cash equivalents 2,651,557 10,477,576 Restricted cash 9,020,723 7,592,984 Rents and other tenant receivables, net 3,097,931 3,452,700 Goodwill 5,485,823 5,485,823 Assets held for sale 365,880 1,692,473 Above market lease intangible, net 8,303,799 6,517,529 Deferred costs and other assets, net 42,039,200 35,259,526 Total Assets $ 365,787,912 $ 309,243,242 LIABILITIES: Loans payable $ 248,202,613 $ 184,629,082 Liabilities associated with assets held for sale 1,350,000 1,992,318 Below market lease intangible, net 9,307,292 7,721,335 Accounts payable, accrued expenses and other liabilities 9,161,674 7,533,769 Total Liabilities 268,021,579 201,876,504 Commitments and contingencies — — EQUITY: Series A preferred stock (no par value, 4,500 shares authorized, 562 shares issued and outstanding, respectively) 452,971 452,971 Series B convertible preferred stock (no par value, 3,000,000 shares authorized, 729,119 shares issued and outstanding, respectively) 17,262,198 17,085,147 Common stock ($0.01 par value, 150,000,000 and 75,000,000 shares authorized, 67,860,281 and 66,259,673 shares issued and outstanding, respectively) 678,602 662,596 Additional paid-in capital 222,341,497 220,370,984 Accumulated deficit (154,277,513 ) (140,306,846 ) Total Shareholders’ Equity 86,457,755 98,264,852 Noncontrolling interests 11,308,578 9,101,886 Total Equity 97,766,333 107,366,738 Total Liabilities and Equity $ 365,787,912 $ 309,243,242
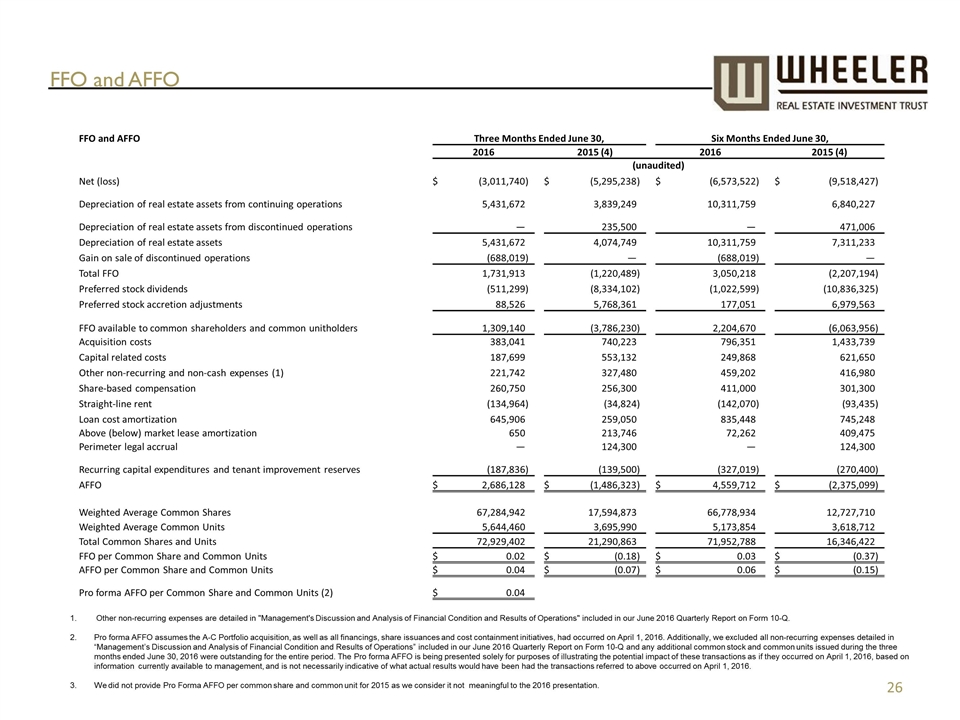
FFO and AFFO Other non-recurring expenses are detailed in "Management's Discussion and Analysis of Financial Condition and Results of Operations" included in our June 2016 Quarterly Report on Form 10-Q. Pro forma AFFO assumes the A-C Portfolio acquisition, as well as all financings, share issuances and cost containment initiatives, had occurred on April 1, 2016. Additionally, we excluded all non-recurring expenses detailed in “Management’s Discussion and Analysis of Financial Condition and Results of Operations” included in our June 2016 Quarterly Report on Form 10-Q and any additional common stock and common units issued during the three months ended June 30, 2016 were outstanding for the entire period. The Pro forma AFFO is being presented solely for purposes of illustrating the potential impact of these transactions as if they occurred on April 1, 2016, based on information currently available to management, and is not necessarily indicative of what actual results would have been had the transactions referred to above occurred on April 1, 2016. We did not provide Pro Forma AFFO per common share and common unit for 2015 as we consider it not meaningful to the 2016 presentation. FFO and AFFO Three Months Ended June 30, Six Months Ended June 30, 2016 2015 (4) 2016 2015 (4) (unaudited) Net (loss) $ (3,011,740 ) $ (5,295,238 ) $ (6,573,522 ) $ (9,518,427 ) Depreciation of real estate assets from continuing operations 5,431,672 3,839,249 10,311,759 6,840,227 Depreciation of real estate assets from discontinued operations — 235,500 — 471,006 Depreciation of real estate assets 5,431,672 4,074,749 10,311,759 7,311,233 Gain on sale of discontinued operations (688,019 ) — (688,019 ) — Total FFO 1,731,913 (1,220,489 ) 3,050,218 (2,207,194 ) Preferred stock dividends (511,299 ) (8,334,102 ) (1,022,599 ) (10,836,325 ) Preferred stock accretion adjustments 88,526 5,768,361 177,051 6,979,563 FFO available to common shareholders and common unitholders 1,309,140 (3,786,230 ) 2,204,670 (6,063,956 ) Acquisition costs 383,041 740,223 796,351 1,433,739 Capital related costs 187,699 553,132 249,868 621,650 Other non-recurring and non-cash expenses (1) 221,742 327,480 459,202 416,980 Share-based compensation 260,750 256,300 411,000 301,300 Straight-line rent (134,964 ) (34,824 ) (142,070 ) (93,435 ) Loan cost amortization 645,906 259,050 835,448 745,248 Above (below) market lease amortization 650 213,746 72,262 409,475 Perimeter legal accrual — 124,300 — 124,300 Recurring capital expenditures and tenant improvement reserves (187,836 ) (139,500 ) (327,019 ) (270,400 ) AFFO $ 2,686,128 $ (1,486,323 ) $ 4,559,712 $ (2,375,099 ) Weighted Average Common Shares 67,284,942 17,594,873 66,778,934 12,727,710 Weighted Average Common Units 5,644,460 3,695,990 5,173,854 3,618,712 Total Common Shares and Units 72,929,402 21,290,863 71,952,788 16,346,422 FFO per Common Share and Common Units $ 0.02 $ (0.18 ) $ 0.03 $ (0.37 ) AFFO per Common Share and Common Units $ 0.04 $ (0.07 ) $ 0.06 $ (0.15 ) Pro forma AFFO per Common Share and Common Units (2) $ 0.04
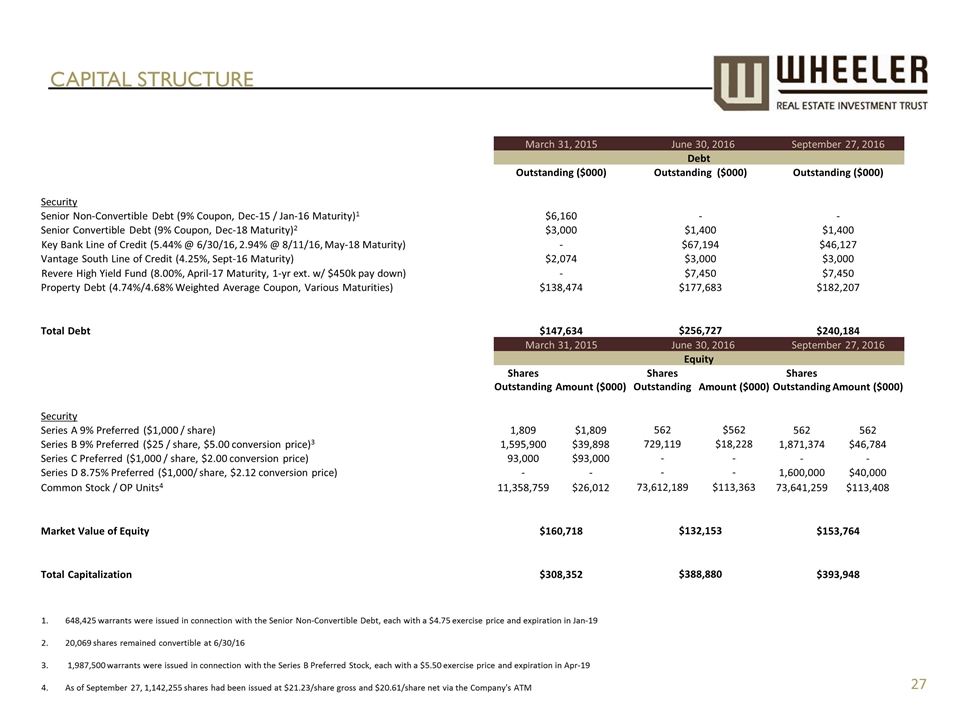
CAPITAL STRUCTURE March 31, 2015 June 30, 2016 September 27, 2016 Debt Outstanding ($000) Outstanding ($000) Outstanding ($000) Security Senior Non-Convertible Debt (9% Coupon, Dec-15 / Jan-16 Maturity)1 $6,160 - - Senior Convertible Debt (9% Coupon, Dec-18 Maturity)2 $3,000 $1,400 $1,400 Key Bank Line of Credit (5.44% @ 6/30/16, 2.94% @ 8/11/16, May-18 Maturity) - $67,194 $46,127 Vantage South Line of Credit (4.25%, Sept-16 Maturity) $2,074 $3,000 $3,000 Revere High Yield Fund (8.00%, April-17 Maturity, 1-yr ext. w/ $450k pay down) - $7,450 $7,450 Property Debt (4.74%/4.68% Weighted Average Coupon, Various Maturities) $138,474 $177,683 $182,207 Total Debt $147,634 $256,727 $240,184 March 31, 2015 June 30, 2016 September 27, 2016 Equity Shares Outstanding Amount ($000) Shares Outstanding Amount ($000) Shares Outstanding Amount ($000) Security Series A 9% Preferred ($1,000 / share) 1,809 $1,809 562 $562 562 562 Series B 9% Preferred ($25 / share, $5.00 conversion price)3 1,595,900 $39,898 729,119 $18,228 1,871,374 $46,784 Series C Preferred ($1,000 / share, $2.00 conversion price) 93,000 $93,000 - - - - Series D 8.75% Preferred ($1,000/ share, $2.12 conversion price) - - - - 1,600,000 $40,000 Common Stock / OP Units4 11,358,759 $26,012 73,612,189 $113,363 73,641,259 $113,408 Market Value of Equity $160,718 $132,153 $153,764 Total Capitalization $308,352 $388,880 $393,948 648,425 warrants were issued in connection with the Senior Non-Convertible Debt, each with a $4.75 exercise price and expiration in Jan-19 20,069 shares remained convertible at 6/30/16 1,987,500 warrants were issued in connection with the Series B Preferred Stock, each with a $5.50 exercise price and expiration in Apr-19 As of September 27, 1,142,255 shares had been issued at $21.23/share gross and $20.61/share net via the Company's ATM

NASDAQ: WHLR Think Retail. Think Wheeler.®