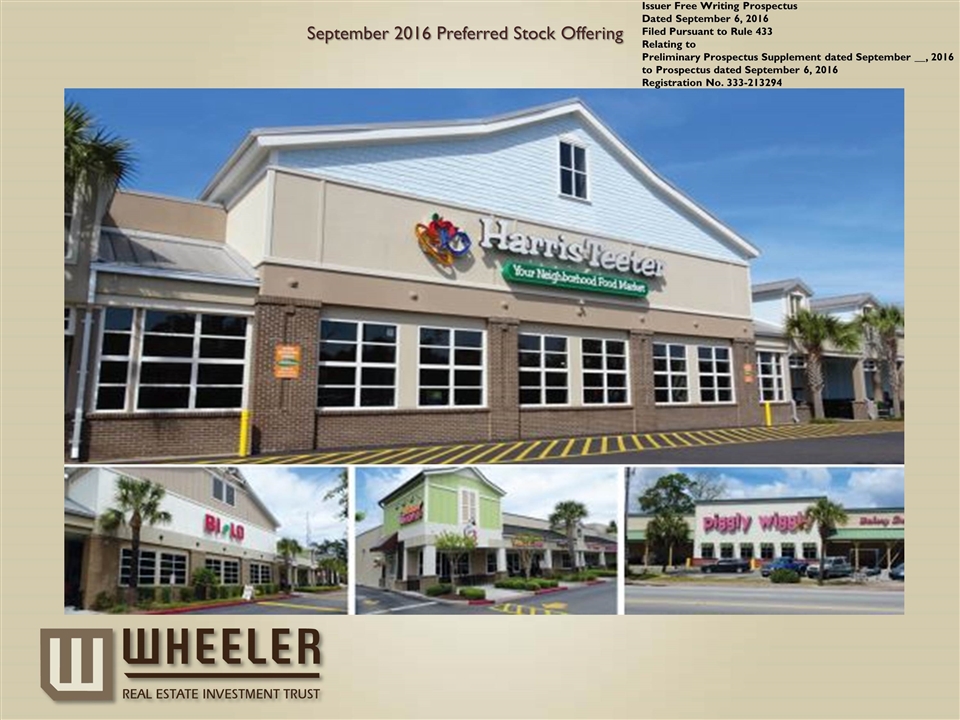

September 2016 Preferred Stock Offering Issuer Free Writing Prospectus Dated September 6, 2016 Filed Pursuant to Rule 433 Relating to Preliminary Prospectus Supplement dated September __, 2016 to Prospectus dated September 6, 2016 Registration No. 333-213294
SAFE HARBOR Wheeler Real Estate Investment Trust, Inc. (the “Company”) believes this presentation may contain “forward-looking” statements as defined in the Private Securities Litigation Reform Act of 1995. When the Company uses words such as “may,” “will,” “intend,” “should,” “believe,” “expect,” “anticipate,” “project,” “estimate” or similar expressions that do not relate solely to historical matters, it is making forward-looking statements. Forward-looking statements are not guarantees of future performance and involve risks and uncertainties that may cause the actual results to differ materially from the Company’s expectations discussed in the forward-looking statements. Although the Company believes that the expectations reflected in such forward-looking statements are based upon reasonable assumptions, it can give no assurance that expected results will be achieved, and actual results may differ materially from expectations. Specifically, the Company’s statements regarding: (i) the anticipated implementation of the Company’s growth, acquisition and disposition strategy; (ii) the future generation of value to the Company from the acquisition of service-oriented retail properties in secondary and tertiary markets; (iii) the development and return on undeveloped properties; (iv) the amount of and the Company’s ability to obtain loans intended to fund acquisitions and development; and (v) anticipated dividend coverage are forward-looking statements. These statements are not guarantees of future performance and are subject to risks, uncertainties and other factors, some of which are beyond our control, are difficult to predict and could cause actual results to differ materially from those expressed or forecasted in the forward-looking statements. For these reasons, among others, investors are cautioned not to place undue reliance upon any forward-looking statements in this presentation. Additional factors that could cause the operations of the Company to differ materially from those listed in the forward-looking statements are discussed in the Company's filings with the U.S. Securities and Exchange Commission, which are available for review at www.sec.gov. The Company undertakes no obligation to publicly revise these forward‐looking statements to reflect events or circumstances that arise after the date hereof. The offering is being made pursuant to the Issuer’s effective shelf registration statement filed with the U.S. Securities and Exchange Commission (“SEC”), which became effective on September 6, 2016. Before you invest, you should read the registration statement, preliminary prospectus supplement and the accompanying base prospectus and the other documents the Issuer has filed with the SEC for more complete information about the Issuer and this offering. Copies of these documents may be obtained from the SEC’s website at www.sec.gov or by contacting: Wunderlich Securities, Inc., Attention: Equity Syndicate, 6000 Poplar Avenue, Suite 150, Memphis, Tennessee 38119, or by email at syndicate@wundernet.com; Compass Point Research & Trading, LLC, Attention: Equity Syndicate, 1055 Thomas Jefferson Street NW, Suite 303, Washington, D.C. 20007, or by email at syndicate@compasspointllc.com; or, Wheeler Real Estate Investment Trust, Inc., Attention: Investor Relations, 2529 Va. Beach Blvd, Virginia Beach, Virginia, 23452, by email at info@whlr.us, or toll-free at (866) 203-4864.
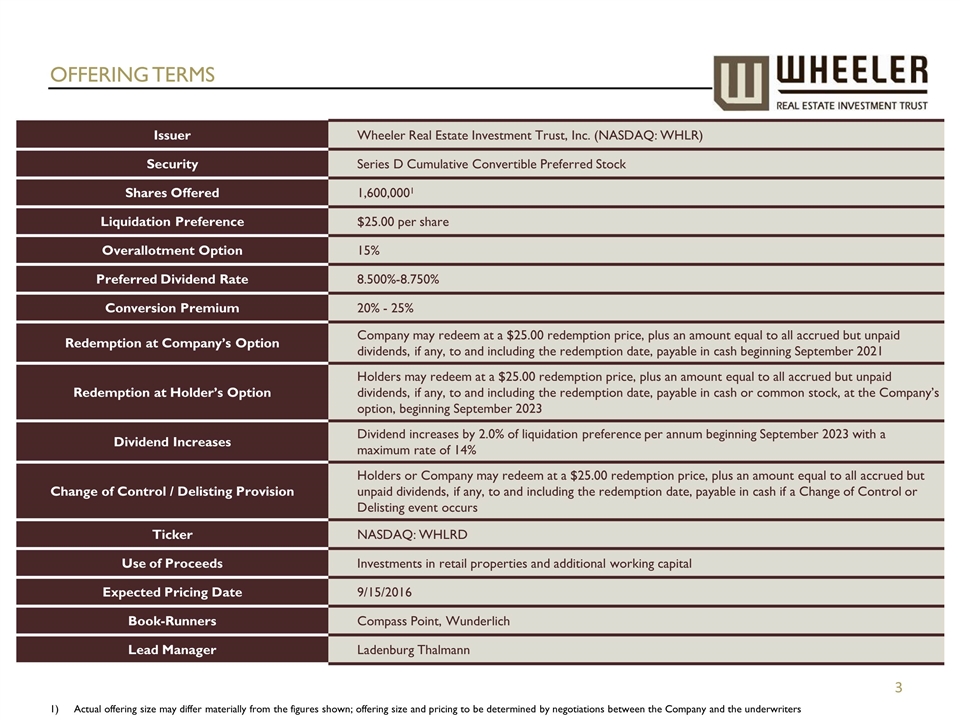
OFFERING TERMS Butler Square Issuer Wheeler Real Estate Investment Trust, Inc. (NASDAQ: WHLR) Security Series D Cumulative Convertible Preferred Stock Shares Offered 1,600,0001 Liquidation Preference $25.00 per share Overallotment Option 15% Preferred Dividend Rate 8.500%-8.750% Conversion Premium 20% - 25% Redemption at Company’s Option Company may redeem at a $25.00 redemption price, plus an amount equal to all accrued but unpaid dividends, if any, to and including the redemption date, payable in cash beginning September 2021 Redemption at Holder’s Option Holders may redeem at a $25.00 redemption price, plus an amount equal to all accrued but unpaid dividends, if any, to and including the redemption date, payable in cash or common stock, at the Company’s option, beginning September 2023 Dividend Increases Dividend increases by 2.0% of liquidation preference per annum beginning September 2023 with a maximum rate of 14% Change of Control / Delisting Provision Holders or Company may redeem at a $25.00 redemption price, plus an amount equal to all accrued but unpaid dividends, if any, to and including the redemption date, payable in cash if a Change of Control or Delisting event occurs Ticker NASDAQ: WHLRD Use of Proceeds Investments in retail properties and additional working capital Expected Pricing Date 9/15/2016 Book-Runners Compass Point, Wunderlich Lead Manager Ladenburg Thalmann Actual offering size may differ materially from the figures shown; offering size and pricing to be determined by negotiations between the Company and the underwriters
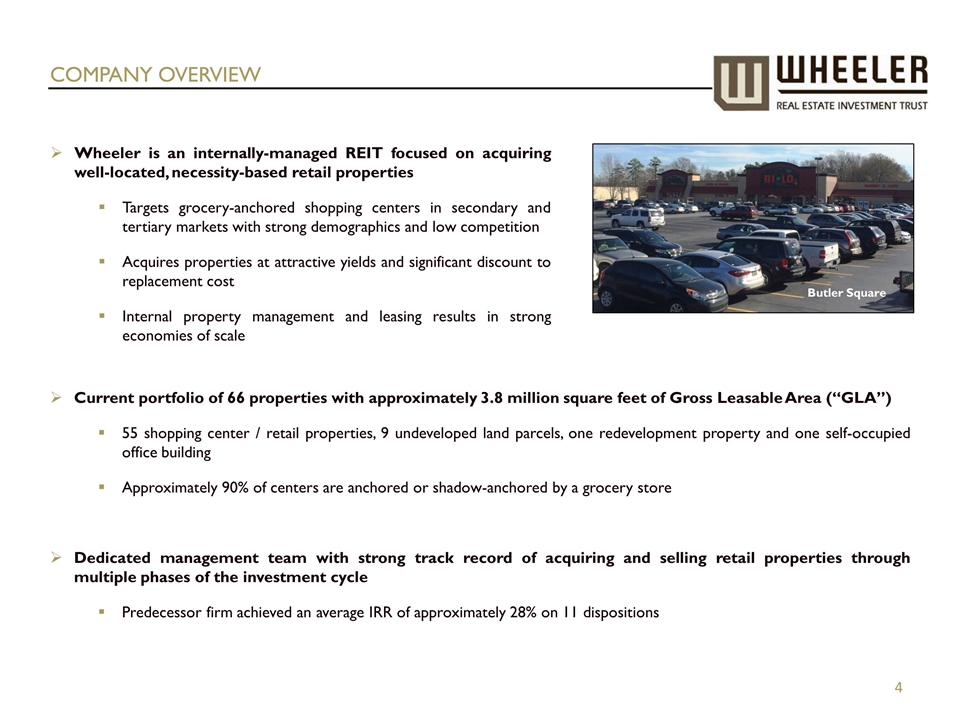
COMPANY OVERVIEW Current portfolio of 66 properties with approximately 3.8 million square feet of Gross Leasable Area (“GLA”) 55 shopping center / retail properties, 9 undeveloped land parcels, one redevelopment property and one self-occupied office building Approximately 90% of centers are anchored or shadow-anchored by a grocery store Dedicated management team with strong track record of acquiring and selling retail properties through multiple phases of the investment cycle Predecessor firm achieved an average IRR of approximately 28% on 11 dispositions Butler Square Wheeler is an internally-managed REIT focused on acquiring well-located, necessity-based retail properties Targets grocery-anchored shopping centers in secondary and tertiary markets with strong demographics and low competition Acquires properties at attractive yields and significant discount to replacement cost Internal property management and leasing results in strong economies of scale
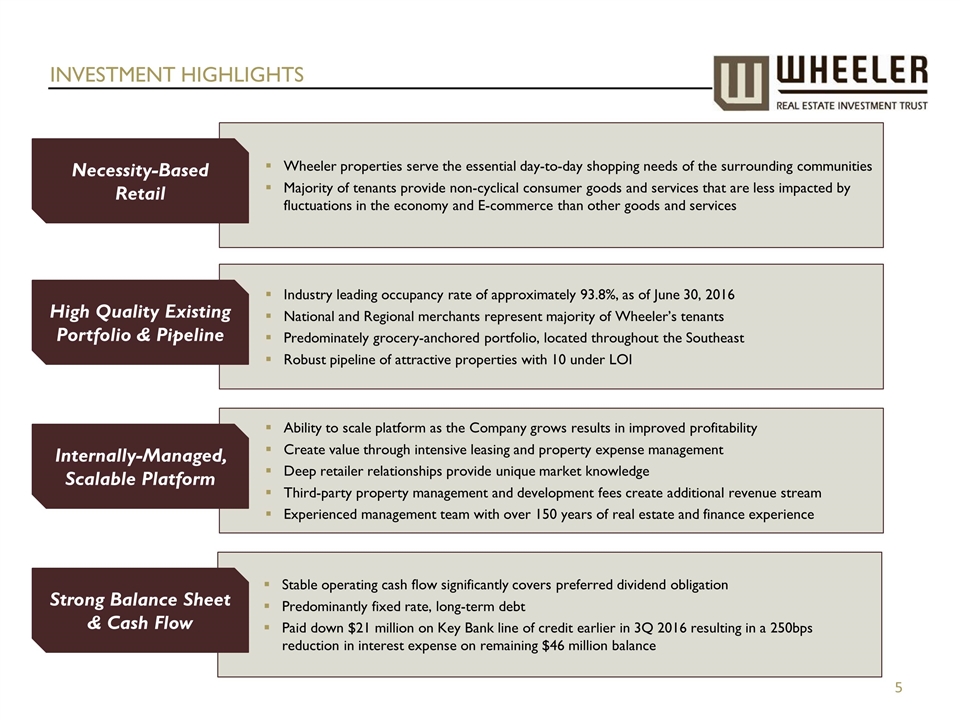
INVESTMENT HIGHLIGHTS Industry leading occupancy rate of approximately 93.8%, as of June 30, 2016 National and Regional merchants represent majority of Wheeler’s tenants Predominately grocery-anchored portfolio, located throughout the Southeast Robust pipeline of attractive properties with 10 under LOI Wheeler properties serve the essential day-to-day shopping needs of the surrounding communities Majority of tenants provide non-cyclical consumer goods and services that are less impacted by fluctuations in the economy and E-commerce than other goods and services High Quality Existing Portfolio & Pipeline Stable operating cash flow significantly covers preferred dividend obligation Predominantly fixed rate, long-term debt Paid down $21 million on Key Bank line of credit earlier in 3Q 2016 resulting in a 250bps reduction in interest expense on remaining $46 million balance Necessity-Based Retail Ability to scale platform as the Company grows results in improved profitability Create value through intensive leasing and property expense management Deep retailer relationships provide unique market knowledge Third-party property management and development fees create additional revenue stream Experienced management team with over 150 years of real estate and finance experience Strong Balance Sheet & Cash Flow Internally-Managed, Scalable Platform
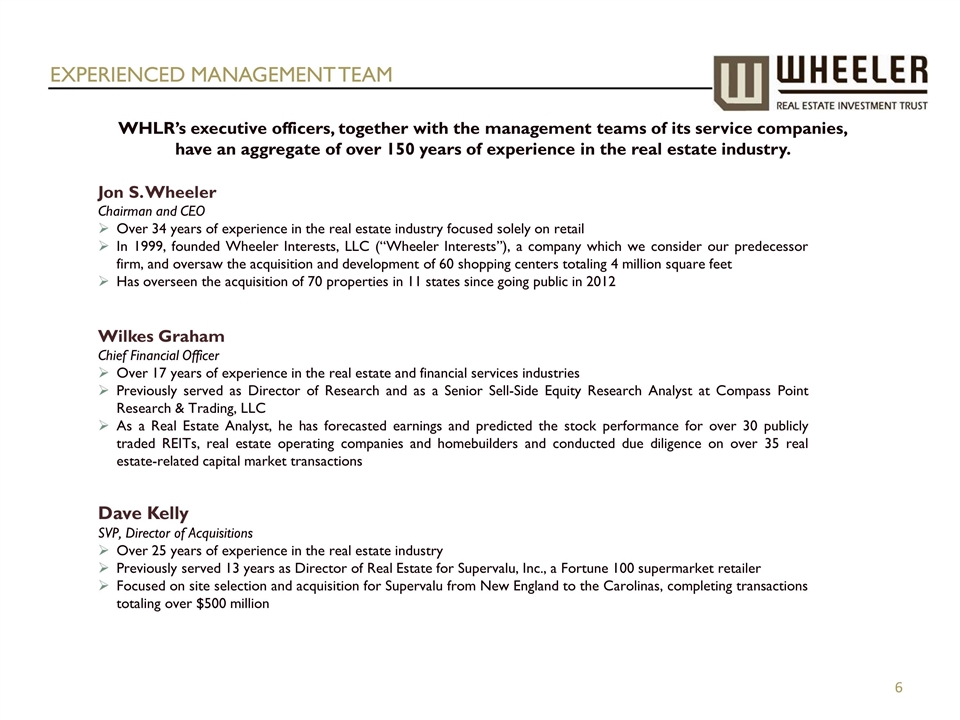
Wilkes Graham Chief Financial Officer Over 17 years of experience in the real estate and financial services industries Previously served as Director of Research and as a Senior Sell-Side Equity Research Analyst at Compass Point Research & Trading, LLC As a Real Estate Analyst, he has forecasted earnings and predicted the stock performance for over 30 publicly traded REITs, real estate operating companies and homebuilders and conducted due diligence on over 35 real estate-related capital market transactions Jon S. Wheeler Chairman and CEO Over 34 years of experience in the real estate industry focused solely on retail In 1999, founded Wheeler Interests, LLC (“Wheeler Interests”), a company which we consider our predecessor firm, and oversaw the acquisition and development of 60 shopping centers totaling 4 million square feet Has overseen the acquisition of 70 properties in 11 states since going public in 2012 WHLR’s executive officers, together with the management teams of its service companies, have an aggregate of over 150 years of experience in the real estate industry. EXPERIENCED Management Team Dave Kelly SVP, Director of Acquisitions Over 25 years of experience in the real estate industry Previously served 13 years as Director of Real Estate for Supervalu, Inc., a Fortune 100 supermarket retailer Focused on site selection and acquisition for Supervalu from New England to the Carolinas, completing transactions totaling over $500 million
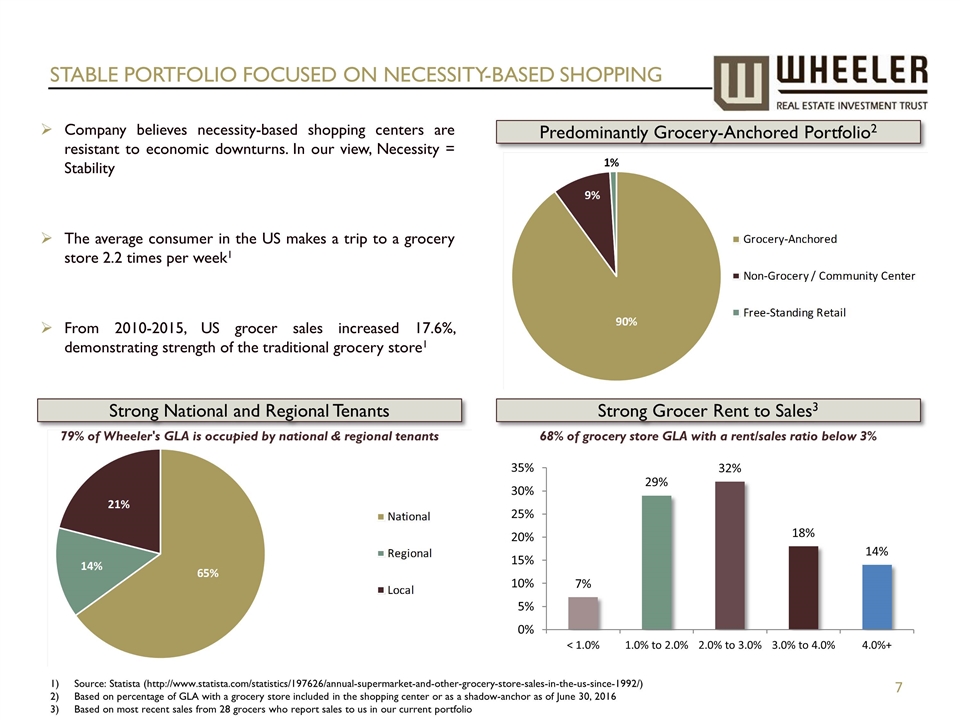
STABLE PORTFOLIO FOCUSED ON NECESSITY-BASED SHOPPING Predominantly Grocery-Anchored Portfolio2 Strong Grocer Rent to Sales3 68% of grocery store GLA with a rent/sales ratio below 3% Company believes necessity-based shopping centers are resistant to economic downturns. In our view, Necessity = Stability The average consumer in the US makes a trip to a grocery store 2.2 times per week1 From 2010-2015, US grocer sales increased 17.6%, demonstrating strength of the traditional grocery store1 Strong National and Regional Tenants 79% of Wheeler's GLA is occupied by national & regional tenants Source: Statista (http://www.statista.com/statistics/197626/annual-supermarket-and-other-grocery-store-sales-in-the-us-since-1992/) Based on percentage of GLA with a grocery store included in the shopping center or as a shadow-anchor as of June 30, 2016 Based on most recent sales from 28 grocers who report sales to us in our current portfolio
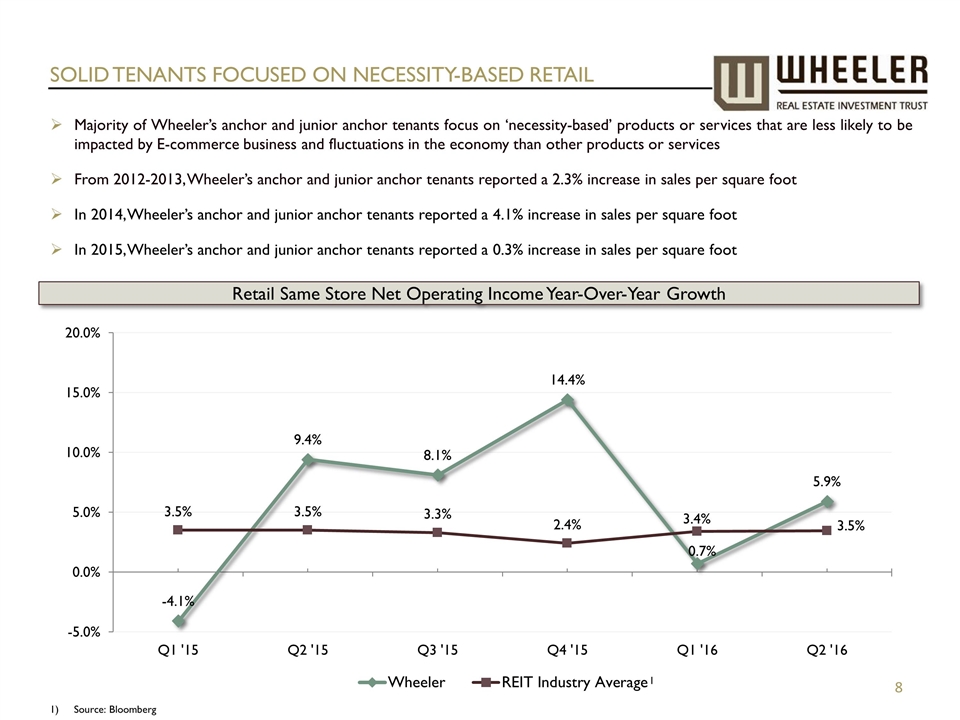
Majority of Wheeler’s anchor and junior anchor tenants focus on ‘necessity-based’ products or services that are less likely to be impacted by E-commerce business and fluctuations in the economy than other products or services From 2012-2013, Wheeler’s anchor and junior anchor tenants reported a 2.3% increase in sales per square foot In 2014, Wheeler’s anchor and junior anchor tenants reported a 4.1% increase in sales per square foot In 2015, Wheeler’s anchor and junior anchor tenants reported a 0.3% increase in sales per square foot SOLID TENANTS FOCUSED ON NECESSITY-BASED RETAIL Retail Same Store Net Operating Income Year-Over-Year Growth Source: Bloomberg 1
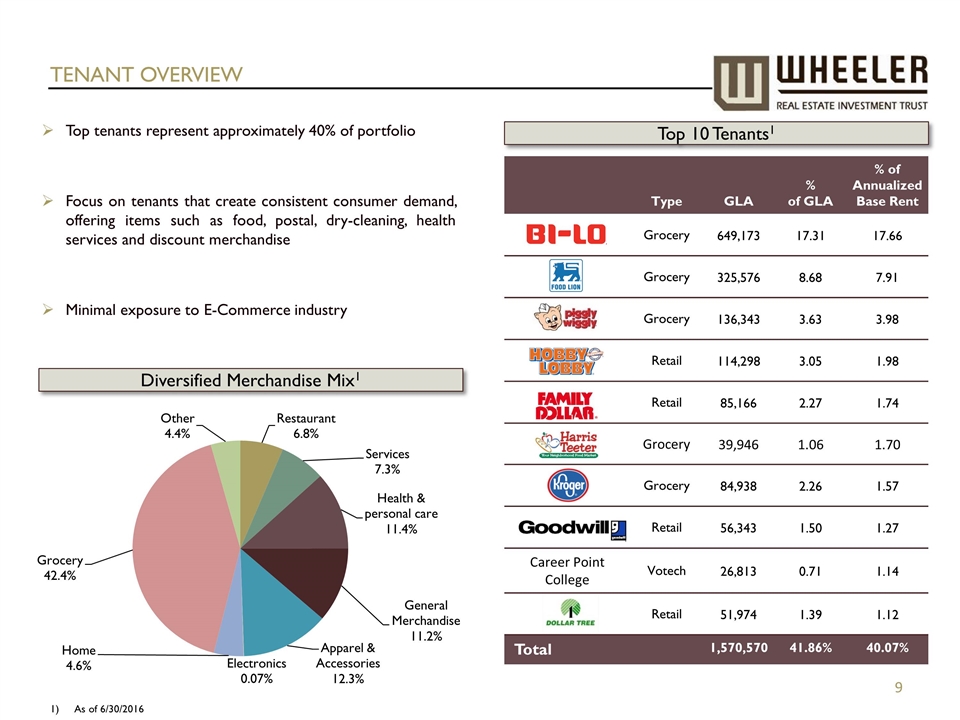
TENANT OVERVIEW Top tenants represent approximately 40% of portfolio Focus on tenants that create consistent consumer demand, offering items such as food, postal, dry-cleaning, health services and discount merchandise Minimal exposure to E-Commerce industry As of 6/30/2016 Top 10 Tenants1 Diversified Merchandise Mix1 Type GLA % of GLA % of Annualized Base Rent Grocery 649,173 17.31 17.66 Grocery 325,576 8.68 7.91 Grocery 136,343 3.63 3.98 Retail 114,298 3.05 1.98 Retail 85,166 2.27 1.74 Grocery 39,946 1.06 1.70 Grocery 84,938 2.26 1.57 Retail 56,343 1.50 1.27 Career Point College Votech 26,813 0.71 1.14 Retail 51,974 1.39 1.12 Total 1,570,570 41.86% 40.07%
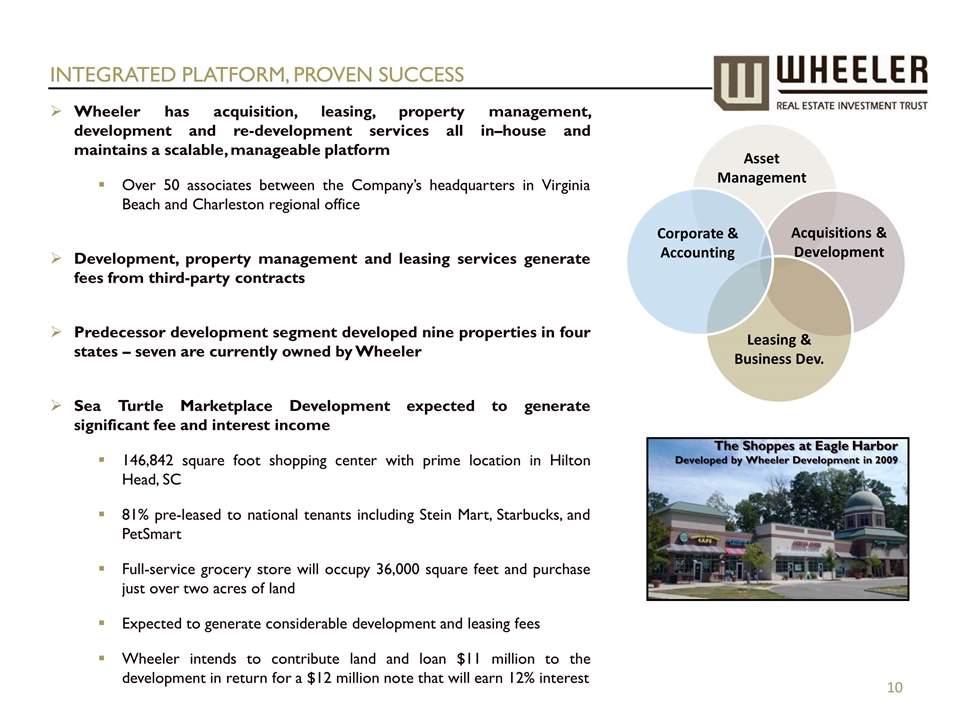
Integrated Platform, Proven Success Wheeler has acquisition, leasing, property management, development and re-development services all in–house and maintains a scalable, manageable platform Over 50 associates between the Company’s headquarters in Virginia Beach and Charleston regional office Development, property management and leasing services generate fees from third-party contracts Predecessor development segment developed nine properties in four states – seven are currently owned by Wheeler Sea Turtle Marketplace Development expected to generate significant fee and interest income 146,842 square foot shopping center with prime location in Hilton Head, SC 81% pre-leased to national tenants including Stein Mart, Starbucks, and PetSmart Full-service grocery store will occupy 36,000 square feet and purchase just over two acres of land Expected to generate considerable development and leasing fees Wheeler intends to contribute land and loan $11 million to the development in return for a $12 million note that will earn 12% interest Asset Management Acquisitions & Development Leasing & Business Dev. The Shoppes at Eagle Harbor Developed by Wheeler Development in 2009 Corporate & Accounting
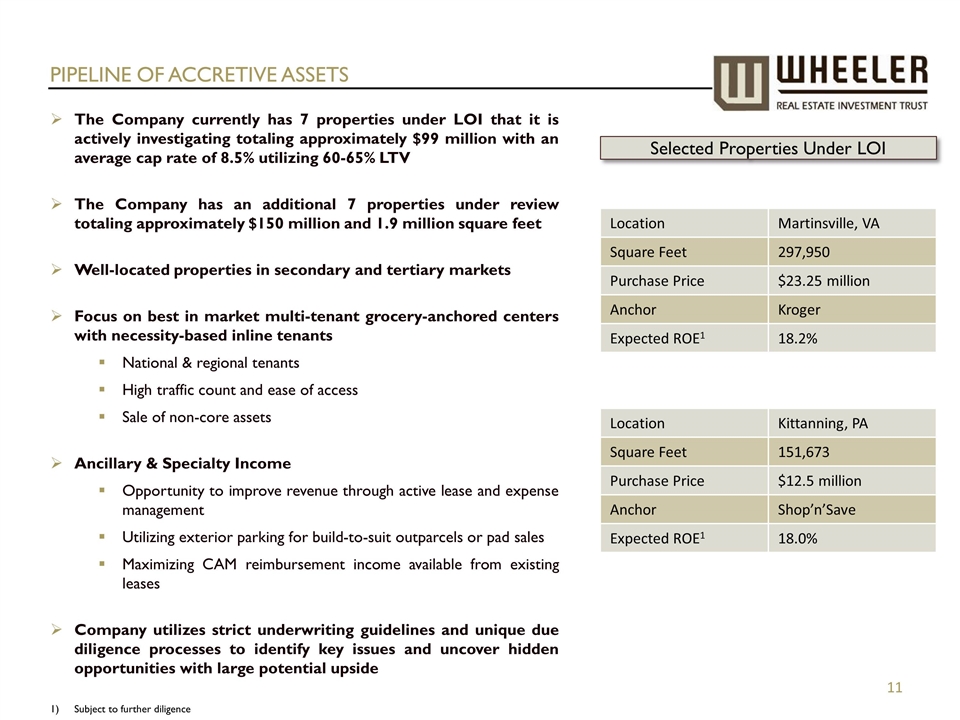
PIPELINE OF ACCRETIVE ASSETS Butler Square The Company currently has 7 properties under LOI that it is actively investigating totaling approximately $99 million with an average cap rate of 8.5% utilizing 60-65% LTV The Company has an additional 7 properties under review totaling approximately $150 million and 1.9 million square feet Well-located properties in secondary and tertiary markets Focus on best in market multi-tenant grocery-anchored centers with necessity-based inline tenants National & regional tenants High traffic count and ease of access Sale of non-core assets Ancillary & Specialty Income Opportunity to improve revenue through active lease and expense management Utilizing exterior parking for build-to-suit outparcels or pad sales Maximizing CAM reimbursement income available from existing leases Company utilizes strict underwriting guidelines and unique due diligence processes to identify key issues and uncover hidden opportunities with large potential upside Selected Properties Under LOI Location Martinsville, VA Square Feet 297,950 Purchase Price $23.25 million Anchor Kroger Expected ROE1 18.2% Location Kittanning, PA Square Feet 151,673 Purchase Price $12.5 million Anchor Shop’n’Save Expected ROE1 18.0% Subject to further diligence
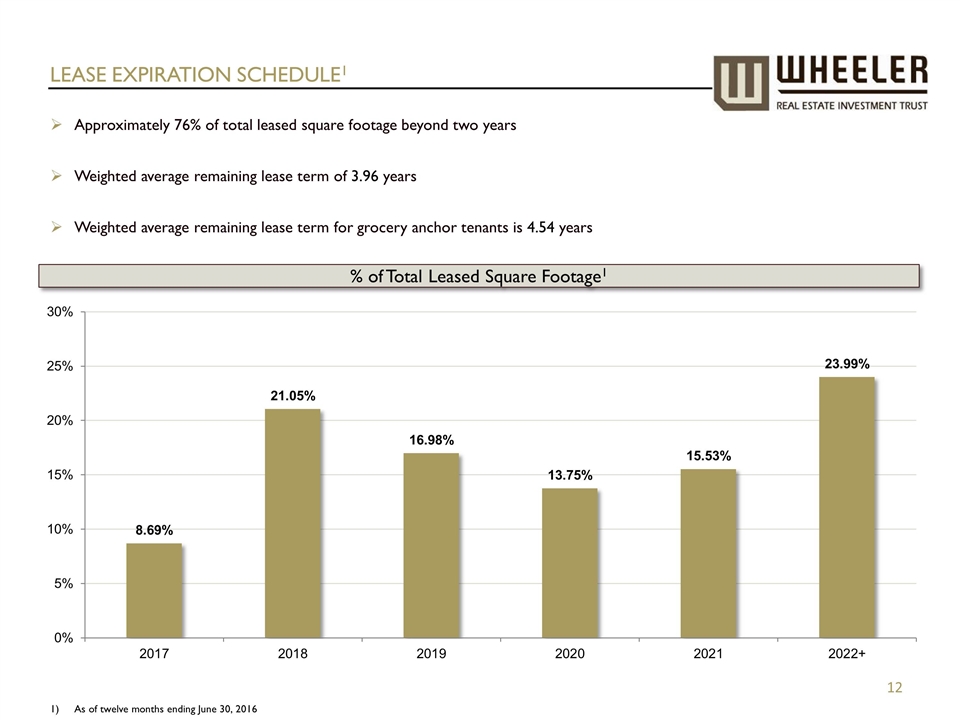
LEASE EXPIRATION SCHEDULE1 Approximately 76% of total leased square footage beyond two years Weighted average remaining lease term of 3.96 years Weighted average remaining lease term for grocery anchor tenants is 4.54 years As of twelve months ending June 30, 2016 % of Total Leased Square Footage1
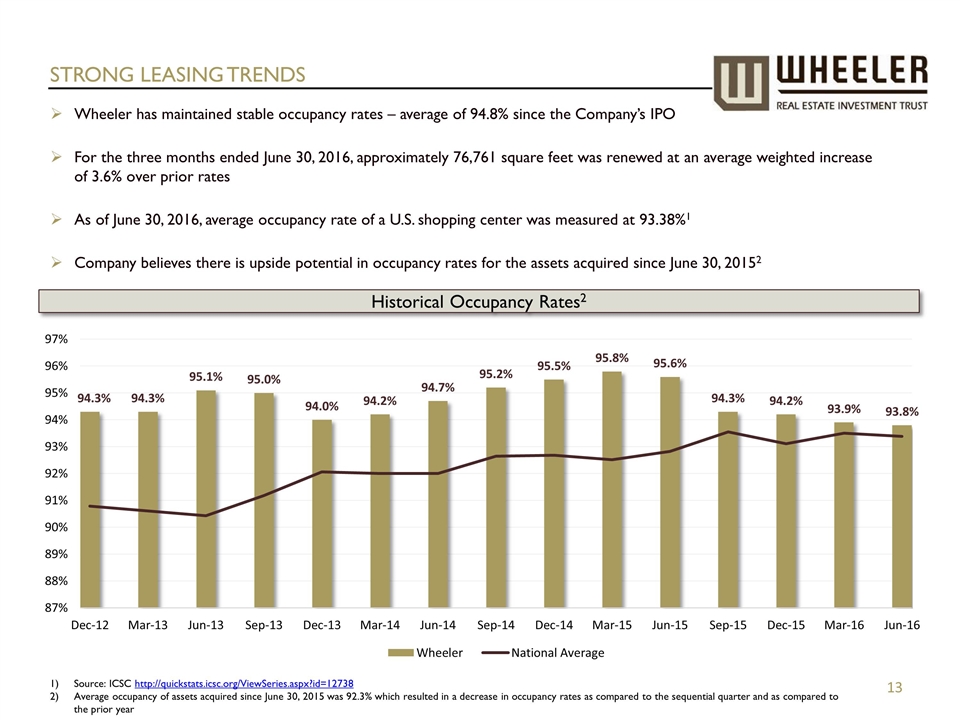
STRONG LEASING TRENDS Wheeler has maintained stable occupancy rates – average of 94.8% since the Company’s IPO For the three months ended June 30, 2016, approximately 76,761 square feet was renewed at an average weighted increase of 3.6% over prior rates As of June 30, 2016, average occupancy rate of a U.S. shopping center was measured at 93.38%1 Company believes there is upside potential in occupancy rates for the assets acquired since June 30, 20152 Source: ICSC http://quickstats.icsc.org/ViewSeries.aspx?id=12738 Average occupancy of assets acquired since June 30, 2015 was 92.3% which resulted in a decrease in occupancy rates as compared to the sequential quarter and as compared to the prior year Historical Occupancy Rates2
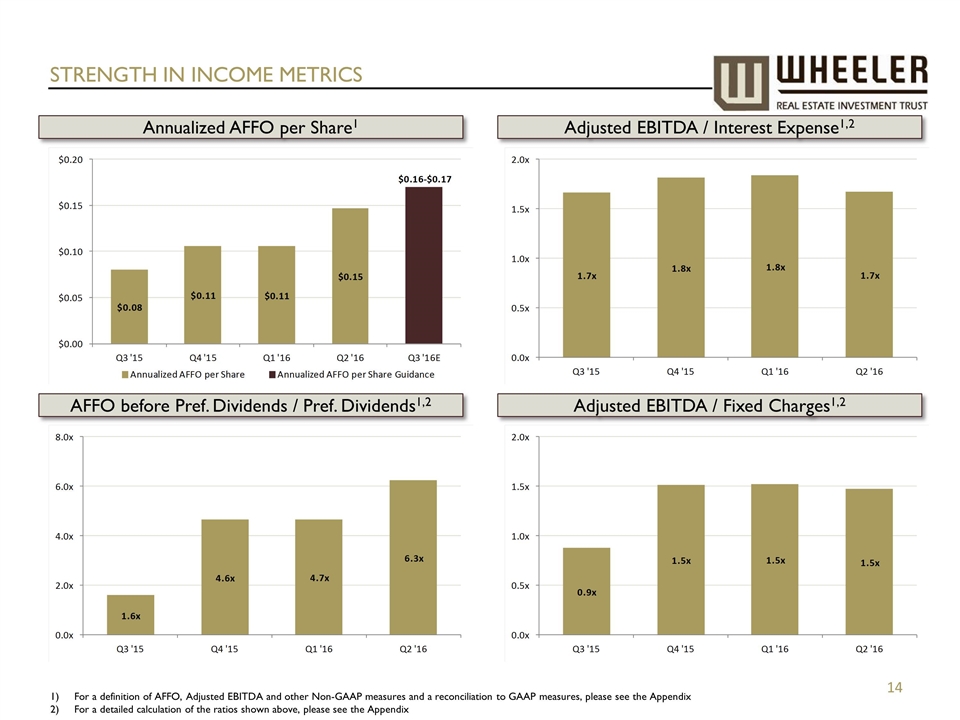
STRENGTH IN INCOME METRICS Butler Square Adjusted EBITDA / Interest Expense1,2 Adjusted EBITDA / Fixed Charges1,2 AFFO before Pref. Dividends / Pref. Dividends1,2 Annualized AFFO per Share1 For a definition of AFFO, Adjusted EBITDA and other Non-GAAP measures and a reconciliation to GAAP measures, please see the Appendix For a detailed calculation of the ratios shown above, please see the Appendix
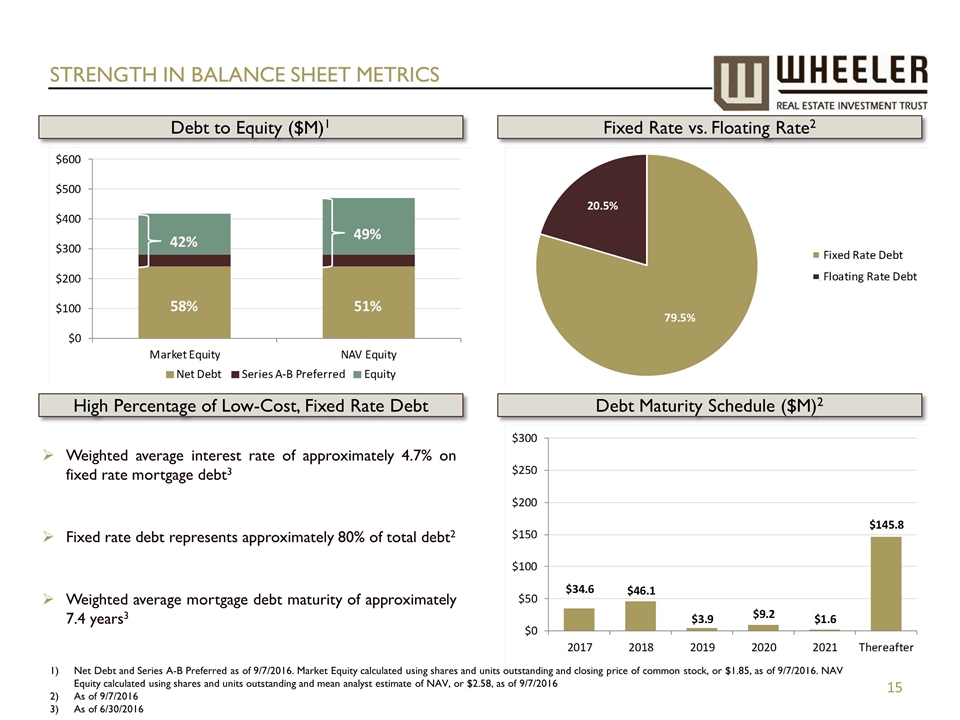
STRENGTH IN BALANCE SHEET METRICS Butler Square Fixed Rate vs. Floating Rate2 Debt Maturity Schedule ($M)2 High Percentage of Low-Cost, Fixed Rate Debt Debt to Equity ($M)1 42% 58% 49% 51% Net Debt and Series A-B Preferred as of 9/7/2016. Market Equity calculated using shares and units outstanding and closing price of common stock, or $1.85, as of 9/7/2016. NAV Equity calculated using shares and units outstanding and mean analyst estimate of NAV, or $2.58, as of 9/7/2016 As of 9/7/2016 As of 6/30/2016 Weighted average interest rate of approximately 4.7% on fixed rate mortgage debt3 Fixed rate debt represents approximately 80% of total debt2 Weighted average mortgage debt maturity of approximately 7.4 years3
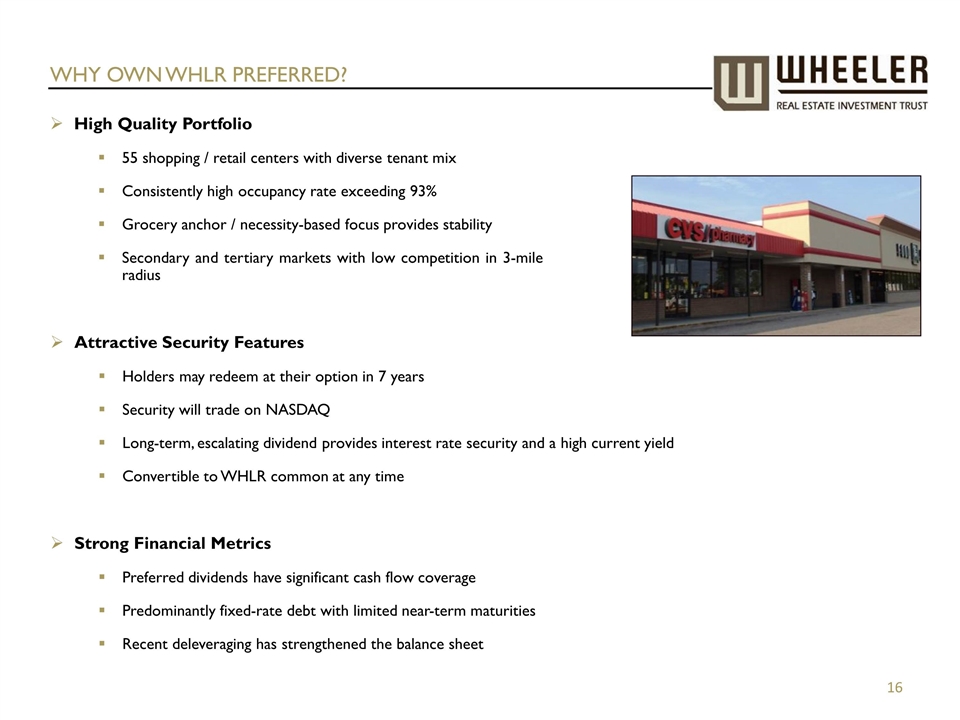
WHY OWN WHLR PREFERRED? High Quality Portfolio 55 shopping / retail centers with diverse tenant mix Consistently high occupancy rate exceeding 93% Grocery anchor / necessity-based focus provides stability Secondary and tertiary markets with low competition in 3-mile radius Attractive Security Features Holders may redeem at their option in 7 years Security will trade on NASDAQ Long-term, escalating dividend provides interest rate security and a high current yield Convertible to WHLR common at any time Strong Financial Metrics Preferred dividends have significant cash flow coverage Predominantly fixed-rate debt with limited near-term maturities Recent deleveraging has strengthened the balance sheet

Appendix
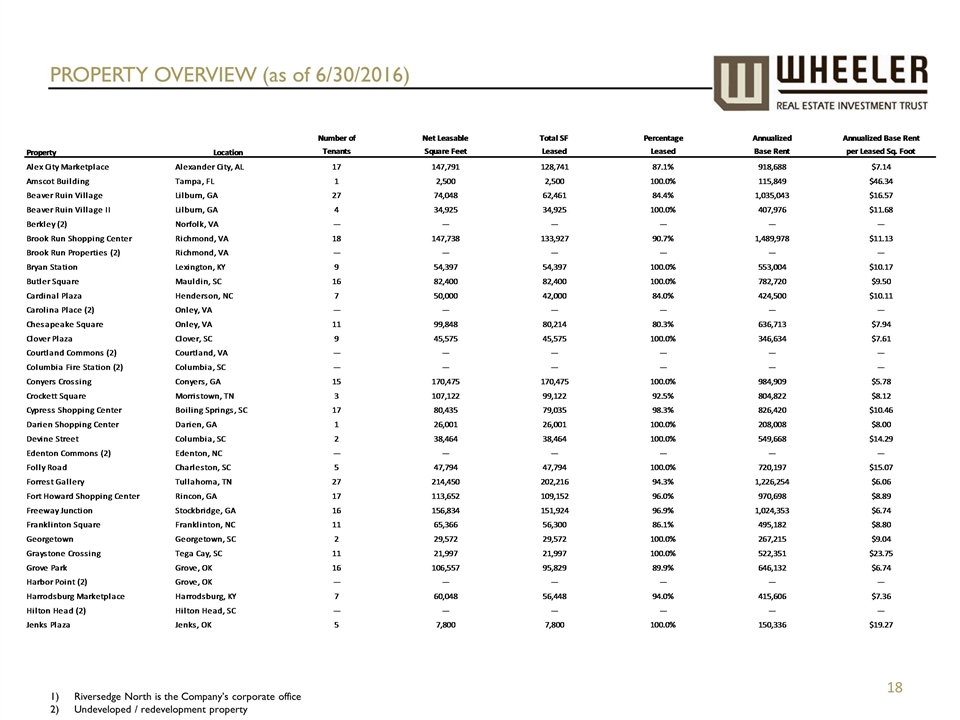
PROPERTY OVERVIEW (as of 6/30/2016) Riversedge North is the Company’s corporate office Undeveloped / redevelopment property
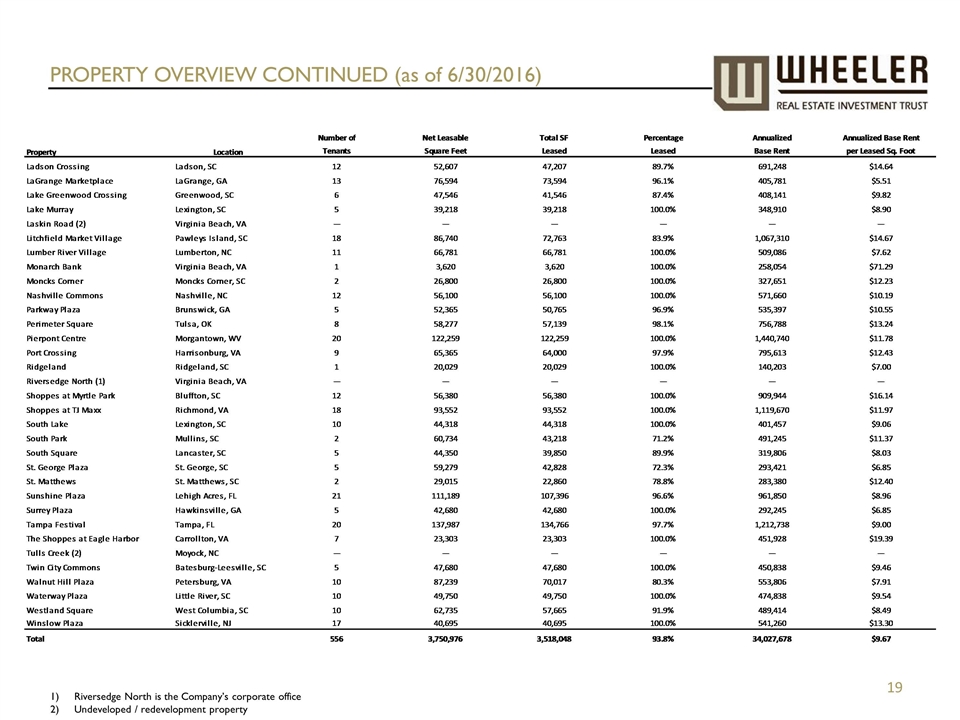
PROPERTY OVERVIEW CONTINUED (as of 6/30/2016) Riversedge North is the Company’s corporate office Undeveloped / redevelopment property
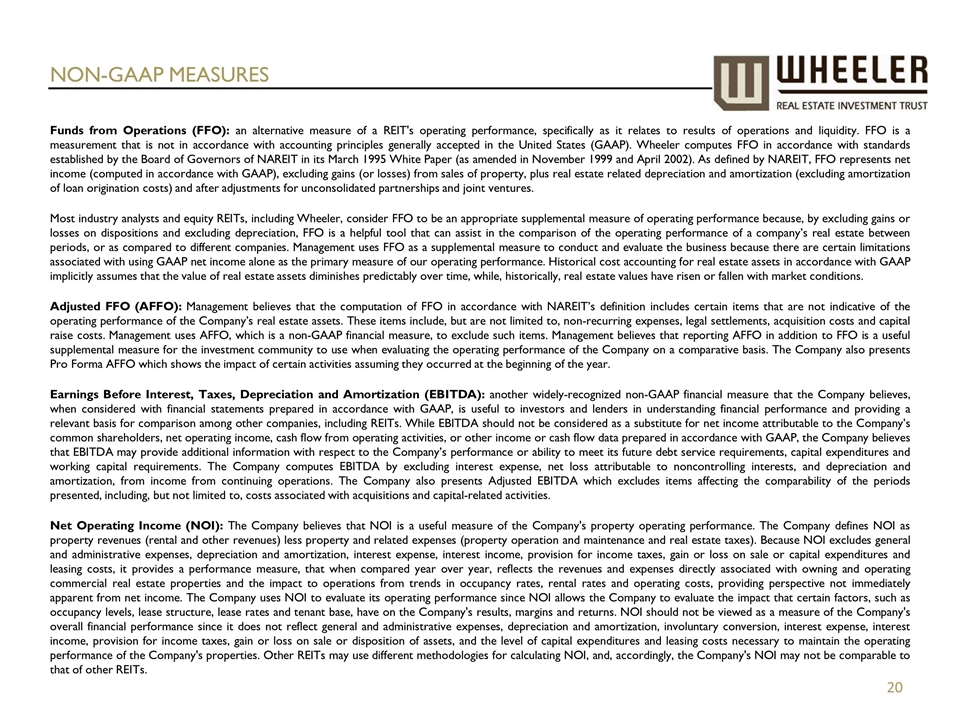
NON-GAAP MEASURES Funds from Operations (FFO): an alternative measure of a REIT's operating performance, specifically as it relates to results of operations and liquidity. FFO is a measurement that is not in accordance with accounting principles generally accepted in the United States (GAAP). Wheeler computes FFO in accordance with standards established by the Board of Governors of NAREIT in its March 1995 White Paper (as amended in November 1999 and April 2002). As defined by NAREIT, FFO represents net income (computed in accordance with GAAP), excluding gains (or losses) from sales of property, plus real estate related depreciation and amortization (excluding amortization of loan origination costs) and after adjustments for unconsolidated partnerships and joint ventures. Most industry analysts and equity REITs, including Wheeler, consider FFO to be an appropriate supplemental measure of operating performance because, by excluding gains or losses on dispositions and excluding depreciation, FFO is a helpful tool that can assist in the comparison of the operating performance of a company’s real estate between periods, or as compared to different companies. Management uses FFO as a supplemental measure to conduct and evaluate the business because there are certain limitations associated with using GAAP net income alone as the primary measure of our operating performance. Historical cost accounting for real estate assets in accordance with GAAP implicitly assumes that the value of real estate assets diminishes predictably over time, while, historically, real estate values have risen or fallen with market conditions. Adjusted FFO (AFFO): Management believes that the computation of FFO in accordance with NAREIT’s definition includes certain items that are not indicative of the operating performance of the Company’s real estate assets. These items include, but are not limited to, non-recurring expenses, legal settlements, acquisition costs and capital raise costs. Management uses AFFO, which is a non-GAAP financial measure, to exclude such items. Management believes that reporting AFFO in addition to FFO is a useful supplemental measure for the investment community to use when evaluating the operating performance of the Company on a comparative basis. The Company also presents Pro Forma AFFO which shows the impact of certain activities assuming they occurred at the beginning of the year. Earnings Before Interest, Taxes, Depreciation and Amortization (EBITDA): another widely-recognized non-GAAP financial measure that the Company believes, when considered with financial statements prepared in accordance with GAAP, is useful to investors and lenders in understanding financial performance and providing a relevant basis for comparison among other companies, including REITs. While EBITDA should not be considered as a substitute for net income attributable to the Company’s common shareholders, net operating income, cash flow from operating activities, or other income or cash flow data prepared in accordance with GAAP, the Company believes that EBITDA may provide additional information with respect to the Company’s performance or ability to meet its future debt service requirements, capital expenditures and working capital requirements. The Company computes EBITDA by excluding interest expense, net loss attributable to noncontrolling interests, and depreciation and amortization, from income from continuing operations. The Company also presents Adjusted EBITDA which excludes items affecting the comparability of the periods presented, including, but not limited to, costs associated with acquisitions and capital-related activities. Net Operating Income (NOI): The Company believes that NOI is a useful measure of the Company's property operating performance. The Company defines NOI as property revenues (rental and other revenues) less property and related expenses (property operation and maintenance and real estate taxes). Because NOI excludes general and administrative expenses, depreciation and amortization, interest expense, interest income, provision for income taxes, gain or loss on sale or capital expenditures and leasing costs, it provides a performance measure, that when compared year over year, reflects the revenues and expenses directly associated with owning and operating commercial real estate properties and the impact to operations from trends in occupancy rates, rental rates and operating costs, providing perspective not immediately apparent from net income. The Company uses NOI to evaluate its operating performance since NOI allows the Company to evaluate the impact that certain factors, such as occupancy levels, lease structure, lease rates and tenant base, have on the Company's results, margins and returns. NOI should not be viewed as a measure of the Company's overall financial performance since it does not reflect general and administrative expenses, depreciation and amortization, involuntary conversion, interest expense, interest income, provision for income taxes, gain or loss on sale or disposition of assets, and the level of capital expenditures and leasing costs necessary to maintain the operating performance of the Company's properties. Other REITs may use different methodologies for calculating NOI, and, accordingly, the Company's NOI may not be comparable to that of other REITs.
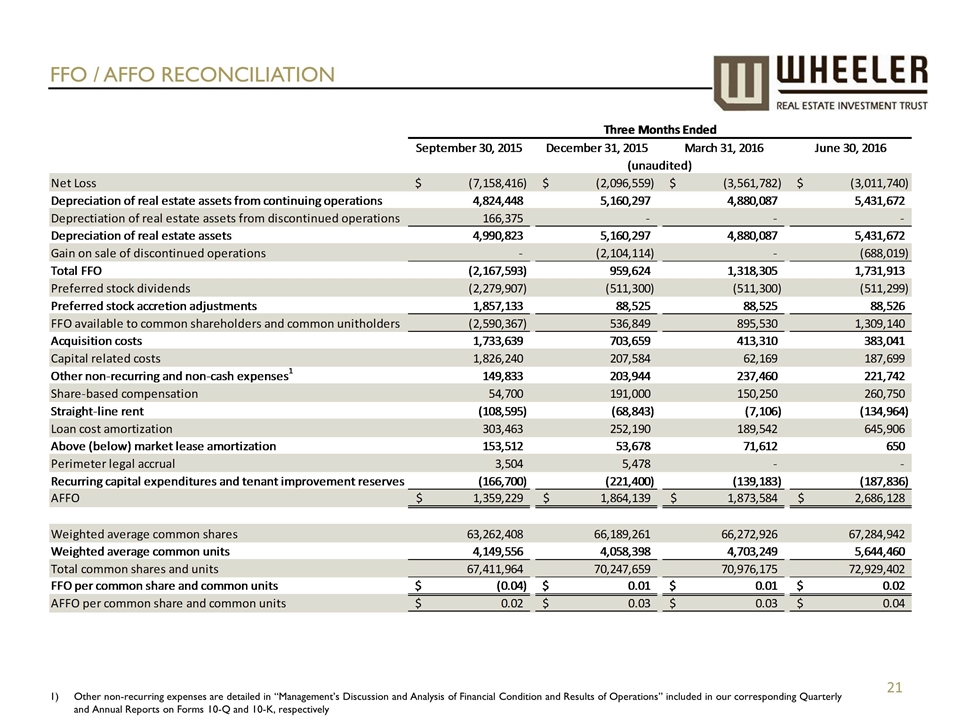
FFO / AFFO RECONCILIATION Other non-recurring expenses are detailed in “Management’s Discussion and Analysis of Financial Condition and Results of Operations” included in our corresponding Quarterly and Annual Reports on Forms 10-Q and 10-K, respectively
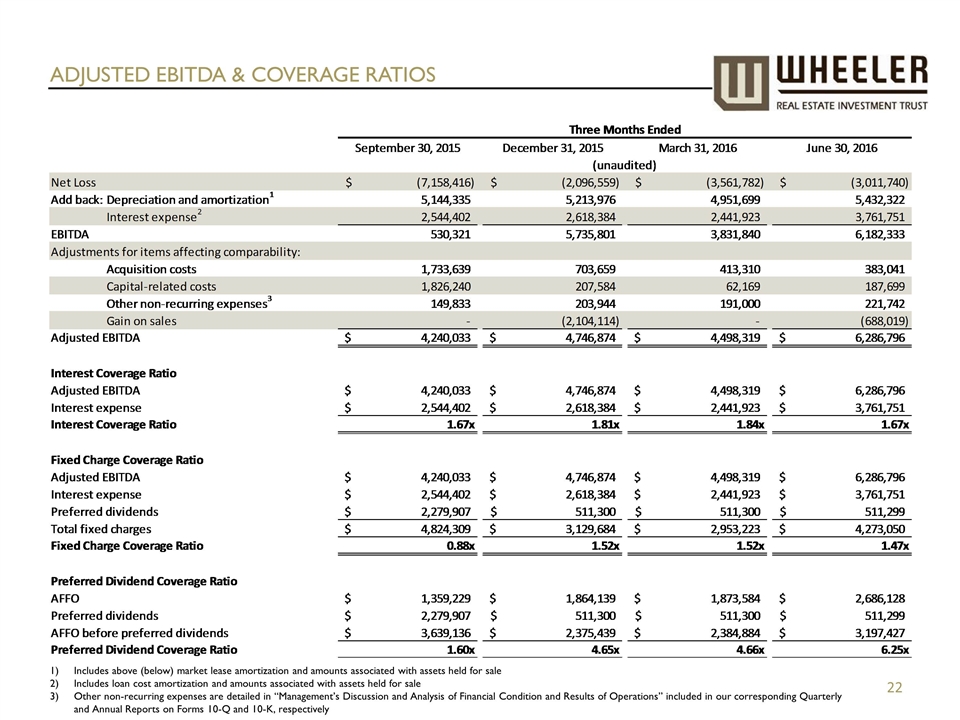
ADJUSTED EBITDA & COVERAGE RATIOS Includes above (below) market lease amortization and amounts associated with assets held for sale Includes loan cost amortization and amounts associated with assets held for sale Other non-recurring expenses are detailed in “Management’s Discussion and Analysis of Financial Condition and Results of Operations” included in our corresponding Quarterly and Annual Reports on Forms 10-Q and 10-K, respectively
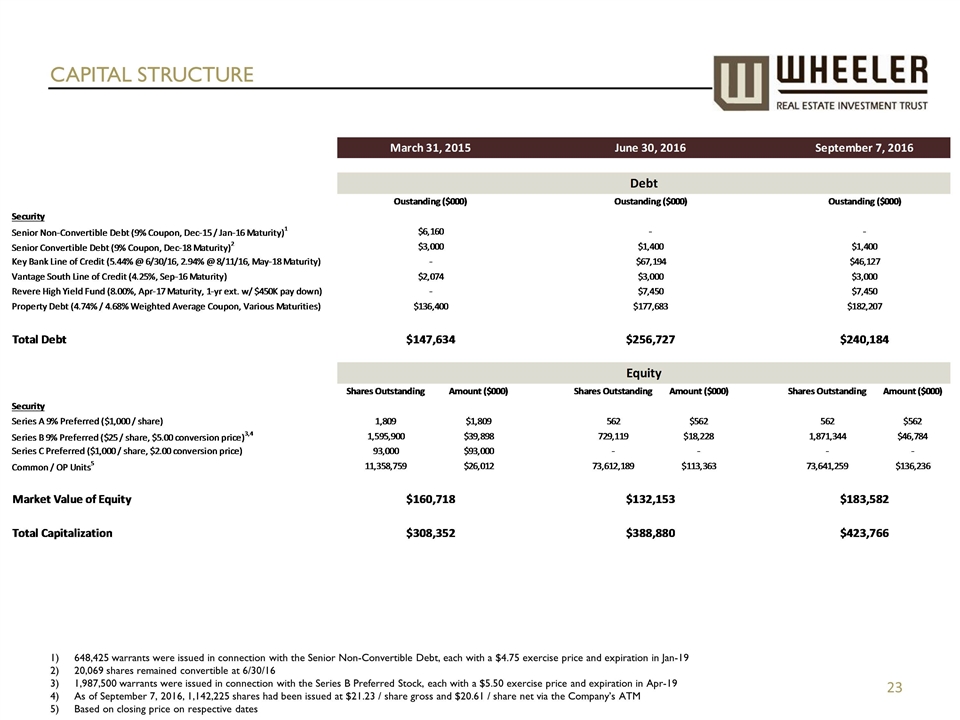
CAPITAL STRUCTURE 648,425 warrants were issued in connection with the Senior Non-Convertible Debt, each with a $4.75 exercise price and expiration in Jan-19 20,069 shares remained convertible at 6/30/16 1,987,500 warrants were issued in connection with the Series B Preferred Stock, each with a $5.50 exercise price and expiration in Apr-19 As of September 7, 2016, 1,142,225 shares had been issued at $21.23 / share gross and $20.61 / share net via the Company’s ATM Based on closing price on respective dates

NASDAQ: WHLR Think Retail. Think Wheeler.®