Exhibit 99.1
| Exhibit 99.1
|
Exhibit 99.1
WHEELER
REAL ESTATE INVESTMENT TRUST
June 2015
NASDAQ: WHLR 1
|
|
| 2 |
|
SAFE HARBOR
Wheeler Real Estate Investment Trust, Inc. (the ”Company”) considers portions of the information in this presentation to be forward-looking statements within the meaning of Section 27A of the Securities Act of 1933 and Section 21E of the Securities Exchange Act of 1934, both as amended, with respect to the Company’s expectation for future periods. Although the Company believes that the expectations reflected in such forward-looking statements are based upon reasonable assumptions, it can give no assurance that its expectations will be achieved. For this purpose, any statements contained herein that are not historical fact may be deemed to be forward-looking statements. There are a number of important factors that could cause results to differ materially from those indicated by such forward-looking statements, including, among other factors, local conditions such as oversupply of space or a reduction in demand for real estate in the area; competition from other available space; dependence on rental income from real property; the loss of, significant downsizing of or bankruptcy of a major tenant; constructing properties or expansions that produce a desired yield on investment; the Company’s ability to renew or enter into new leases at favorable rates; to buy or sell assets on commercially reasonable terms; to complete acquisitions or dispositions of assets under contract, to secure equity or debt financing on commercially acceptable terms or at all; to enter into definitive agreements with regard to financing and joint venture arrangements or the Company’s failure to satisfy conditions to the completion of these arrangements. For additional factors that could cause the results of the Company to differ materially from those indicated in the forward-looking statements, please refer to “Risk Factors” listed in the Company’s most annual report filed with the SEC and available for review at www.sec.gov. Readers are cautioned that forward looking statements are not guarantees of future performance, and should not place undue reliance on them. In formulating the forward looking statements contained in this presentation, it has been assumed that business and economic conditions affecting Wheeler will continue substantially in the ordinary course. These assumptions, although considered reasonable at the time of preparation, may prove to be incorrect.
|
|
WHEELER
REAL ESTATE INVESTMENT TRUST
COMPANY OVERVIEW
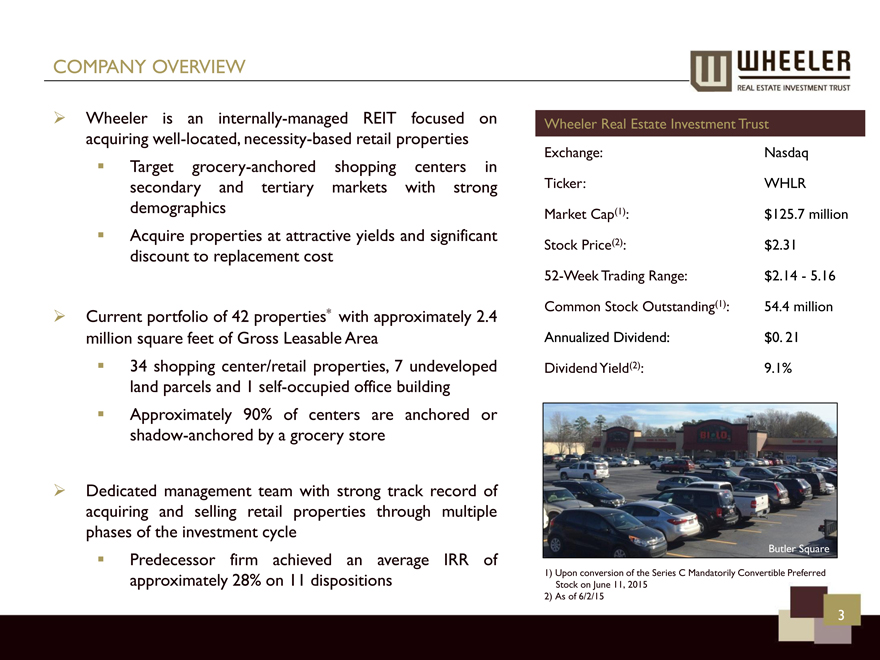
Wheeler is an internally-managed REIT focused on acquiring well-located, necessity-based retail properties
Target grocery-anchored shopping centers in secondary and tertiary markets with strong demographics
Acquire properties at attractive yields and significant discount to replacement cost
Current portfolio of 42 properties* with approximately 2.4 million square feet of Gross Leasable Area
34 shopping center/retail properties, 7 undeveloped land parcels and 1 self-occupied office building
Approximately 90% of centers are anchored or shadow-anchored by a grocery store
Dedicated management team with strong track record of acquiring and selling retail properties through multiple phases of the investment cycle? Predecessor firm achieved an average IRR of approximately 28% on 11 dispositions
Wheeler Real Estate InvestmentTrust
Exchange: Nasdaq
Ticker: WHLR
Market Cap(1): $125.7 million
Stock Price(2): $2.31
52-Week Trading Range: $2.14 -5.16
Common StockOutstanding(1): 54.4 million
Annualized Dividend: $0. 21
Dividend Yield(2): 9.1%
1) Upon conversion of the Series C Mandatorily Convertible Preferred Stock on June 11, 2015
2)As of 6/2/15
WHEELER
REAL ESTATE INVESTMENT TRUST
| 3 |
|
|
|
INVESTMENT HIGHLIGHTS
Necessity-Based Wheeler properties serve the essential day-to-day shopping needs of the surrounding
Retail communities
Majority of tenants provide non-cyclical consumer goods and services that we believe are less impacted by fluctuations in the economy
High Quality Existing Industry leading occupancy rate of approximately 95%
Portfolio National and Regional merchants represent majority of Wheeler’s tenants
Diversified geography and tenant base
Attractive Niche Secondary and Tertiary markets have limited competition from institutional buyers and low
Market Opportunity levels of new construction
Target markets experiencing selling pressure from generational transition, larger REITs
shifting to core markets and expiring CMBS debt
Internally-Managed, Ability to scale platform as the Company grows results in improved profitability
Scalable Platform Create value through intensive leasing and property expense management
Deep retailer relationships provide unique market knowledge
Third-party property management and development fees create additional revenue stream
WHEELER
REAL ESTATE INVESTMENT TRUST 4
|
|
SEASONED, ACCOMPLISHED & REPUTABLE MANAGEMENT TEAM
WHLR’s executive officers, together with the management teams of its service companies, have an aggregate of over 150 years of experience in the real estate industry.
Jon S. Wheeler
Chairman and CEO
Over 33 years of experience in the real estate industry
In 1999, founded Wheeler Interests, LLC (“Wheeler Interests”), a company, which we consider our predecessor firm, that focuses on the acquisition, leasing, management, renovation & development of commercial shopping center properties
Overseen the acquisition of over 60 properties with Wheeler Interests
Steven M. Belote
Chief Financial Officer
Wheeler’s Chief Financial Officer since 2011
Prior to joining Wheeler, worked at Shore Bank, as their CFO, playing a significant role in IPO during 1997
Previous experience also includes seven years at BDO Seidman, LLP, a large international public accounting and consulting firm
Dave Kelly
SVP, Director of Acquisitions
Over 25 years of experience in the real estate industry
Previously served 13 years as Director of Real Estate for Supervalu, Inc., a Fortune 100 supermarket retailer
Focused on site selection and acquisition for Supervalu from New England to the Carolinas completing transactions totaling over $500 million
Jeff Parker
Director of Leasing
Recently joined Wheeler and is responsible for overseeing all leasing operations of the portfolio
Previously served as Real Estate Portfolio Manager for Southeast and Mid-Atlantic regions for Dollar Tree
Prior to Dollar Tree, Mr. Parker spent ten years handling the leasing and sale of commercial properties at CB Richard Ellis, Inc.
5
|
|
GROWTH STORY
As of June 2015, Wheeler owns 35 retail properties with a total GLA of 2,404,334 square feet and 7 undeveloped locations totaling approximately 66 acres of land.
Square Footage
2,500,000
2,000,000
1,500,000
1,000,000
500,000
0
Gross Leasable Area
09/30/12 12/31/12 03/31/13 06/30/13 09/30/13 12/31/13 03/31/14 06/30/14 09/30/14 12/31/14 3/31/2015 6/2/2015
Completes IPO, begins trading on NASDAQ
Completes a $4.5 million private placement transaction.
Closes secondary offering, $11.9 million raised
Completes a $10 million offering and sale of convertible and nonconvertible 9% senior notes and warrants (First part of a two tranche private placement transaction)
Completes offering and sale Series B Preferred Stock and warrants for net proceeds of $18.7 million
Completes transition to an internally-managed REIT with the acquisition of operating companies
Secures $25 million guidance line of credit facility with KeyBank National Association
Addition of Wheeler Development
Raised an additional $2.2 million of 9% non-convertible senior notes and warrants to purchase shares of Wheeler common stock. Second Tranche of Financing. (Completed initial portion Dec. 2013).
Opens regional office in Charleston, South Carolina
Completes follow-on offering and sale of Series B
Preferred Stock and warrants for gross proceeds of $20.5 million
Completes Series C Preferred Stock private placement transaction, which generates gross proceeds of $90 million and the cancelation of $3 million in existing convertible debt.
Secures $45 Million Credit Facility With Keybank
Signs non-binding joint venture agreement with Lightbridge
45 40 35 30 25 20 15 10 5 0
Number of Properties 6
|
|
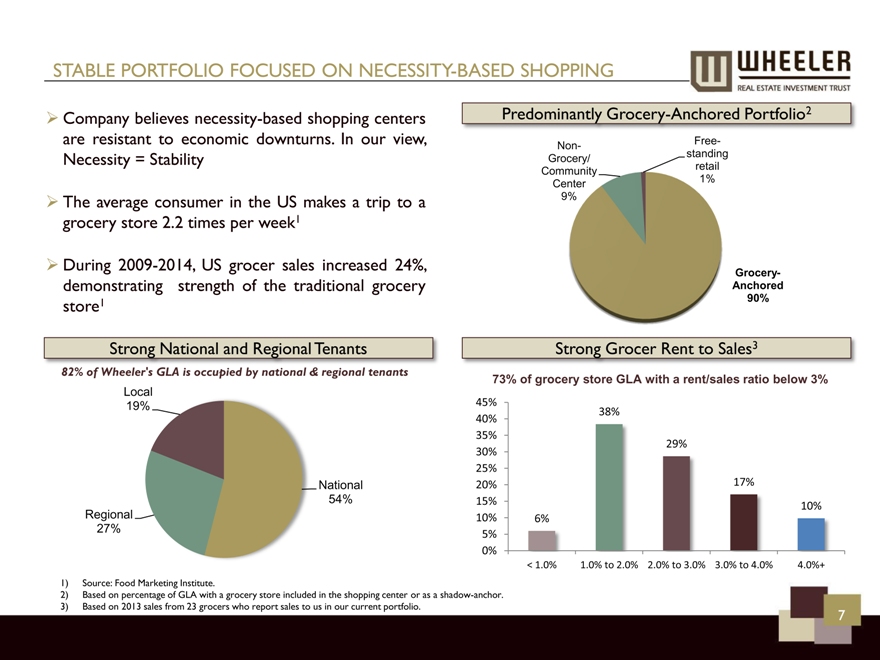
STABLE PORTFOLIO FOCUSED ON NECESSITY-BASED SHOPPING
Company believes necessity-based shopping centers are resistant to economic downturns. In our view, Necessity = Stability
The average consumer in the US makes a trip to a grocery store 2.2 times per week1
During 2009-2014, US grocer sales increased 24%, demonstrating strength of the traditional grocery store1
Strong National and Regional Tenants
82% of Wheeler’s GLA is occupied by national & regional tenants
Local 19% Regional 27% National 54%
1) Source: Food Marketing Institute.
2) Based on percentage of GLA with a grocery store included in the shopping center or as a shadow-anchor.
3) Based on 2013 sales from 23 grocers who report sales to us in our current portfolio.
Predominantly Grocery-Anchored Portfolio2
Non-Grocery/ Community Center 9% Free-standing retail 1% Grocery-Anchored 90%
Strong Grocer Rent to Sales3
73% of grocery store GLA with a rent/sales ratio below 3%
45% 40% 35% 30% 25% 20% 15% 10% 5% 0%
< 1.0% 1.0% to 2.0% 2.0% to 3.0% 3.0% to 4.0% 4.0%+
6% 38% 29% 17% 10%
7
|
|
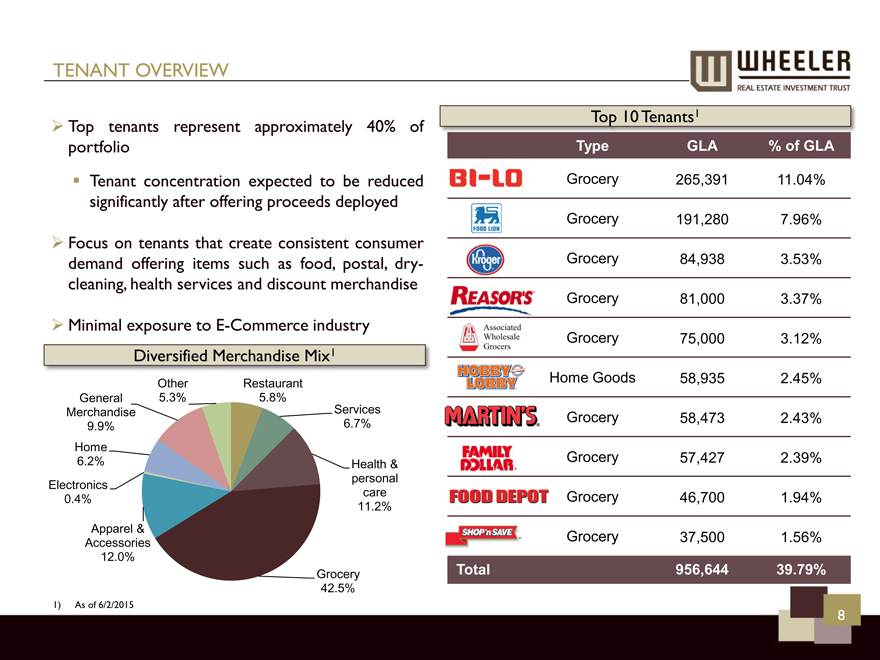
TENANT OVERVIEW
Top tenants represent approximately 40% of portfolio
Tenant concentration expected to be reduced significantly after offering proceeds deployed
Focus on tenants that create consistent consumer demand offering items such as food, postal, dry-cleaning, health services and discount merchandise
Minimal exposure to E-Commerce industry
Diversified Merchandise Mix1
General Merchandise 9.9% Home 6.2% Electronics 0.4%
Apparel & Accessories 12.0%
Other 5.3% Restaurant 5.8%
Services
6.7% Health & personal care 11.2% Grocery 42.5%
Top 10 Tenants1
1) As of 6/2/2015
Type
Grocery Grocery Grocery Grocery Grocery Home Goods Grocery Grocery Grocery Grocery
GLA
265,391 191,280 84,938 81,000 75,000 58,935 58,473 57,427 46,700 37,500 956,644
% of GLA
11.04% 7.96% 3.53% 3.37% 3.12% 2.45% 2.43% 2.39% 1.94% 1.56% 39.79% Total
8
|
|
LEASE EXPIRATION SCHEDULE1
Approximately 77% of GLA leased through 2016 or beyond
Weighted average remaining lease term of 4.71 years
Weighted average remaining lease term for grocery anchor tenants is 5.39 years
Significant renewals have occurred since 3/31/2015 totaling 59,143 square feet
% of Total Gross Leasable Area Expiring1
40.00% 35.00% 30.00% 25.00% 20.00% 15.00% 10.00% 5.00% 0.00%
1) As of 6/2/2015
2015 2016 2017 2018 2019 2020+
6.65% 11.93% 10.45% 18.96% 11.66% 35.53%
9
|
|
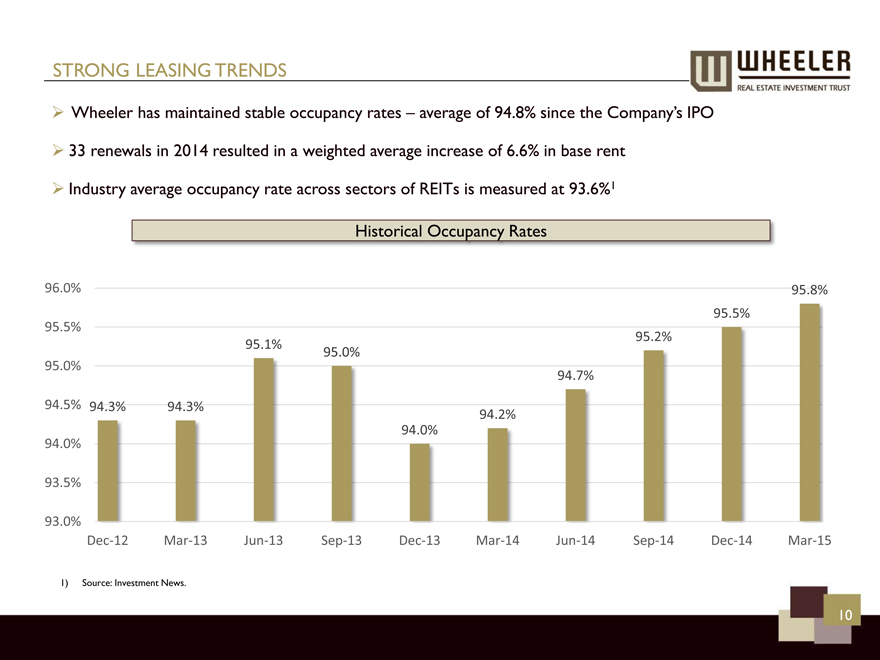
STRONG LEASING TRENDS
Wheeler has maintained stable occupancy rates – average of 94.8% since the Company’s IPO 33 renewals in 2014 resulted in a weighted average increase of 6.6% in base rent Industry average occupancy rate across sectors of REITs is measured at 93.6%1
96.0% 95.5% 95.0% 94.5% 94.0% 93.5% 93.0%
1) Source: Investment News.
Dec-12 Mar-13 Jun-13 Sep-13 Dec-13 Mar-14 Jun-14 Sep-14 Dec-14 Mar-15
94.3% 94.3% 95.1% 95.0% 94.2% 94.0% 94.7% 95.2% 95.5% 95.8%
10
|
|
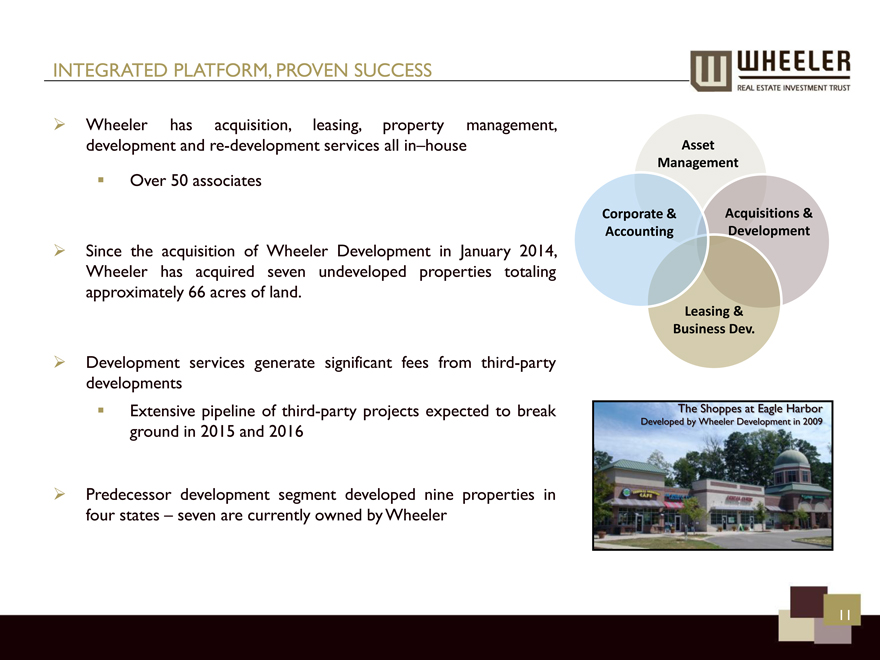
INTEGRATED PLATFORM, PROVEN SUCCESS
Wheeler has acquisition, leasing, property management, development and re-development services all in–house
Over 50 associates
Since the acquisition of Wheeler Development in January 2014, Wheeler has acquired seven undeveloped properties totaling approximately 66 acres of land.
Development services generate significant fees from third-party developments
Extensive pipeline of third-party projects expected to break ground in 2015 and 2016
Predecessor development segment developed nine properties in four states – seven are currently owned by Wheeler
Corporate & Accounting Asset Management Acquisitions & Development Leasing & Business Dev.
11
|
|
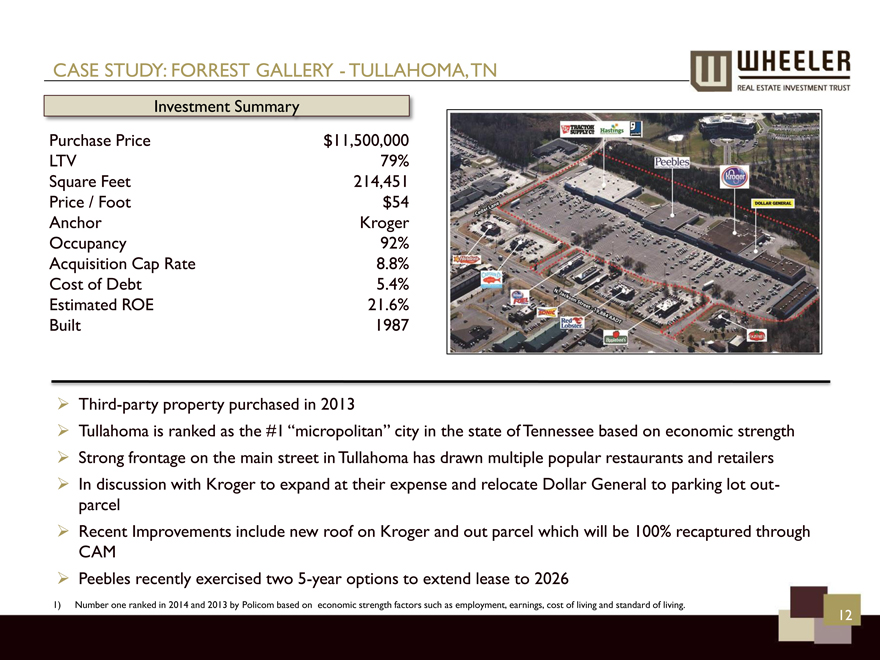
CASE STUDY: FORREST GALLERY—TULLAHOMA, TN
Investment Summary
Purchase Price $11,500,000 LTV 79% Square Feet 214,451 Price / Foot $54 Anchor Kroger Occupancy 92% Acquisition Cap Rate 8.8% Cost of Debt 5.4% Estimated ROE 21.6% Built 1987
Third-party property purchased in 2013
Tullahoma is ranked as the #1 “micropolitan” city in the state of Tennessee based on economic strength
Strong frontage on the main street in Tullahoma has drawn multiple popular restaurants and retailers In discussion with Kroger to expand at their expense and relocate Dollar General to parking lot out-parcel Recent Improvements include new roof on Kroger and out parcel which will be 100% recaptured through CAM
Peebles recently exercised two 5-year options to extend lease to 2026
1) Number one ranked in 2014 and 2013 by Policom based on economic strength factors such as employment, earnings, cost of living and standard of living.
12
|
|
PORT CROSSING – HARRISONBURG, VA
Investment Summary
NOI (2013) $805,438 Purchase Price $9,311,422 LTV 63% Square Feet 65,365 Price / Foot $142.45 Anchor Food Lion Occupancy 92% Acquisition Cap Rate 8.9% Cost of Debt 4.73% Estimated ROE 16.0% Built/Renovated 1999/2009
Wheeler legacy asset purchased in 2009
Home to James Madison University (JMU) with a student enrollment of over 20,000.
Prior to acquisition, we identified potential upside from significant infrastructure projects related to new construction for a nearby hospital and JMU athletic facility directly across the road Food Lion lease is triple net with no restriction on CAM pass through Accretive improvements to property include building small shops around the existing asset
Expanded restaurant space from 2,650 square feet to 4,100 square feet and backfilled with new tenant Delivered 2,400 square feet to Virginia ABC
13
|
|
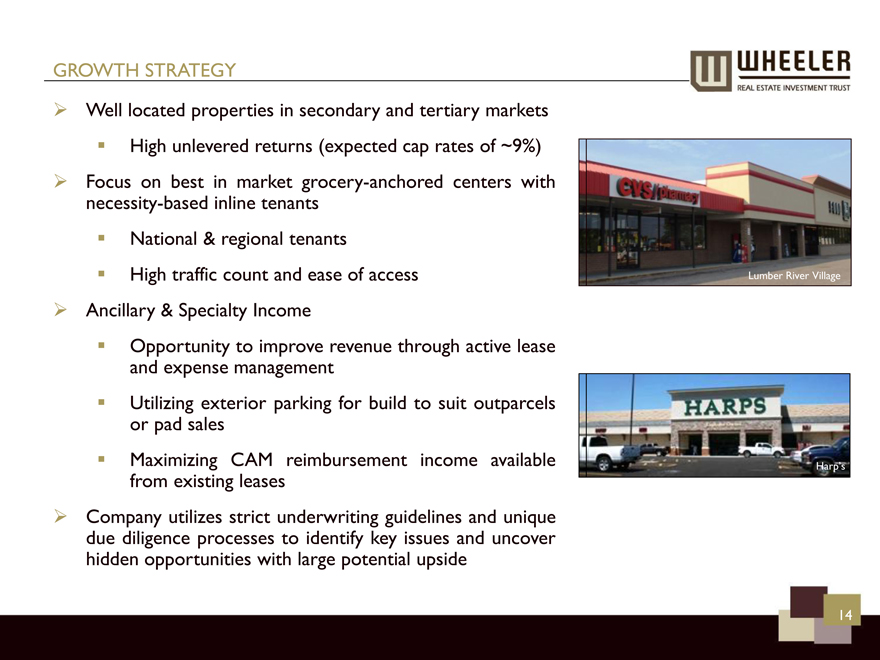
GROWTH STRATEGY
Well located properties in secondary and tertiary markets
High unlevered returns (expected cap rates of ~9%) Focus on best in market grocery-anchored centers with necessity-based inline tenants
National & regional tenants
High traffic count and ease of access Ancillary & Specialty Income
Opportunity to improve revenue through active lease and expense management
Utilizing exterior parking for build to suit outparcels or pad sales
Maximizing CAM reimbursement income available from existing leases Company utilizes strict underwriting guidelines and unique due diligence processes to identify key issues and uncover hidden opportunities with large potential upside
14
|
|
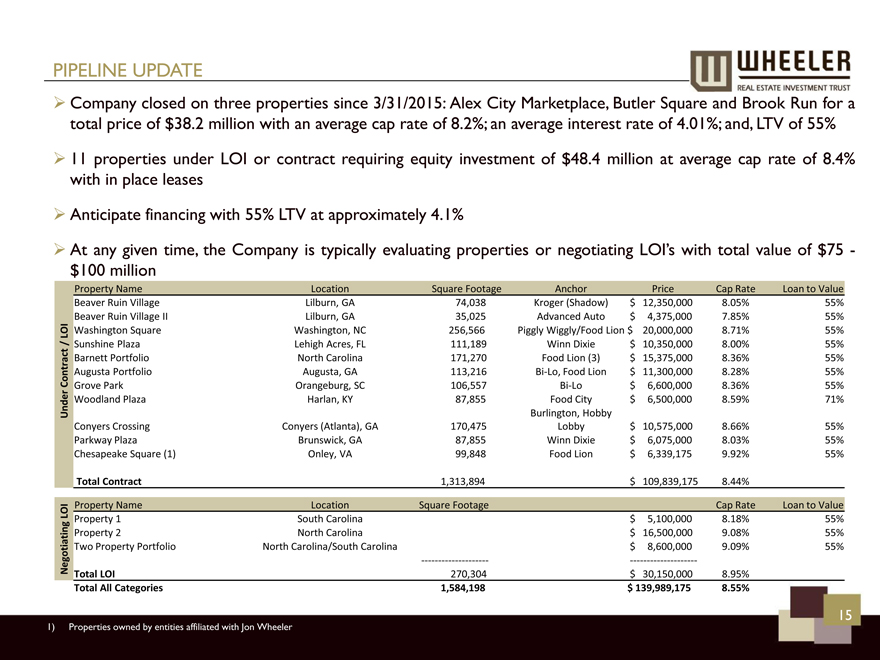
PIPELINE UPDATE
Company closed on three properties since 3/31/2015: Alex City Marketplace, Butler Square and Brook Run for a total price of $38.2 million with an average cap rate of 8.2%; an average interest rate of 4.01%; and, LTV of 55% 11 properties under LOI or contract requiring equity investment of $48.4 million at average cap rate of 8.4% with in place leases Anticipate financing with 55% LTV at approximately 4.1% At any given time, the Company is typically evaluating properties or negotiating LOI’s with total value of $75 -$100 million
Under Contract / LOI
Property Name Location Square Footage Anchor Price Cap Rate Loan to Value
Beaver Ruin Village Lilburn, GA 74,038 Kroger (Shadow) $ 12,350,000 8.05% 55%
Beaver Ruin Village II Lilburn, GA 35,025 Advanced Auto $ 4,375,000 Beaver 7.85% Ruin Village55%
Washington Square Washington, NC 256,566 Piggly Wiggly/Food Lion $ 20,000,000 8.71% 55%
Sunshine Plaza Lehigh Acres, FL 111,189 Winn Dixie $ 10,350,000 8.00% 55%
Barnett Portfolio North Carolina 171,270 Food Lion (3) $ 15,375,000 8.36% 55%
Augusta Portfolio Augusta, GA 113,216 Bi-Lo, Food Lion $ 11,300,000 8.28% 55%
Grove Park Orangeburg, SC 106,557 Bi-Lo $ 6,600,000 8.36% 55%
Woodland Plaza Harlan, KY 87,855 Food City $ 6,500,000 8.59% 71%
Burlington, Hobby
Conyers Crossing Conyers (Atlanta), GA 170,475 Lobby $ 10,575,000 8.66% 55%
Parkway Plaza Brunswick, GA 87,855 Winn Dixie $ 6,075,000 8.03% 55%
Chesapeake Square (1) Onley, VA 99,848 Food Lion $ 6,339,175 9.92% 55%
Total Contract 1,313,894 $ 109,839,175 8.44%
Negotiating LOI
Property Name Location Square Footage Cap Rate Loan to Value
Property 1 South Carolina $ 5,100,000 8.18% 55%
Property 2 North Carolina $ 16,500,000 9.08% 55%
Two Property Portfolio North Carolina/South Carolina $ 8,600,000 9.09% 55%
Total LOI 270,304 $ 30,150,000 8.95%
Total All Categories 1,584,198 $ 139,989,175 8.55%
15
|
|
INVESTMENT HIGHLIGHTS
Internally-Managed, Scalable Platform
Necessity-based Retail
High Quality Existing Portfolio
Attractive Niche Market Opportunity
16
|
|
Appendix
|
|
PROPERTY OVERVIEW (as of 6/2/2015)
Number of Net Leasable Percentage Annualized Annualized Base Rent per
Property Location Tenants Square Feet Total SF Leased Leased Base Rent Leased Sq. Foot
Alex City Marketplace Alexander City, AL 17 147,791 127,141 86.0%$ 951,791 $ 7.49
Amscot Building Tampa, FL 1 2,500 2,500 100.0% 100,738 40.30
Berkley (2) Norfolk, VA — — — — — —
Bixby Commons Bixby, OK 1 75,000 75,000 100.0% 768,500 10.25
Brook Run Properties (2) Richmond, VA — — — — — —
Brook Run Shopping Center Richmond, VA 18 147,738 134,791 91.2% 1,584,179 11.79
Bryan Station Lexington, KY 9 54,397 54,397 100.0% 553,008 10.17
Butler Square Maudlin, SC 16 82,400 82,400 100.0% 851,795 10.34
Clover Plaza Clover, SC 10 45,575 45,575 100.0% 349,843 7.68
Courtland Commons (2) Courtland, VA — — — — — —
Crockett Square Morristown, TN 4 107,122 107,122 100.0% 871,897 8.14
Cypress Shopping Center Boiling Springs, SC 13 80,435 73,785 91.7% 755,162 10.23
Edenton Commons (2) Edenton, NC — — — — — —
Forrest Gallery Tullahoma, TN 26 214,451 199,816 93.2% 1,181,234 5.91
Freeway Junction Stockbridge, GA 17 156,834 153,299 97.8% 1,010,753 6.59
Graystone Crossing Tega Cay, SC 11 21,997 21,997 100.0% 504,443 22.93
Harbor Point (2) Grove, OK — — — — — —
Harps at Harbor Point Grove, OK 1 31,500 31,500 100.0% 364,432 11.57
Harrodsburg Marketplace Harrodsburg, KY 8 60,048 58,248 97.0% 438,556 7.53
Jenks Plaza Jenks, OK 5 7,800 7,800 100.0% 143,416 18.39
Jenks Reasors Jenks, OK 1 81,000 81,000 100.0% 912,000 11.26
LaGrange Marketplace LaGrange, GA 13 76,594 71,494 93.3% 385,317 5.39
Laskin Road (2) Virginia Beach, VA — — — — — —
Lumber River Village Lumberton, NC 12 66,781 66,781 100.0% 497,490 7.45
Monarch Bank Virginia Beach, VA 1 3,620 3,620 100.0% 250,538 69.21
Perimeter Square Tulsa, OK 8 58,277 55,773 95.7% 677,789 12.15
Pierpont Centre Morgantown, WV 20 122,259 122,259 100.0% 1,327,437 10.86
Port Crossing Harrisonburg, VA 7 65,365 57,710 88.3% 737,392 12.78
Riversedge North (1) Virginia Beach, VA — — — — — —
Shoppes at TJ Maxx Richmond, VA 16 93,552 90,539 96.8% 1,062,636 11.74
South Square Lancaster, SC 5 44,350 39,850 89.9% 318,822 8.00
Starbucks/Verizon Virginia Beach, VA 2 5,600 5,600 100.0% 185,695 33.16
St. George Plaza St. George, SC 6 59,279 50,829 85.8% 357,393 7.03
Surrey Plaza Hawkinsville, GA 5 42,680 42,680 100.0% 291,495 6.83
Tampa Festival Tampa, FL 22 137,987 137,987 100.0% 1,224,828 8.88
The Shoppes at Eagle Harbor Carrollton, VA 7 23,303 23,303 100.0% 478,546 20.54
Tulls Creek (2) Moyock, NC — — — — — —
Twin City Commons Batesburg-Leesville, SC 5 47,680 47,680 100.0% 449,194 9.42
Walnut Hill Plaza Petersburg, VA 11 89,907 74,345 82.7% 593,323 7.98
Waterway Plaza Little River, SC 8 49,750 46,150 92.8% 396,983 8.60
Westland Square West Columbia, SC 9 62,735 58,365 93.0% 435,311 7.46
Winslow Plaza Sicklerville, NJ 14 40,695 37,095 91.2% 526,530 14.19
Total 329 2,404,334 2,288,431 95.2%$ 21,538,466 $ 9.41
18
|
|
DEBT / MATURITY PROFILE1
Strong lending relationships with nationally recognized banks; strong capital position expected to significantly improve bargaining power
Recently secured a $45 million revolving credit facility with KeyBank National Association
Weighted average interest rate of 5.00%
Total Outstanding Debt: $147.6 million1
WHLR’s Debt Profile
Outstanding Debt (in millions)
$90 $80 $70 $60 $50 $40 $30 $20 $10 $0
Outstanding Indebtedness Maturing During Periods Ending March 31st
2016 2017 2018 2019 2020 Thereafter
1) As of 3/31/20145
$21.6 $16.4 $2.6 $10.1 $4.5 $83.1
19
|
|
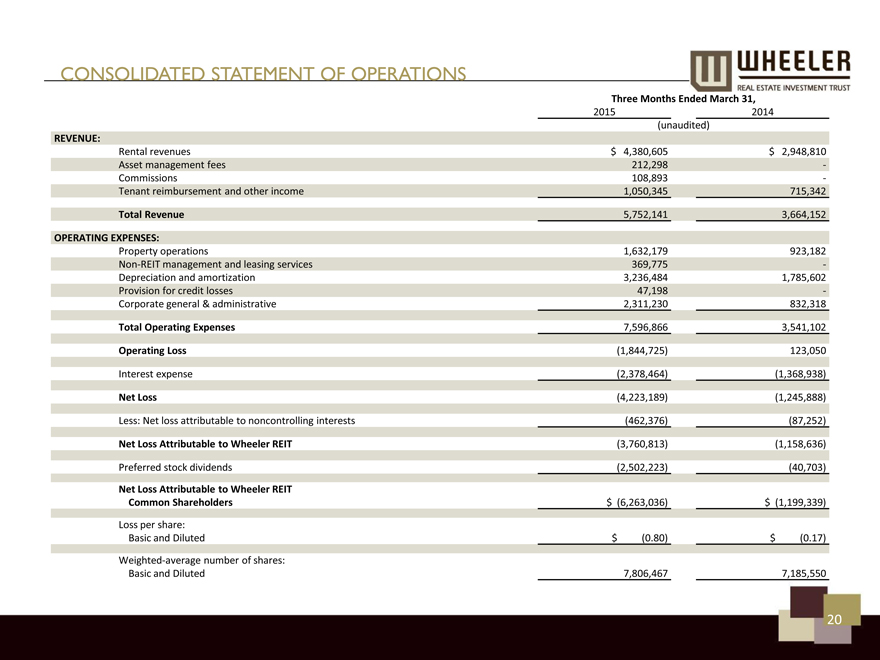
CONSOLIDATED STATEMENT OF OPERATIONS
Three Months Ended March 31,
2015 2014
(unaudited)
REVENUE:
Rental revenues $ 4,380,605 $ 2,948,810
Asset management fees 212,298 -
Commissions 108,893 -
Tenant reimbursement and other income 1,050,345 715,342
Total Revenue 5,752,141 3,664,152
OPERATING EXPENSES:
Property operations 1,632,179 923,182
Non-REIT management and leasing services 369,775 -
Depreciation and amortization 3,236,484 1,785,602
Provision for credit losses 47,198 -
Corporate general & administrative 2,311,230 832,318
Total Operating Expenses 7,596,866 3,541,102
Operating Loss(1,844,725) 123,050
Interest expense(2,378,464)(1,368,938)
Net Loss(4,223,189)(1,245,888)
Less: Net loss attributable to noncontrolling interests(462,376)(87,252)
Net Loss Attributable to Wheeler REIT(3,760,813)(1,158,636)
Preferred stock dividends(2,502,223)(40,703)
Net Loss Attributable to Wheeler REIT
Common Shareholders $ (6,263,036) $ (1,199,339)
Loss per share:
Basic and Diluted $ (0.80) $ (0.17)
Weighted-average number of shares:
Basic and Diluted 7,806,467 7,185,550
20
|
|
BALANCE SHEET SUMMARY
March 31, December 31,
2015 2014
(unaudited)
ASSETS:
Investment properties, net $ 163,265,867 $ 152,250,986
Cash and cash equivalents 80,958,326 9,969,748
Rents and other tenant receivables, net 2,114,898 1,985,466
Goodwill 7,004,072 7,004,072
Deferred costs and other assets, net 34,661,026 29,272,096
Total Assets $ 288,004,189 $ 200,482,368
LIABILITIES:
Loans payable $ 147,634,250 $ 141,450,143
Accounts payable, accrued expenses and other liabilities 7,211,725 5,908,798
Total Liabilities 154,845,975 147,358,941
Commitments and contingencies —
Series C mandatorily convertible cumulative preferred stock (no par value,
100,000 shares authorized, 93,000 and no shares issued and outstanding,
respectively) 87,510,354 -
EQUITY:
Series A preferred stock (no par value, 4,500 shares authorized,
1,809 shares issued and outstanding, respectively) 1,458,050 1,458,050
Series B preferred stock (no par value, 3,000,000 shares authorized,
1,595,900 and 1,648,900 shares issued and outstanding, respectively) 36,608,768 37,620,254
Common stock ($0.01 par value, 75,000,000 shares authorized,
7,841,196 and 7,512,979 shares issued and outstanding,
respectively 78,411 75,129
Additional paid-in capital 32,197,918 31,077,060
Accumulated deficit(34,607,083)(27,660,234)
Total Shareholders’ Equity 35,736,064 42,570,259
Noncontrolling interests 9,911,796 10,553,168
Total Equity 45,647,860 53,123,427
Total Liabilities and Equity $ 288,004,189 $ 200,482,368
21
|
|
FFO and CORE FFO
Three Months Ended March 31,
2015 2014
Total FFO $ (986,705) $ 539,714
Preferred stock dividends(2,502,223)(40,703)
Preferred stock accretion adjustments 1,211,202 —
Total FFO available to common shareholders and common unitholders(2,277,726) 499,011
Acquisition costs 653,242 57,000
Share-based compensation 45,000 —
Loan cost amortization 486,198 86,831
Above (below) market lease amortization 195,729(23,304)
Tenant improvement reserves(59,500) —
Recurring capital expenditures(71,400) —
Total Core FFO $ (1,028,457) $ 619,538
Weighted Average Common Shares 7,806,467 7,185,550
Weighted Average Common Units 3,540,576 2,008,338
Total Common Shares and Units 11,347,043 9,193,888
FFO per Common Share and Common Units $(0.20) $ 0.05
Core FFO per Common Share and Common Units $(0.09) $ 0.07
22
|
|
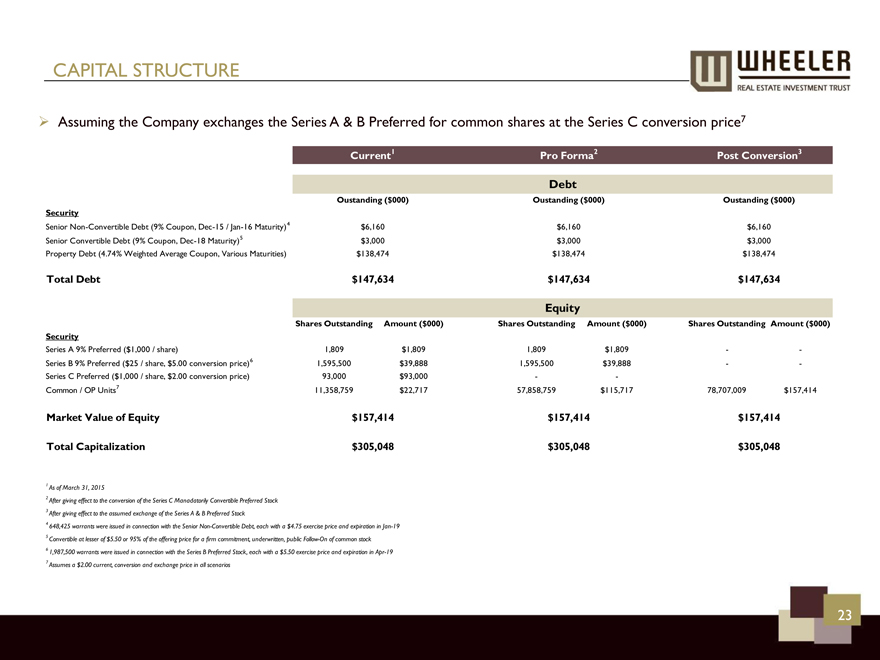
CAPITAL STRUCTURE
Assuming the Company exchanges the Series A & B Preferred for common shares at the Series C conversion price7
Current1 Pro Forma2 Post Conversion3
Debt
Oustanding ($000) Oustanding ($000) Oustanding ($000)
Security
Senior Non-Convertible Debt (9% Coupon, Dec-15 / Jan-16 Maturity)4 $6,160 $6,160 $6,160
Senior Convertible Debt (9% Coupon, Dec-18 Maturity)5 $3,000 $3,000 $3,000
Property Debt (4.74% Weighted Average Coupon, Various Maturities) $138,474 $138,474 $138,474
Total Debt $147,634 $147,634 $147,634
Equity
Shares Outstanding Amount ($000) Shares Outstanding Amount ($000) Shares Outstanding Amount ($000)
Security
Series A 9% Preferred ($1,000 / share) 1,809 $1,809 1,809 $1,809 —
Series B 9% Preferred ($25 / share, $5.00 conversion price)6 1,595,500 $39,888 1,595,500 $39,888 —
Series C Preferred ($1,000 / share, $2.00 conversion price) 93,000 $93,000 —
Common / OP Units7 11,358,759 $22,717 57,858,759 $115,717 78,707,009 $157,414
Market Value of Equity $157,414 $157,414 $157,414
Total Capitalization $305,048 $305,048 $305,048
1 As of March 31, 2015
2 After giving effect to the conversion of the Series C Manadatorily Convertible Preferred Stock
3 After giving effect to the assumed exchange of the Series A & B Preferred Stock
4 648,425 warrants were issued in connection with the Senior Non-Convertible Debt, each with a $4.75 exercise price and expiration in Jan-19
5 Convertible at lesser of $5.50 or 95% of the offering price for a firm commitment, underwritten, public Follow-On of common stock
6 1,987,500 warrants were issued in connection with the Series B Preferred Stock, each with a $5.50 exercise price and expiration in Apr-19
7 Assumes a $2.00 current, conversion and exchange price in all scenarios
23
|
|
NASDAQ: WHLR
For Additional Information
At the Company:
Robin Hanisch Corporate Secretary Robin@whlr.us 757-627-9088
Laura Nguyen Director of Capital Markets Laura@whlr.us 757-627-9088
Terry Downs Associate TDowns@equityny.com 212-836-9615
Adam Prior Senior Vice President APrior@equityny.com 212-836-9606
Investor Relations Counsel:
The Equity Group Inc.
Think Retail. Think Wheeler.®
WHEELER
REAL ESTATE INVESTMENT TRUST