UNITED STATES
SECURITIES AND EXCHANGE COMMISSION
Washington, D.C. 20549
FORM 10-K
| x | ANNUAL REPORT PURSUANT TO SECTION 13 or 15(d) OF THE SECURITIES EXCHANGE ACT OF 1934 |
For the fiscal year ended December 31, 2012
OR
| ¨ | TRANSITION REPORT PURSUANT TO SECTION 13 OR 15(d) OF THE SECURITIES EXCHANGE ACT OF 1934 |
Commission file number 001-35713
WHEELER REAL ESTATE INVESTMENT TRUST, INC.
(Exact Name of Registrant as Specified in Its Charter)
| Maryland | 45-2681082 | |
| (State or Other Jurisdiction of Incorporation or Organization) |
(I.R.S. Employer Identification No.) | |
| 2529 Virginia Beach Blvd., Suite 200 Virginia Beach. Virginia |
23452 | |
| (Address of Principal Executive Offices) | (Zip Code) | |
(757) 627-9088
(Registrant’s Telephone Number, Including Area Code)
Securities registered pursuant to Section 12(b) of the Act:
Common stock, $0.01 par value (NASDAQ Capital Market)
Securities registered pursuant to Section 12(g) of the Act:
None
Indicate by check mark if the registrant is a well-known seasoned issuer, as defined in Rule 405 of the Securities Act. Yes ¨ No x
Indicate by check mark if the registrant is not required to file reports pursuant to Section 13 or Section 15(d) of the Act. Yes ¨ No x
Indicate by check mark whether the registrant (1) has filed all reports required to be filed by Section 13 or 15(d) of the Securities Exchange Act of 1934 during the preceding 12 months (or for such shorter period that the registrant was required to file such reports), and (2) has been subject to such filing requirements for the past 90 days. Yes x No ¨
Indicate by check mark whether the registrant has submitted electronically and posted on its corporate Web site, if any, every Interactive Data File required to be submitted and posted pursuant to Rule 405 of Regulation S-T during the preceding 12 months (or for such shorter period that the registrant was required to submit and post such files). Yes x No ¨
Indicate by check mark if disclosure of delinquent filers pursuant to Item 405 of Regulation S-K is not contained herein, and will not be contained, to the best of registrant’s knowledge, in definitive proxy or information statements incorporated by reference in Part III of this Form 10-K or any amendment to this Form 10-K. x
Indicate by check mark whether the registrant is a large accelerated filer, an accelerated filer, a non-accelerated filer, or a smaller reporting company. See the definitions of “large accelerated filer”, “accelerated filer” and “smaller reporting company” in Rule 12b-2 of the Exchange Act.:
| Large accelerated file | ¨ | Accelerated filer | ¨ | |||
| Non-accelerated filer | ¨ (Do not check if a smaller reporting company) | Smaller reporting company | x | |||
Indicate by check mark whether the registrant is a shell company (as defined in Rule 12b-2 of the Exchange Act). Yes ¨ No x
The registrant was not a publicly-traded company on the last business day of the registrant’s most recent second fiscal quarter. As such, the required calculation of public float cannot be made. The registrant does not have any non-voting common equity.
As of March 27, 2013, there were 3,301,502 shares of common stock, $0.01 par value per share, outstanding.
| 2 | ||||||
| Item 1. |
2 | |||||
| Item 1A. |
8 | |||||
| Item 1B. |
9 | |||||
| Item 2. |
9 | |||||
| Item 3. |
20 | |||||
| Item 4. |
21 | |||||
| 21 | ||||||
| Item 5. |
21 | |||||
| Item 6. |
23 | |||||
| Item 7. |
Management’s Discussion and Analysis of Financial Condition and Results of Operations |
23 | ||||
| Item 7A. |
32 | |||||
| Item 8. |
32 | |||||
| Item 9. |
Changes in and Disagreements with Accountants on Accounting and Financial Disclosure |
32 | ||||
| Item 9A. |
33 | |||||
| Item 9B. |
33 | |||||
| 33 | ||||||
| Item 10. |
33 | |||||
| Item 11. |
39 | |||||
| Item 12. |
Security Ownership of Certain Beneficial Owners and Management and Related Shareholder Matters |
42 | ||||
| Item 13. |
Certain Relationships and Related Transactions, and Director Independence |
43 | ||||
| Item 14. |
44 | |||||
| Item 15. |
44 | |||||
FORWARD-LOOKING STATEMENTS
This Annual Report on Form 10-K of Wheeler Real Estate Investment Trust, Inc. contains forward-looking statements, including discussion and analysis of our financial condition, anticipated capital expenditures required to complete projects, amounts of anticipated cash distributions to our shareholders in the future and other matters. These forward-looking statements are not historical facts but are the intent, belief or current expectations of our management based on its knowledge and understanding of our business and industry. Forward-looking statements are typically identified by the use of terms such as “may,” “will,” “should,” “potential,” “predicts,” “anticipates,” “expects,” “intends,” “plans,” “believes,” “seeks,” “estimates,” or the negative of such terms and variations of these words and similar expressions. These statements are not guarantees of future performance and are subject to risks, uncertainties and other factors, some of which are beyond our control, are difficult to predict and could cause actual results to differ materially from those expressed or forecasted in the forward-looking statements.
Forward-looking statements that were true at the time made may ultimately prove to be incorrect or false. You are cautioned to not place undue reliance on forward-looking statements, which reflect our management’s view only as of the date of this Annual Report on Form 10-K. We undertake no obligation to update or revise forward-looking statements to reflect changed assumptions, the occurrence of unanticipated events or changes to future operating results. Factors that could cause actual results to differ materially from any forward-looking statements made in this Annual Report on Form 10-K include:
| • | the imposition of federal taxes if we fail to qualify as a real estate investment trust (“REIT”) in any taxable year or forego an opportunity to ensure REIT status; |
| • | uncertainties related to the national economy, the real estate industry in general and in our specific markets; |
| • | legislative or regulatory changes, including changes to laws governing REITs; |
| • | adverse economic or real estate developments in Virginia, Florida, Georgia, South Carolina, North Carolina or Oklahoma; |
| • | increases in interest rates and operating costs; |
| • | inability to obtain necessary outside financing; |
| • | litigation risks; |
| • | lease-up risks; |
| • | inability to obtain new tenants upon the expiration of existing leases; |
| • | inability to generate sufficient cash flows due to market conditions, competition, uninsured losses, changes in tax or other applicable laws; and |
| • | the need to fund tenant improvements or other capital expenditures out of operating cash flow. |
These forward-looking statements should be read in light of these factors.
| Item 1. | Business |
INDUSTRY BACKGROUND AND MARKET OPPORTUNITY
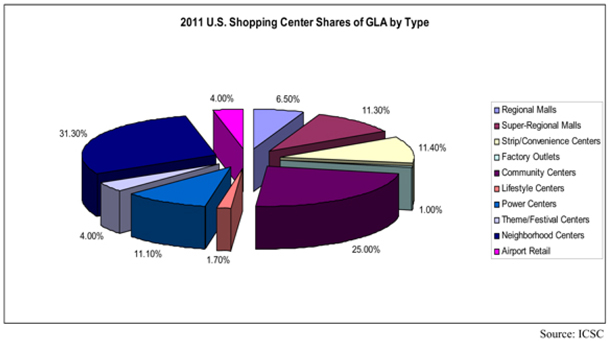
The retail shopping center industry is one of the largest industries in the United States. The retail shopping center industry had annual revenue of approximately $2.29 trillion in 2010, a year over year percentage increase of 3.5% from 2009, according to the International Council of Shopping Centers (the “ICSC”). In order to support such strong demand, the shopping center space market has grown to 7.3 billion square feet of gross leasable area (“GLA”) in 2011 from 2.1 billion square feet in 1970, and there are currently over 107,823 shopping centers in the United States according to the latest data provided by the ICSC and CoStar Realty.
The ICSC has defined ten principal shopping center types that include: (1) neighborhood; (2) community; (3) regional; (4) superregional; (5) lifestyle; (6) power; (7) theme/festival; (8) outlets; (9) airport retail; and (10) convenience/strip centers. According to ICSC, the centers are distinguished primarily by their merchandise orientation (i.e., the type of goods and services sold) and the size of the center. Other characteristics include the number and type of anchor tenants and the anchor ratio (i.e., the share of a center’s total square footage that is attributable to its anchors) and the primary trade area (i.e., the area from which 60% to 80% of the center’s sales originate). Regional and superregional centers, or enclosed malls, comprise approximately 17% of the total shopping center market, while the eight other types of centers make up the remaining 83% on a square footage basis.
We focus on owning and managing income producing assets such as strip centers, neighborhood centers, grocery-anchored centers, community centers and free-standing retail properties. We believe that these property types are the most stable assets within the retail sector. Consumer spending on goods offered by such retailers does not experience significant fluctuations. As of July 2011, convenience/strip centers, neighborhood and community shopping centers made up approximately 11.4%, 31.3% and 25.0% of the open-air shopping center space market based on a square footage basis.
2
Our Markets
We primarily target markets in the Mid-Atlantic, Southeast and Southwest that exhibit attractive economic fundamentals and have favorable long-term supply-demand characteristics. Specifically, five of our eleven properties in our portfolio are currently located in Virginia, one is located in North Carolina, one is located in Florida, one is located in Georgia, one is located in South Carolina and two are located in Oklahoma.
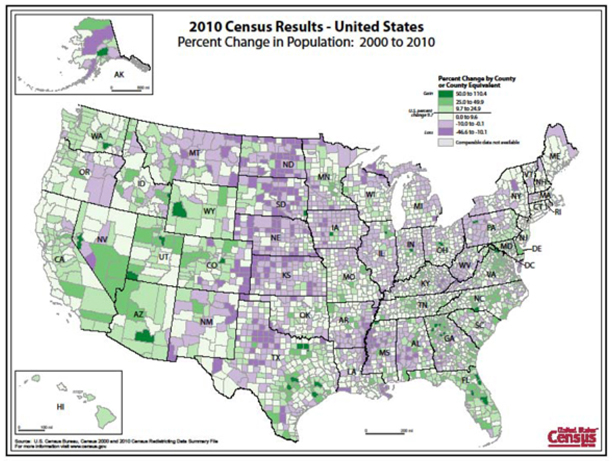
As shown in the 2010 U.S. Census population change map below, the center of gravity of the U.S. population continues to shift toward the southwest and southeast, continuing a decade long shift of the U.S. population toward these areas. The Southwest and Southeast comprise two of our markets and we believe that our network of relationships in the retail industry in these geographic areas position us to take advantage of the on-going population shift toward the Southwest and Southeast.
Market Opportunity
Shopping center GLA grew by only 0.25% in 2010 and growth in 2011 continues to be sluggish to date as well. The slow growth in U.S. shopping-center space reflects lagging adjustments resulting from the severe business cycle downturn between 2007 and 2009. However, one effect of such slowed growth has been to bolster the shopping center industry’s fundamentals relative to other property classes. For instance, the shopping center vacancy rate in the first quarter of 2011 was 10.9%, considerably lower than that of 15.2% for office properties. We believe that the retail and shopping center industries are poised for a period of growth as the U.S. economy recovers from a period of global economic decline. Additionally, we believe that our company is positioned to take advantage of this coming period of growth.
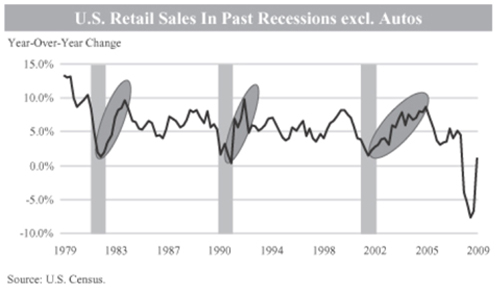
Retail property values appear to be at their cyclical lows and we believe the ensuing rebound may be similar to those of past economic downturns, which are illustrated in the chart below. Retail sales recorded average year-over-year growth rates of 6.4%, 6.4% and 5.1% during the three years following the recessions of 1982, 1990 and 2001, respectively; however, there is no guarantee that comparable growth rates will occur in the future. We
3
believe that the recent lack of construction combined with the anticipated economic recovery will yield an environment of increasing rents and therefore increasing operating cash flows and property values. The chart below shows retail sales growth following recent recessions.
Over the longer-term, we believe population growth will continue to support commercial real estate, including retail properties. According to the U.S. Census, annual population growth will remain near historical averages at approximately 1%. Moreover, the number of 25- to 44-year-old consumers, one of the primary drivers of household formation, is expected to grow from 83 million in 2010 to approximately 90 million by 2020. We believe that new household formation is a primary demand driver for consumer goods that are sold at our target assets.
Our management team has had success in identifying and capitalizing on opportunities that arise during times of economic weakness and the expansion periods that follow. Accordingly, we believe that in the short to intermediate term we will be able to capitalize on opportunities to purchase properties that meet our investment criteria. We will seek properties in potentially dominant locations in secondary and tertiary markets whose vacancies stem from recent retail dislocations or mismanagement rather than weak property fundamentals.
BUSINESS AND PROPERTIES
Overview
We are a Maryland corporation formed with the principal objective of acquiring, financing, developing, leasing, owning and managing income producing assets such as strip centers, neighborhood centers, grocery-anchored centers, community centers and free-standing retail properties. Our strategy is to opportunistically acquire and reinvigorate well-located, potentially dominant retail properties in secondary and tertiary markets that generate attractive risk-adjusted returns. We target competitively protected properties in communities that have stable demographics and have historically exhibited favorable trends, such as strong population and income growth. We generally lease our properties to national and regional retailers that offer consumer goods and generate regular consumer traffic. We believe our tenants carry goods that are less impacted by fluctuations in the broader U.S. economy and consumers’ disposable income, generating more predictable property-level cash flows.
We currently own a portfolio consisting of seven retail shopping centers, three free-standing retail properties, and one office property, totaling 470,350 net rentable square feet of which were approximately 94.3% leased as of December 31, 2012.
We believe the current market environment creates a substantial number of favorable investment opportunities with attractive yields on investment and significant upside potential. We believe the markets we plan to pursue of the Mid-Atlantic, Southeast and Southwest are characterized by strong demographics and dynamic, diversified economies that will continue to generate jobs and future demand for commercial real estate. We
4
anticipate that the depth and breadth of our real estate experience allows us to capitalize on revenue-enhancing opportunities in our portfolio and source and execute new acquisition and development opportunities in our markets, while maintaining stable cash flows throughout various business and economic cycles.
Jon S. Wheeler, our Chairman and President, has 30 years of experience in the real estate sector with particular experience in strategic financial and market analyses and assessments of new or existing properties to maximize returns. We have an integrated team of professionals with experience across all stages of the real estate investment cycle.
We were organized as a Maryland corporation on June 23, 2011 and intend to elect to be taxed as a REIT beginning with our taxable year ending December 31, 2012. We conduct substantially all of our business through Wheeler Real Estate Investment Trust, L.P., a Virginia limited partnership, of which we are the sole general partner (our “Operating Partnership”). We are structured as an UPREIT, which means that we will own most of our properties through our Operating Partnership and its subsidiaries. As an UPREIT, we may be able to acquire properties on more attractive terms from sellers who can defer tax obligations by contributing properties to our Operating Partnership in exchange for Operating Partnership units, which will be redeemable for cash or exchangeable for shares of our common stock at our election.
WHLR Management, LLC (our “Administrative Service Company”), which is wholly owned by Mr. Wheeler, provides administrative services to our company. Pursuant to the terms of an administrative services agreement between our Administrative Service Company and us, our Administrative Service Company is responsible for identifying targeted real estate investments; handling the disposition of the real estate investments our board of directors has chosen to sell; and administering our day-to-day business operations, including but not limited to, leasing duties, property management, payroll and accounting functions. We also benefit from Mr. Wheeler’s partially or wholly owned related business and platform that specializes in retail real estate investment and management. Mr. Wheeler’s organization includes (i) Wheeler Interests, LLC, an acquisition and asset management firm, (ii) Wheeler Real Estate, LLC, a real estate leasing management and administration firm, (iii) Wheeler Development, LLC, a full service real estate development firm, (iv) Wheeler Capital, LLC, a capital investment firm specializing in venture capital, financing, and small business loans, (v) Site Applications, LLC, a full service facility company equipped to handle all levels of building maintenance and (vi) TESR, LLC, a tenant coordination company specializing in tenant relations and community events (collectively, our “Services Companies”). Our headquarters is located at Riversedge North, 2529 Virginia Beach Boulevard, Suite 200, Virginia Beach, Virginia 23452. Our telephone number is (757) 627-9088. Our website is located at WHLR.us. Our Internet website and the information contained therein or connected thereto does not constitute a part of this Form 10-K or any amendment or supplement hereto.
Our Competitive Strengths
We believe the following competitive strengths distinguish us from other owners and operators of commercial real estate and will enable us to take advantage of new acquisition and development opportunities, as well as growth opportunities within our portfolio:
| • | Cornerstone Portfolio of Retail Properties. We believe we have acquired and developed a portfolio of properties located in business centers in Virginia, Florida, Georgia, South Carolina, North Carolina, and Oklahoma. We believe many of our properties currently achieve rental and occupancy rates equal to or above those typically prevailing in their respective markets due to their desirable and competitively advantageous locations within their submarkets, as well as our hands-on management approach. The retail properties comprising our portfolio fit within our property acquisition profile of income producing assets such as strip centers, neighborhood centers, grocery-anchored centers, community centers and free-standing retail properties. These properties are located in local markets that exhibit stable demographics and have historically exhibited favorable trends, such as strong population and income growth. These properties represent the initial base of the larger portfolio that we expect to build over time. |
| • | Experienced Management Team. Our executive officers and the members of the management teams of our Services Companies have significant experience in all aspects of the commercial real estate industry, specifically in our markets. They have overseen the acquisition or development and operation of more than 60 shopping centers, representing over 4 million rentable square feet of |
5
| retail property, including all of the properties in our portfolio. Mr. Wheeler and the real estate professionals employed by our Services Companies have in-depth knowledge of our assets, markets and future growth opportunities, as well as substantial expertise in all aspects of leasing, asset and property management, marketing, acquisitions, redevelopment and facility engineering and financing, all of which we believe provides us with a significant competitive advantage. |
| • | Access to a Pipeline of Acquisition and Leasing Opportunities. We believe that market knowledge and network of relationships with real estate owners, developers, brokers, national and regional lenders and other market participants provides us access to an ongoing pipeline of attractive acquisition and investment opportunities in and near our markets. In addition, we have a network of relationships with numerous national and regional tenants in our markets, many of whom currently are tenants in our retail buildings, which we expect will enhance our ability to retain and attract high quality tenants, facilitate our leasing efforts and provide us with opportunities to increase occupancy rates at our properties, thereby allowing us to maximize cash flows from our properties. We have successfully converted many of our strong relationships with our retail tenants into leasing opportunities at our properties. |
| • | Broad Real Estate Expertise with Retail Focus. Our management team has experience and capabilities across the real estate sector with experience and expertise particularly in the retail asset class, which we believe provides for flexibility in pursuing attractive acquisition, development, and repositioning opportunities. Since varying market conditions create opportunities at different times across property types, we believe our expertise enables us to target relatively more attractive investment opportunities throughout economic cycles. In addition, our fully integrated platform with in-house development capabilities allows us to pursue development and redevelopment projects with multiple uses. We believe that our ability to pursue these types of opportunities differentiates us from many competitors in our markets. |
Business and Growth Strategies
Our strategy is to opportunistically acquire and reinvigorate well-located, potentially dominant retail properties in secondary and tertiary markets that generate attractive risk-adjusted returns. Specifically, we intend to pursue the following strategies to achieve these objectives:
| • | Maximize value through proactive asset management. We believe our market expertise, targeted leasing strategies and proactive approach to asset management will enable us to maximize the operating performance of our portfolio. We will continue to implement an active asset management program to increase the long-term value of each of our properties. This may include expanding existing tenants, re-entitling site plans to allow for additional outparcels, which are small tracts of land used for freestanding development not attached to the main buildings, and repositioning tenant mixes to maximize traffic, tenant sales and percentage rents. As we grow our portfolio, we will seek to maintain a diverse pool of assets with respect to both geographic distribution and tenant mix, helping to minimize our portfolio risk. We will utilize our experience and market knowledge to effectively allocate capital to implement our investment strategy. We continually monitor our markets for opportunities to selectively dispose of properties where returns appear to have been maximized and redeploy proceeds into new acquisitions that have greater return prospects. |
| • | Pursue value oriented investment strategy targeting properties fitting within our acquisition profile. We believe the types of retail properties we seek to acquire will provide better risk-adjusted returns compared to other properties in the retail asset class, as well as other property types in general, due to the anticipated improvement in consumer spending habits resulting from a strengthening economy coupled with the long-term nature of the underlying leases and predictability of cash flows. We will acquire retail properties based on identified market and property characteristics, including: |
| • | Property type. We focus our investment strategy on income producing assets such as strip centers, neighborhood centers, grocery-anchored centers, community centers and free-standing retail properties. We will target these types of properties because they tend to be more focused on consumer goods as opposed to enclosed malls, which we believe are more oriented to discretionary spending that is susceptible to cyclical fluctuations. |
| • | Strip center. A strip center is an attached row of stores or service outlets managed as a coherent retail entity, with on-site parking usually located in front of the stores. Open canopies may connect the store fronts, but a strip center does not have enclosed walkways linking the stores. A strip center may be configured in a straight line or have an “L” or “U” shape. |
6
| • | Neighborhood centers. A neighborhood center is designed to provide convenience shopping for the day-to-day needs of consumers in the immediate neighborhood. Neighborhood centers are often anchored by a supermarket or drugstore. The anchors are supported by outparcels typically occupied by restaurants, fast food operators, financial institutions and in-line stores offering various products and services ranging from soft goods, healthcare and electronics. |
| • | Community centers. A community center typically offers a wider range of apparel and other soft goods relative to a neighborhood center and in addition to supermarkets and drugstores, can include discount department stores as anchor tenants. |
| • | Freestanding retail properties. A freestanding retail property constitutes any retail building that is typically occupied by a single tenant. The lease terms are generally structured as triple-net with the tenant agreeing to pay rent as well as all taxes, insurance and maintenance expenses that arise from the use of the property. |
| • | Anchor tenant type. We will target properties with anchor tenants that offer consumer goods that are less impacted by fluctuations in consumers’ disposable income. We believe nationally and regionally recognized anchor tenants that offer consumer goods provide more predictable property-level cash flows as they are typically higher credit quality tenants that generate stable revenues. We feel these properties will act as a catalyst for incremental leasing demand through increased property foot traffic. We will identify the credit quality of our anchor tenants by conducting a thorough analysis including, but not limited to, a review of tenant operating performance, liquidity and balance sheet strength. |
| • | Lease terms. In the near term, we intend to acquire properties that feature one or more of the following characteristics in their tenants’ lease structure: properties with long-term leases (10 years remaining on the primary lease term) for anchor tenants; properties under triple-net leases, which are leases where the tenant agrees to pay rent as well as all taxes, insurance and maintenance expenses that arise from the use of the property; thereby minimizing our expenses; and properties with leases which incorporate gross percentage rent and/or rental escalations that act as an inflation hedge while maximizing operating cash flows. As a longer-term strategy, we will look to acquire properties with shorter-term lease structures (2-3 years) for in-line tenants, which are tenants that rent smaller spaces around the anchor tenants within a property, that have below market rents that can be renewed at higher market rates. |
| • | Geographic markets and demographics. We plan to seek investment opportunities throughout the United States; however, we will focus on the Mid-Atlantic, Southeast and |
7
| Southwest, which are characterized by attractive demographic and property fundamental trends. We will target competitively protected properties in communities that have stable demographics and have historically exhibited favorable trends, such as strong population and income growth. These communities will also have a combination of the following characteristics: |
| • | established trade areas with high barriers to entry, |
| • | high population base with expected annual growth rate higher than the national average, |
| • | high retail sales per square foot compared to the national average, |
| • | above average household income and expected growth, |
| • | above-average household density, |
| • | favorable infrastructure such as schools to retain and attract residents, and |
| • | below-average unemployment rate. |
| • | Capitalize on network of relationships to pursue transactions. We plan to pursue transactions in our target markets through the relationships we have developed. Leveraging these relationships, we will target property owners that our management team has transacted with previously, many of whom, we feel, will consider us a preferred counterparty due to our track record of completing fair and timely transactions. We believe this dynamic gives us a competitive advantage in negotiating and executing favorable acquisitions. |
| • | Leverage our experienced property management platform. Our executive officers, together with the management teams of our Services Companies, have over 150 years of combined experience managing, operating and leasing retail properties. We consider our Services Companies to be in the best position to oversee the day-to-day operations of our properties, which in turn helps us service our tenants. We feel this generates higher renewal and occupancy rates, minimizes rent interruptions, reduces renewal costs and helps us achieve stronger operating results. Along with this, a major component of our leasing strategy is to cultivate long-term relationships through consistent tenant dialogue in conjunction with a proactive approach to meeting the space requirements of our tenants. |
| • | Grow our platform through a comprehensive financing strategy. We believe our capital structure will provide us with sufficient financial capacity and flexibility to fund future growth. Based on our current capitalization, we believe we will have access to multiple sources of financing that are currently unavailable to many of our private market peers or overleveraged public competitors, which will provide us with a competitive advantage. Over time, these financing alternatives may include follow-on offerings of our common stock, unsecured corporate level debt, preferred equity and credit facilities. We have a ratio of debt to total market capitalization of approximately 51%. Although we are not required by our governing documents to maintain this ratio at any particular level, our Board of Directors will review our ratio of debt to total capital on a quarterly basis, with the goal of maintaining a reasonable rate consistent with our expected ratio of debt to total market capitalization going forward. This strategy will enable us to continue to grow our asset base well into the future. |
| Item 1A. | Risk Factors. |
Not applicable.
8
| Item 1B. | Unresolved Staff Comments. |
Not applicable.
| Item 2. | Properties. |
Our Portfolio
We currently own eleven properties located in Virginia, North Carolina, South Carolina, Florida, Georgia and Oklahoma, containing a total of approximately 470,350 million rentable square feet of retail space, which we refer to as our portfolio. The following table presents an overview of our portfolio, based on information as of December 31, 2012.
Portfolio
| Property |
Location | Year Built/ Renovated |
Number of Tenants |
Net Rentable Square Feet |
Percentage Leased |
Annualized Base Rent |
Annualized Base Rent per Leased Square Foot (1) |
|||||||||||||||||
| The Shoppes at TJ Maxx |
Richmond, VA | 1982/1999 | 14 | 93,552 | 90.6 | % | $ | 950,040 | $ | 11.21 | ||||||||||||||
| Walnut Hill Plaza |
Petersburg, VA | 1959/2006/2008 | 11 | 89,907 | 82.7 | % | 550,247 | 7.40 | ||||||||||||||||
| Lumber River Plaza |
Lumberton, NC | 1985/1997-98 (expansion)/ 2004 |
12 | 66,781 | 100.0 | % | 514,810 | 7.71 | ||||||||||||||||
| Perimeter Square |
Tulsa, OK | 1982-83 | 8 | 58,277 | 95.7 | % | 691,977 | 12.41 | ||||||||||||||||
| The Shoppes at Eagle Harbor |
Carrollton, VA | 2009 | 7 | 23,303 | 100.0 | % | 472,561 | 20.28 | ||||||||||||||||
| Harps At Harbor Point |
Grove, OK | 2012 | 1 | 31,500 | 100.0 | % | 364,432 | 11.57 | ||||||||||||||||
| Twin City Crossing |
Batesburg- Leesville, SC |
1998/2002 | 5 | 47.680 | 100.0 | % | 446,590 | 9.37 | ||||||||||||||||
| Surrey Plaza |
Hawkinsville, GA | 1993 | 5 | 42,680 | 100.0 | % | 302,595 | 7.09 | ||||||||||||||||
| Riversedge North |
Virginia Beach, VA |
2007 | 1 | 10,550 | 100.0 | % | 302,539 | 28.68 | ||||||||||||||||
| Monarch Bank |
Virginia Beach, VA |
2002 | 1 | 3,620 | 100.0 | % | 250,740 | 69.27 | ||||||||||||||||
| Amscot Building |
Tampa, FL | 2004 | 1 | 2,500 | 100.0 | % | 101,395 | 40.56 | ||||||||||||||||
|
|
|
|
|
|
|
|
|
|
|
|||||||||||||||
| Total Portfolio |
66 | 470,350 | 94.3 | % | $ | 4,947,926 | $ | 11.16 | ||||||||||||||||
|
|
|
|
|
|
|
|
|
|
|
|||||||||||||||
| (1) | Annualized base rent per leased square foot includes the impact of tenant concessions. |
Description of Our Properties
The following properties comprise our current portfolio of eleven properties:
Shoppes at TJ Maxx
The Shoppes at TJ Maxx is a 93,552 square foot community shopping center built in 1982 and renovated in 1999, and anchored by TJ Maxx. The property is located in Richmond, Virginia on the West Broad Street shopping corridor and is occupied by 14 primarily retail and restaurant tenants.
9
TJ Maxx
| • | TJ Maxx leases 32,400 square feet of net rentable square feet, representing 34.63% of the net rentable square feet of the Shoppes at TJ Maxx. |
| • | Annual rent under the TJ Maxx lease is $294,192. |
| • | The TJ Maxx lease expires on April 30, 2019 and has one renewal option for five years. |
Cannon’s Online Auctions
| • | Cannon’s Online Auctions leases 14, 000 square feet of net rentable square feet, representing 14.96% of the net rentable square feet of the Shoppes at TJ Maxx. |
| • | Annual rent under the Cannon’s Online Auctions lease is $84,000. |
| • | The Cannon’s Online Auctions lease expires on September 30, 2015 and is not currently subject to any renewal options. |
The following table sets forth the percentage leased and annualized rent per leased square foot for Shoppes at TJ Maxx as of the indicated dates:
| Date |
Percent Leased | Annualized Rent Per Leased Square Foot(1) |
||||||
| December 31, 2012 |
90.60 | % | $ | 11.21 | ||||
| December 31, 2011 |
81.20 | 12.24 | ||||||
| December 31, 2010 |
79.82 | 11.77 | ||||||
| December 31, 2009 |
88.35 | 10.85 | ||||||
| December 31, 2008 |
98.15 | 10.22 | ||||||
| (1) | Annualized rent per leased square foot is calculated by dividing (i) annualized base rent, by (ii) square footage leased. |
The following table sets forth the lease expirations for leases in place at Shoppes at TJ Maxx as of December 31, 2012, assuming that tenants do not exercise any renewal options or early termination options:
| Lease Expiration Year |
Number of Expiring Leases |
Square Footage of Expiring Leases |
Percentage of Property Leased Square Feet |
Annualized Base Rent (in 000s)(1) |
Percentage of Property Annualized Base Rent |
|||||||||||||||
| Available |
— | 8,815 | 9.42 | % | $ | — | — | % | ||||||||||||
| 2013 |
2 | 3,212 | 3.43 | 52 | 5.47 | |||||||||||||||
| 2014 |
2 | 3,612 | 3.86 | 61 | 6.44 | |||||||||||||||
| 2015 |
3 | 23,159 | 24.76 | 215 | 22.66 | |||||||||||||||
| 2016 |
3 | 6,993 | 7.47 | 126 | 13.29 | |||||||||||||||
| 2017 |
1 | 1,833 | 1.96 | 31 | 3.28 | |||||||||||||||
| 2018 |
1 | 6,325 | 6.76 | 86 | 8.99 | |||||||||||||||
| 2019 |
2 | 39,603 | 42.34 | 379 | 39.87 | |||||||||||||||
| 2020 |
— | — | — | — | — | |||||||||||||||
| 2021 |
— | — | — | — | — | |||||||||||||||
| 2022 and thereafter |
— | — | — | — | — | |||||||||||||||
|
|
|
|
|
|
|
|
|
|
|
|||||||||||
| Total |
14 | 93,552 | 100.0 | % | $ | 950 | 100.0 | % | ||||||||||||
|
|
|
|
|
|
|
|
|
|
|
|||||||||||
| (1) | Annualized rent is calculated by multiplying (i) base rental payments for the month ended December 31, 2012 for the leases expiring during the applicable period, by (ii) 12. |
Walnut Hill Plaza
Walnut Hill Plaza is an 89,907 square foot neighborhood shopping center built in 1959 and most recently renovated in 2008 by Wheeler Development. The property is located in Petersburg, Virginia. The property is occupied by 11 tenants and features a variety of retailers including Maxway, Save-A-Lot, Rent-A-Center and Family Dollar.
10
The following tenants lease more than 10% of the net rentable square feet of Walnut Hill Plaza:
Variety Wholesalers
| • | Variety Wholesalers leases 15,000 square feet of net rentable square feet, representing 16.68% of the net rentable square feet of Walnut Hill Plaza. Variety Wholesalers operates a Maxway department store at this location. |
| • | Annual rent under the Variety Wholesalers lease is $72,300. |
| • | The Variety Wholesalers lease expires on February 28, 2018 and is not currently subject to any renewal options. |
Moran Foods, Inc.
| • | Moran Foods leases 14,812 square feet of net rentable square feet, representing 16.48% of the net rentable square feet of Walnut Hill Plaza. Moran Foods operates a Save-A-Lot grocery store at this location. |
| • | Annual rent under the Moran Foods lease is $97,759. |
| • | The Moran Foods lease expires on February 29, 2016 and has two renewal options remaining, for five years each. |
Beauty World
| • | Beauty World leases 11,780 net rentable square feet, representing 13.10% of the net rentable square feet of Walnut Hill Plaza. |
| • | Annual Rent under the Beauty World lease is $111,321. |
| • | The Beauty World lease expires on March 31, 2018 and has one renewal option for an additional five year period. |
Citi Trends
| • | Citi Trends clothing retailer leases 9,875 net rentable square feet, representing 10.98% of the net rentable square feet of Walnut Hill Plaza. |
| • | Annual rent under the Citi Trends lease is $45,425. |
| • | The Citi Trends lease is in the midst of its first and only renewal option period and the lease is currently set to expire on July 30, 2013. |
The following table sets forth the percentage leased and annualized rent per leased square foot for Walnut Hill Plaza as of the indicated dates:
| Date |
Percent Leased | Annualized Rent Per Leased Square Foot(1) |
||||||
| December 31, 2012 |
82.69 | % | $ | 7.40 | ||||
| December 31, 2011 |
82.69 | 7.31 | ||||||
| December 31, 2010 |
82.69 | 6.31 | ||||||
| December 31, 2009 |
81.86 | 6.23 | ||||||
| December 31, 2008 |
77.04 | 5.86 | ||||||
| (1) | Annualized rent per leased square foot is calculated by dividing (i) annualized base rent, by (ii) square footage leased. |
11
The following table sets forth the lease expirations for leases in place at Walnut Hill Plaza as of June 30, 2012, assuming that tenants do not exercise any renewal options or early termination options:
| Lease Expiration Year |
Number of Expiring Leases |
Square Footage of Expiring Leases |
Percentage of Property Leased Square Feet |
Annualized Base Rent (in 000s)(1) |
Percentage of Property Annualized Base Rent |
|||||||||||||||
| Available |
— | 15,562 | 17.31 | % | $ | — | — | % | ||||||||||||
| 2013 |
3 | 11,995 | 13.34 | 78 | 14.25 | |||||||||||||||
| 2014 |
3 | 9,758 | 10.85 | 89 | 16.18 | |||||||||||||||
| 2015 |
— | — | — | — | — | |||||||||||||||
| 2016 |
2 | 23,412 | 26.04 | 165 | 29.93 | |||||||||||||||
| 2017 |
— | — | — | — | — | |||||||||||||||
| 2018 |
2 | 26,780 | 29.79 | 184 | 33.38 | |||||||||||||||
| 2019 |
1 | 2,400 | 2.67 | 34 | 6.26 | |||||||||||||||
| 2020 |
— | — | — | — | — | |||||||||||||||
| 2021 |
— | — | — | — | — | |||||||||||||||
| 2022 and thereafter |
— | — | — | — | — | |||||||||||||||
|
|
|
|
|
|
|
|
|
|
|
|||||||||||
| Total |
11 | 89,907 | 100.0 | % | $ | 550 | 100.0 | % | ||||||||||||
|
|
|
|
|
|
|
|
|
|
|
|||||||||||
| (1) | Annualized rent is calculated by multiplying (i) base rental payments for the month ended December 31, 2012 for the leases expiring during the applicable period, by (ii) 12. |
Lumber River Plaza
Lumber River Plaza is a 66,781 square foot neighborhood shopping center built in 1985, expanded in 1997-98 and renovated in 2004. The property is located in Lumberton, North Carolina and is currently occupied by 12 tenants, including Food Lion, Family Dollar, Rent-A-Center and CVS.
The following tenants lease more than 10% of the net rentable square feet of Lumber River Plaza:
Food Lion
| • | Food Lion leases 30,280 net rentable square feet, representing 45.34% of the net rentable square feet of Lumber River Plaza. The Food Lion space recently underwent an interior and exterior renovation. |
| • | Annual rent under the Food Lion lease is $155,250. |
| • | The Food Lion lease expires on June 30, 2018 and has four renewal options for five years each. |
CVS
| • | CVS leases 9,100 net rentable square feet, representing 13.63% of the net rentable square feet of Lumber River Plaza. |
| • | Annual rent under the CVS lease is $63,700. |
| • | The CVS lease expires on September 30, 2015 and has one renewal option for an additional five year period. |
Family Dollar
| • | Family Dollar leases 8,001 net rentable square feet, representing 11.98% of the net rentable square feet of Lumber River Plaza. |
| • | Annual rent under the Family Dollar lease is $46,746. |
| • | The Family Dollar lease expires on December 31, 2017 and has one renewal option for five years. |
12
The following table sets forth the percentage leased and annualized rent per leased square foot for Lumber River Plaza as of the indicated dates:
| Date |
Percent Leased | Annualized Rent Per Leased Square Foot(1) |
||||||
| December 31, 2012 |
100.00 | % | $ | 7.71 | ||||
| December 31, 2011 |
100.00 | 7.80 | ||||||
| December 31, 2010 |
100.00 | 7.48 | ||||||
| December 31, 2009 |
100.00 | 7.39 | ||||||
| December 31, 2008 |
100.00 | 7.24 | ||||||
| (1) | Annualized rent per leased square foot is calculated by dividing (i) annualized base rent, by (ii) square footage leased. |
The following table sets forth the lease expirations for leases in place at Lumber River Plaza as of December 31, 2012, assuming that tenants do not exercise any renewal options or early termination options:
| Lease Expiration Year |
Number of Expiring Leases |
Square Footage of Expiring Leases |
Percentage of Property Leased Square Feet |
Annualized Base Rent (in 000s) (1) |
Percentage of Property Annualized Base Rent |
|||||||||||||||
| Available |
— | — | — | % | $ | — | — | % | ||||||||||||
| 2013 |
2 | 8,600 | 12.88 | 104 | 20.23 | |||||||||||||||
| 2014 |
3 | 2,400 | 3.59 | 40 | 7.81 | |||||||||||||||
| 2015 |
1 | 9,100 | 13.63 | 64 | 12.37 | |||||||||||||||
| 2016 |
2 | 5,400 | 8.09 | 63 | 12.21 | |||||||||||||||
| 2017 |
2 | 9,201 | 13.78 | 64 | 12.46 | |||||||||||||||
| 2018 |
2 | 32,080 | 48.03 | 180 | 34.92 | |||||||||||||||
| 2019 |
— | — | — | — | — | |||||||||||||||
| 2020 |
— | — | — | — | — | |||||||||||||||
| 2021 |
— | — | — | — | — | |||||||||||||||
| 2022 and thereafter |
— | — | — | — | — | |||||||||||||||
|
|
|
|
|
|
|
|
|
|
|
|||||||||||
| Total |
12 | 66,781 | 100.0 | % | $ | 515 | 100.0 | % | ||||||||||||
|
|
|
|
|
|
|
|
|
|
|
|||||||||||
| (1) | Annualized rent is calculated by multiplying (i) base rental payments for the month ended December 31, 2012 for the leases expiring during the applicable period, by (ii) 12. |
Perimeter Square
Perimeter Square is a 58,227 square foot neighborhood shopping center built in 1982-83. The property is located in Tulsa, Oklahoma. The property is occupied by nine tenants, providing a variety of services, and is shadow-anchored by a Wal-Mart Village Market grocery store, which recently underwent an interior and exterior renovation.
The following tenants lease more than 10% of the GLA of Perimeter Square:
Career Point Business School
| • | Career Point Business School leases 26,813 net rentable square feet, representing 46.01% of the net rentable square feet of Perimeter Square. |
| • | Annual Rent under the Career Point Business School lease is $339,162. |
| • | The Career Point Business School lease expires on June 30, 2018 and is not currently subject to any renewal options. |
Dollar Tree
| • | Dollar Tree leases 10,754 net rentable square feet, representing 18.45% of the net rentable square feet of Perimeter Square. |
13
| • | Annual rent under the Dollar Tree lease is $95,173. |
| • | The Dollar Tree lease expires on July 31, 2015 and is not currently subject to any renewal options. |
The following table sets forth the percentage leased and annualized rent per leased square foot for Perimeter Square as of the indicated dates:
| Date |
Percent Leased | Annualized Rent Per Leased Square Foot(1) |
||||||
| December 31, 2012 |
95.70 | % | $ | 12.41 | ||||
| December 31, 2011 |
100.00 | 11.76 | ||||||
| December 31, 2010 |
100.00 | 10.87 | ||||||
| December 31, 2009 |
100.00 | 11.18 | ||||||
| December 31, 2008 |
90.91 | 11.02 | ||||||
| (1) | Annualized rent per leased square foot is calculated by dividing (i) annualized base rent, by (ii) square footage leased. |
The following table sets forth the lease expirations for leases in place at Perimeter Square as of June 30, 2012, assuming that tenants do not exercise any renewal options or early termination options:
| Lease Expiration Year |
Number of Expiring Leases |
Square Footage of Expiring Leases |
Percentage of Property Leased Square Feet |
Annualized Base Rent ($ in 000s)(1) |
Percentage of Property Annualized Base Rent |
|||||||||||||||
| Available |
— | 2,504 | 4.30 | % | $ | — | — | % | ||||||||||||
| 2013 |
— | — | — | — | — | |||||||||||||||
| 2014 |
1 | 1,978 | 3.39 | 22 | 3.22 | |||||||||||||||
| 2015 |
2 | 12,754 | 21.89 | 143 | 20.61 | |||||||||||||||
| 2016 |
— | — | — | — | — | |||||||||||||||
| 2017 |
1 | 1,535 | 2.63 | 20 | 2.88 | |||||||||||||||
| 2018 |
2 | 32,113 | 55.10 | 403 | 58.21 | |||||||||||||||
| 2019 |
1 | 2,966 | 5.09 | 40 | 5.79 | |||||||||||||||
| 2020 and thereafter |
1 | 4,427 | 7.60 | 64 | 9.29 | |||||||||||||||
|
|
|
|
|
|
|
|
|
|
|
|||||||||||
| Total |
8 | 58,277 | 100.0 | % | $ | 692 | 100.0 | % | ||||||||||||
|
|
|
|
|
|
|
|
|
|
|
|||||||||||
| (1) | Annualized rent is calculated by multiplying (i) base rental payments for the month ended December 31, 2012 for the leases expiring during the applicable period, by (ii) 12. |
The Shoppes at Eagle Harbor
The Shoppes at Eagle Harbor is a 23,303 square foot strip center built by Wheeler Development in 2009. The property is located in Carrollton, Virginia and is occupied by seven tenants in a variety of businesses including retail, food service, and healthcare.
The following tenants lease more than 10% of the net rentable square feet of The Shoppes at Eagle Harbor:
Bon Secours Hampton Roads Health System
| • | Bon Secours leases 7,012 net rentable square feet, representing 30.09% of the net rentable square feet of The Shoppes at Eagle Harbor. |
| • | Annual rent under Bon Secours’ lease is $146,970. |
| • | The Bon Secours lease expires on September 30, 2015 and has four renewal options for three years each. |
A.J. Gators Sports Bar & Grill
| • | A.J. Gators Sports Bar & Grill currently leases 5,337 net rentable square feet, representing 22.90% of the net rentable square feet of The Shoppes at Eagle Harbor. |
14
| • | Annual rent under the A.J. Gators Sports Bar & Grill lease is $112,217. |
| • | The A.J. Gators Sports Bar & Grill lease expires on October 31, 2016 and has one renewal option for five years. |
Anytime Fitness
| • | Anytime Fitness leases 4,084 net rentable square feet, representing 17.53% of the net rentable square feet of The Shoppes at Eagle Creek. |
| • | Annual rent under the Anytime Fitness lease is $72,769. |
| • | The Anytime Fitness lease expires on January 31, 2014 and has two renewal options for five years each. |
Animal Clinic of Eagle Harbor
| • | The Animal Clinic of Eagle Harbor leases 2,812 net rentable square feet, representing 12.07% of the net rentable square feet of The Shoppes at Eagle Harbor. |
| • | Annual rent under the Animal Clinic of Eagle Harbor lease is $61,864. |
| • | The Animal Clinic of Eagle Harbor lease expires on July 31, 2014 and is not currently subject to any renewal options. |
The following table sets forth the percentage leased and annualized rent per leased square foot for The Shoppes at Eagle Harbor as of the indicated dates:
| Date |
Percent Leased | Annualized Rent Per Leased Square Foot(1) |
||||||
| December 31, 2012 |
100.00 | % | $ | 20.28 | ||||
| December 31, 2011 |
100.00 | 18.84 | ||||||
| December 31, 2010 |
94.05 | 20.50 | ||||||
| December 31, 2009 |
94.05 | 20.26 | ||||||
| December 31, 2008 |
48.19 | 20.49 | ||||||
| (1) | Annualized rent per leased square foot is calculated by dividing (i) annualized base rent, by (ii) square footage. |
The following table sets forth the lease expirations for leases in place at The Shoppes at Eagle Harbor as of December 31, 2012, assuming that tenants do not exercise any renewal options or early termination options:
| Lease Expiration Year |
Number of Expiring Leases |
Square Footage of Expiring Leases |
Percentage of Property Leased Square Feet |
Annualized Base Rent (in 000s)(1) |
Percentage of Property Annualized Base Rent |
|||||||||||||||
| Available |
— | — | — | % | $ | — | — | % | ||||||||||||
| 2013 |
1 | 1,386 | 5.95 | 29 | 6.13 | |||||||||||||||
| 2014 |
3 | 8,182 | 35.11 | 158 | 33.40 | |||||||||||||||
| 2015 |
2 | 8,398 | 36.04 | 174 | 36.79 | |||||||||||||||
| 2016 |
1 | 5,337 | 22.90 | 112 | 23.68 | |||||||||||||||
| 2017 |
— | — | — | — | — | |||||||||||||||
| 2018 |
— | — | — | — | — | |||||||||||||||
| 2019 |
— | — | — | — | — | |||||||||||||||
| 2020 and thereafter |
— | — | — | — | — | |||||||||||||||
|
|
|
|
|
|
|
|
|
|
|
|||||||||||
| Total |
7 | 23,303 | 100.0 | % | $ | 473 | 100.0 | % | ||||||||||||
|
|
|
|
|
|
|
|
|
|
|
|||||||||||
| (1) | Annualized rent is calculated by multiplying (i) base rental payments for the month ended December 31, 2012 for the leases expiring during the applicable period, by (ii) 12. |
15
Harps at Harbor Point
Harps at Harbor Point is a 31,500 square foot shopping center built in 2012 and was acquired by our company on December 14, 2012. The property is located in Grove, Oklahoma. The property is 100% leased by one tenant, a Harps Food Store, under a single tenant triple net lease. The annual rent under the Harps Food Store lease is currently $364,432, or an $11.57 annualized rent per square foot. The Harps Food Store lease will expire on August 31, 2032 and is subject to eight renewal options of five years each. The property was 100% leased at December 31, 2012 and maintained a $11.57 annualized rent per square foot.
Twin City Crossing
Twin City Crossing is a 47,680 square foot neighborhood shopping center built in 1998 and renovated in 2002. We acquired the center on December 21, 2012. The property is located in Batesburg-Leesville, South Carolina and is currently occupied by five tenants, including a BI-LO grocery store. The property was 100% leased at December 31, 2012 and maintained a $9.37 annualized rent per square foot.
BI-LO leases 41,980 net rentable square feet, representing 88.05% of the total net rentable square feet at Twin City Crossing. BI-LO is the only tenant leasing in excess of 10% of the GLA of Twin City Crossing. The annual rent under the BI-LO lease is $356,830. The BI-LO lease is set to expire on December 31, 2021 and is subject to six renewal options of five years each.
The following table sets forth the lease expirations for leases in place at Twin City Crossing as of December 31, 2012, assuming that the tenants do not exercise any renewal options or early termination options:
| Lease Expiration Year |
Number of Expiring Leases |
Total Expiring GLA |
Percent of Total GLA Expiring |
Expiring Base Rent ($ in 000s) |
Percent of Total Base Rent |
|||||||||||||||
| Available |
— | — | 0.0 | % | $ | — | 0.0 | % | ||||||||||||
| 2013 |
— | — | 0.0 | — | 0.0 | |||||||||||||||
| 2014 |
2 | 2,700 | 5.66 | 34 | 7.61 | |||||||||||||||
| 2015 |
1 | 1,200 | 2.52 | 19 | 4.25 | |||||||||||||||
| 2016 |
— | — | 0.0 | — | 0.0 | |||||||||||||||
| 2017 |
1 | 1,800 | 3.78 | 37 | 8.28 | |||||||||||||||
| 2018 |
— | — | 0.0 | — | 0.0 | |||||||||||||||
| 2019 |
— | — | 0.0 | — | 0.0 | |||||||||||||||
| 2020 |
— | — | 0.0 | — | 0.0 | |||||||||||||||
| 2021 |
1 | 41,980 | 88.04 | 357 | 79.86 | |||||||||||||||
| 2022 and thereafter |
— | — | 0.0 | — | 0.0 | |||||||||||||||
|
|
|
|
|
|
|
|
|
|
|
|||||||||||
| 5 | 47,680 | 100.0 | % | $ | 447 | 100.0 | % | |||||||||||||
|
|
|
|
|
|
|
|
|
|
|
|||||||||||
Surrey Plaza
Surrey Plaza is a 42,680 square foot neighborhood shopping center built in 1993 and was acquired by our company on December 21, 2012. The property is located in Hawkinsville, Georgia and is currently occupied by 5 tenants, including a Harvey’s Supermarket, Rite Aid and Snap Fitness. The property was 100% leased at December 31, 2012 and maintained a $7.09 annualized rent per square foot.
The following tenants lease more than 10% of the GLA of Surrey Plaza:
Harvey’s Supermarket
| • | Harvey’s Supermarket leases 29,000 net rentable square feet, representing 67.95% of the net rentable square feet of the Surrey Plaza. |
| • | Annual rent under the Harvey’s lease is $187,050. |
| • | The Harvey’s lease expires on January 19, 2018 and has three renewal options for five years each. |
Rite Aid Pharmacy
| • | Rite Aid leases 7,680 net rentable square feet, representing 17.99% of the net rentable square feet of Surrey Plaza. |
| • | Annual rent under the Rite Aid lease is $59,520. |
| • | The Rite Aid lease expires on January 19, 2018 and has one renewal option for five years. |
16
Snap Fitness
| • | Snap Fitness leases 4,500 net rentable square feet, representing 10.54% of the net rentable square feet of Surrey Plaza. |
| • | Annual rent under the Snap Fitness lease is $31,500. |
| • | The Snap Fitness lease expires on March 31, 2017 and has two renewal options for five years each. |
The following table sets forth the lease expirations for leases in place at Surrey Plaza as of December 31, 2012, assuming that the tenants do not exercise any renewal options or early termination options:
| Lease Expiration Year |
Number of Expiring Leases |
Total Expiring GLA |
Percent of Total GLA Expiring |
Expiring Base Rent (in 000s) |
Percent of Total Base Rent |
|||||||||||||||
| Available |
— | — | 0.0 | $ | — | 0.0 | % | |||||||||||||
| 2013 |
1 | 1,500 | 3.52 | 19 | 6.27 | % | ||||||||||||||
| 2014 |
1 | — | 0.0 | 6 | 1.98 | |||||||||||||||
| 2015 |
— | — | 0.0 | — | 0.0 | |||||||||||||||
| 2016 |
— | — | 0.0 | — | 0.0 | |||||||||||||||
| 2017 |
1 | 4,500 | 10.54 | 31 | 10.23 | |||||||||||||||
| 2018 |
2 | 36,680 | 85.94 | 247 | 81.52 | |||||||||||||||
| 2019 |
— | — | 0.0 | — | 0.0 | |||||||||||||||
| 2020 |
— | — | 0.0 | — | 0.0 | |||||||||||||||
| 2021 |
— | — | 0.0 | — | 0.0 | |||||||||||||||
| 2022 and thereafter |
— | — | 0.0 | — | 0.00 | |||||||||||||||
|
|
|
|
|
|
|
|
|
|
|
|||||||||||
| 5 | 42,680 | 100.0 | % | $ | 303 | 100.0 | % | |||||||||||||
|
|
|
|
|
|
|
|
|
|
|
|||||||||||
Riversedge North
Riversedge North is a 10,550 square foot free-standing office building built by Wheeler Development in 2007. The property is located in Virginia Beach, Virginia and has been 100% leased by Wheeler Interests since November 2007. The annual rent under the Wheeler Interests lease is currently $274,131. The Wheeler Interests lease will expire on November 14, 2017, subject to four renewal terms of five years each.
Monarch Bank
The Monarch Bank property is a 3,620 square foot free-standing branch location of Monarch Bank and Monarch Financial Holdings, Inc., built in 2002. The property is located in Virginia Beach, Virginia and has been 100% leased by Monarch Bank under a single tenant triple net lease since December 2007. The annual rent under the Monarch Bank lease is currently $211,054. The Monarch Bank lease expired December 31, 2012 and was subject to two renewal terms of five years each. During January 2012, Monarch Bank exercised its first renewal option that will become effective January 1, 2013. Under the renewal option, annual rent will increase to $250,757.
Amscot Building
The Amscot Building is a 2,500 square foot free-standing branch location of Amscot Corporation built by Wheeler Development in 2004. Amscot Corporation is a financial services business, offering services such as check cashing, money orders, payday advances and prepaid debit cards. The property is located in Tampa, Florida and has been 100% leased by Amscot Corporation since March 2005. The annual rent under the Amscot Corporation lease is currently $101,400. The Amscot Corporation lease will expire March 31, 2020, subject to three renewal terms of five years each.
17
Outstanding Indebtedness
As of December 31, 2012, the outstanding mortgage indebtedness secured by our properties was approximately $31.8 million. Although we intend to assume each of these loans in connection with our formation transactions, the assumption is subject to the prior consent of the lenders and there can be no assurance that we will be able to obtain their consent. The following table sets forth information with respect to such indebtedness (dollars in thousands):
| Amount of Debt Outstanding as of December 31, 2012 |
Weighted Average Interest Rate |
Maturity Date | Amortization Period (Mths) |
Annual Debt Service |
Balance At Maturity |
|||||||||||||||||||
| Shoppes at TJ Maxx |
$ | 6,400,000 | 6.00 | % | 4/19/2013 | (3) | N/A | $ | 384,000 | $ | 6,400,000 | |||||||||||||
| Walnut Hill Plaza |
3,528,232 | 6.75 | 4/11/2014 | 300 | 303,232 | 3,447,074 | ||||||||||||||||||
| Lumber River Village |
3,050,117 | 5.65 | 5/1/2015 | 120 | 220,966 | 2,867,493 | ||||||||||||||||||
| Perimeter Square |
4,537,456 | 6.38 | 6/11/2016 | 120 | 337,066 | 4,101,738 | ||||||||||||||||||
| The Shoppes at Eagle Harbor |
3,904,664 | 6.20 | 2/28/2013 | (2) | 60 | 370,359 | 3,904,664 | |||||||||||||||||
| Riversedge North |
2,098,138 | 6.00 | 4/16/2013 | 60 | 162,674 | 2,088,865 | ||||||||||||||||||
| Monarch Bank |
1,533,346 | 4.15 | 12/30/2017 | 240 | 113,675 | 1,259,780 | ||||||||||||||||||
| Harps at Harbor Point |
3,416,550 | 3.99 | 12/14/2015 | 300 | 217,464 | 3,169,967 | ||||||||||||||||||
| Twin City Crossing |
3,375,000 | 4.86 | 1/6/2023 | 360 | 213,924 | 2,733,513 | ||||||||||||||||||
|
|
|
|||||||||||||||||||||||
| $ | 31,843,503 | |||||||||||||||||||||||
|
|
|
|||||||||||||||||||||||
| (1) | We currently have a commitment from a lender to refinance this property at a 3.88% interest rate and a 7 year maturity date with monthly principal interest payments of $33,880.18 based on a 25 year amortization. |
| (2) | The Shoppes at Eagle Harbor loan matured on February 28, 2013. We have refinanced the loan with another financial institution for $4.0 million at a 4.34% fixed interest rate. The loan calls for monthly principal and interest payments of $24,691.82 based on a 20 year amortization and a maturity date of February 28, 2018. |
| (3) | Debt is interest only until maturity. |
Major Tenants
The following table sets forth information regarding the ten largest tenants in our operating portfolio based on annualized base rent as of December 31, 2012.
| Tenants |
Total Net Rentable Square Feet |
Percent Of Total Net Rentable Square Feet |
Annualized Base Rent ($ in 000s) |
Percent of Total Annualized Base Rent |
Base Rent Per Leased Square Foot |
|||||||||||||||
| Bi-Lo |
41,980 | 8.93 | % | $ | 357 | 7.22 | % | $ | 8.50 | |||||||||||
| TJ Maxx |
32,400 | 6.89 | 294 | 5.94 | 9.07 | |||||||||||||||
| Harps Food Store |
31,500 | 6.70 | 364 | 7.36 | 11.57 | |||||||||||||||
| Food Lion |
30,280 | 6.44 | 155 | 3.13 | 5.12 | |||||||||||||||
| Harvey’s Supermarket |
29,000 | 6.17 | 187 | 3.78 | 6.45 | |||||||||||||||
| Career Point Business School |
26,813 | 5.70 | 339 | 6.85 | 12.64 | |||||||||||||||
| Family Dollar |
16,601 | 3.53 | 114 | 2.30 | 6.87 | |||||||||||||||
| Variety Wholesalers |
15,000 | 3.19 | 72 | 1.46 | 4.80 | |||||||||||||||
| Moran Foods |
14,812 | 3.15 | 98 | 1.98 | 6.62 | |||||||||||||||
| Cannon’s Online Auctions |
14,000 | 2.98 | 84 | 1.70 | 6.00 | |||||||||||||||
| Beauty World |
11,780 | 2.50 | 111 | 2.24 | 9.42 | |||||||||||||||
|
|
|
|
|
|
|
|
|
|
|
|||||||||||
| Total Top Ten Tenants/Weighted Average |
264,166 | 56.18 | % | $ | 2,175 | 43.96 | % | $ | 8.23 | |||||||||||
|
|
|
|
|
|
|
|
|
|
|
|||||||||||
18
Lease Expirations
The following table sets forth information with respect to the lease expirations of our properties as of December 31, 2012.
| Lease Expiration Year |
Number of Expiring Leases |
Total Expiring Net Rentable Square Feet |
Percent of Total Net Rentable Square Feet Expiring |
Expiring Base Rent (in 000s) |
Percent of Total Base Rent |
Expiring Base Rent Per Leased Square Foot |
||||||||||||||||||
| Available |
— | 26,881 | 5.71 | % | $ | — | — | % | $ | — | ||||||||||||||
| 2013 |
9 | 26,693 | 5.68 | 282 | 5.71 | 10.58 | ||||||||||||||||||
| 2014 |
15 | 28,630 | 6.09 | 411 | 8.30 | 14.34 | ||||||||||||||||||
| 2015 |
9 | 54,611 | 11.61 | 614 | 12.41 | 11.25 | ||||||||||||||||||
| 2016 |
8 | 41,142 | 8.75 | 466 | 9.42 | 11.33 | ||||||||||||||||||
| 2017 |
8 | 33,039 | 7.02 | 736 | 14.88 | 22.29 | ||||||||||||||||||
| 2018 |
9 | 133,978 | 28.48 | 1,099 | 22.20 | 8.20 | ||||||||||||||||||
| 2019 |
4 | 44,969 | 9.56 | 453 | 9.16 | 10.08 | ||||||||||||||||||
| 2020 |
1 | 4,427 | 0.94 | 64 | 1.30 | 14.52 | ||||||||||||||||||
| 2021 |
1 | 41,980 | 8.93 | 357 | 7.21 | 8.50 | ||||||||||||||||||
| 2022 and thereafter |
2 | 34,000 | 7.23 | 466 | 9.41 | 13.70 | ||||||||||||||||||
|
|
|
|
|
|
|
|
|
|
|
|
|
|||||||||||||
| Total/Weighted Average |
66 | 470,350 | 100 | % | $ | 4,948 | 100 | % | $ | 11.16 | ||||||||||||||
|
|
|
|
|
|
|
|
|
|
|
|
|
|||||||||||||
Property Management and Leasing Strategy
Our property management and substantially all of our leasing activities and operating and administrative functions (including leasing, legal, acquisitions, development, data processing, finance and accounting) are administered or coordinated by our Administrative Service Company. On-site functions such as maintenance, landscaping, sweeping, plumbing and electrical are subcontracted out at each location and, to the extent permitted by their respective leases, the cost of these functions is passed on to the tenants.
We believe that focused property management, leasing and customer retention are essential to maximizing the sales per square foot, operating cash flow and value of our properties. Our primary goal in property management is to maintain an attractive shopping environment on a cost effective basis for our tenants.
The majority of our property management and leasing functions are supervised and administered by our Administrative Service Company. Our Administrative Service Company maintains regular contact with our tenants and frequently visits each asset to ensure the proper implementation and execution of our market strategies. As part of our ongoing property management, our Administrative Service Company conducts regular physical property reviews to improve our properties, react to changing market conditions and ensure proper maintenance.
Our leasing representatives have become experienced in the markets in which we operate by becoming familiar with current tenants as well as potential local, regional and national tenants that would complement our current tenant base. We study demographics, customer sales and merchandising mix to optimize the sales performance of our centers and thereby increase rents. We believe this hands-on approach maximizes the value of our shopping centers.
19
Depreciation
The following table sets forth depreciation information for our properties as of December 31, 2012.
| Federal Tax Basis |
Depreciation Rate |
Method of Depreciation |
Useful Life Claimed |
|||||||||||
| Shoppes at TJ Maxx |
$ | 6,719,385 | 3.29 | % | Straight-Line | 5-39 Years | ||||||||
| Walnut Hill Plaza |
3,729,329 | 5.47 | Straight-Line | 5-39 Years | ||||||||||
| Lumber River Village |
4,486,787 | 2.84 | Straight-Line | 5-39 Years | ||||||||||
| Perimeter Square |
5,081,193 | 3.10 | Straight-Line | 5-39 Years | ||||||||||
| The Shoppes at Eagle Harbor |
4,457,803 | 2.39 | Straight-Line | 5-39 Years | ||||||||||
| Riversedge North |
2,207,571 | 5.31 | Straight-Line | 5-39 Years | ||||||||||
| Monarch Bank |
1,986,364 | 8.00 | Straight-Line | 5-39 Years | ||||||||||
| Amscot Building |
479,902 | 3.17 | Straight-Line | 5-39 Years | ||||||||||
| Harps at Harbor Point |
2,891,853 | 3.19 | Straight-Line | 5-39 Years | ||||||||||
| Twin City Crossing |
3,040,955 | 4.08 | Straight-Line | 5-39 Years | ||||||||||
| Surrey Plaza |
1,856,514 | 3.87 | Straight-Line | 5-39 Years | ||||||||||
| Wheeler Real Estate Investment Trust, L.P. |
17,813 | 20.00 | Straight-Line | 5-39 Years | ||||||||||
|
|
|
|||||||||||||
| $ | 36,955,469 | |||||||||||||
|
|
|
|||||||||||||
Real Estate Taxes
The following table sets forth real estate tax information for our properties:
| 2012 Realty Tax Rate(1) |
Total Annual Real Estate Taxes for the 2012 Tax Year |
|||||||
| Shoppes at TJ Maxx |
0.87 | % | $ | 77,819 | (2) | |||
| Walnut Hill Plaza |
1.35 | 53,571 | ||||||
| Lumber River Village |
1.38 | 44,969 | ||||||
| Perimeter Square |
1.48 | 63,716 | (2) | |||||
| The Shoppes at Eagle Harbor |
0.65 | 24,242 | ||||||
| Riversedge North |
0.89 | 16,424 | ||||||
| Monarch Bank |
0.89 | 10,578 | ||||||
| Amscot Building |
0.00 | — | (3) | |||||
| Harps at Harbor Point |
0.00 | — | (4) | |||||
| Twin City Crossing |
2.67 | 56,719 | (2) | |||||
| Surrey Plaza |
3.30 | 31,243 | (2) | |||||
|
|
|
|
|
|||||
| 13.48 | % | $ | 379,281 | |||||
|
|
|
|
|
|||||
| (1) | Represents the percentage of assessed value. |
| (2) | Property acquired during 2012. Taxes estimated based on real estate taxes paid by previous owner. |
| (3) | Amscot Building is under a ground lease that does not require it to pay real estate taxes. |
| (4) | Property built during 2012, so assessments and related tax bills are unavailable. |
| Item 3. | Legal Proceedings |
We are subject to various legal proceedings and claims that arise in the ordinary course of business. These matters are generally covered by insurance. While the resolution of these matters cannot be predicted with certainty, management believes the final outcome of such matters will not have a material adverse effect on our financial position, results of operation or liquidity.
We are involved in a lawsuit whereby we originally sued a prospective tenant for breach of contract related to an executed lease. The court found in favor of the defendant and assessed damages against us in the amount of $13,300. The defendant’s attorney has applied to the court to be reimbursed legal fees incurred by the defendant of approximately $368,000. We are responding to the litigation and intend to appeal and contest the ruling vigorously.
20
| Item 4. | Mine Safety Disclosures |
Not applicable.
Item 5. Market for Registrant’s Common Equity, Related Shareholder Matters and Issuer Purchases of Equity Securities
Market Information.
Our common stock is traded on the NASDAQ Stock Market under the symbol “WHLR”. On March 27, 2013, the closing price of our common stock reported on the Nasdaq Stock Market was $6.06 per share. Our common stock began trading on November 19, 2012. The high and low common stock sales prices per share during the periods indicated were as follows:
| Price per share of common stock: |
||||||||||||||||||||
| Quarter Ended |
Mar. 31 | June 30 | Sept. 30 | Dec. 31 |
Year | |||||||||||||||
| Fiscal year 2012 |
||||||||||||||||||||
| High |
$ | N/A | $ | N/A | $ | N/A | $ | 6.84 | $ | 6.84 | ||||||||||
| Low |
$ | N/A | $ | N/A | $ | N/A | $ | 5.50 | $ | 5.50 | ||||||||||
| Fiscal year 2011 |
||||||||||||||||||||
| High |
$ | N/A | $ | N/A | $ | N/A | $ | N/A | $ | N/A | ||||||||||
| Low |
$ | N/A | $ | N/A | $ | N/A | $ | N/A | $ | N/A | ||||||||||
Approximate Number of Holders of Our Common Shares
As of March 20, 2013 there were 29 holders of record of our common shares. This number excludes our common shares owned by shareholders holding under nominee security position listings.
Dividend Policy
We intend to pay cash dividends to holders of our common stock on a monthly basis. We paid a pro rata dividend with respect to the period commencing on the completion of our initial public offering and ending December 31, 2012 based on an annualized amount of $0.42 per share. We intend to maintain our initial dividend rate for the 12-month period following completion of our initial public offering unless actual results of operations, economic conditions or other factors differ materially from the assumptions used in our estimate. We intend to make dividend distributions that will enable us to meet the distribution requirements applicable to REITs and to eliminate or minimize our obligation to pay income and excise taxes. Initially, we will be required to use a portion of the net proceeds from our initial public offering to make such distributions. We may in the future also choose to pay dividends in shares of our common stock. See “Management’s Discussion and Analysis of Financial Condition and Results of Operations-Future Liquidity Needs.”
21
Dividend Payments
We have made dividend payments to holders of our common stock and holders of common units in our Operating Partnership as follows since completion of our initial public offering in November 2012:
| Dividend Period |
Record Date |
Payment Date | Payment Amount per Share or Unit |
|||||||||
| November 19, 2012 - December 31, 2012 |
1/1/13 | 1/31/13 | $ | 0.049 | ||||||||
| January 1, 2013 - January 31, 2013 |
2/1/13 | 2/28/13 | 0.035 | |||||||||
| February 1, 2013 – February 28, 2013 |
3/1/13 | 3/31/13 | 0.035 | |||||||||
Equity Compensation Plan Information
| Plan category |
Number of securities to be issued upon exercise of outstanding options, warrants and rights |
Weighted-average exercise price of outstanding options, warrants and rights |
Number of securities remaining available for future issuance under equity compensation plans (excluding securities reflected in column (a)) |
|||||||||
| Equity compensation plans approved by security holders |
0 | N/A | 500,000 | |||||||||
| Equity compensation plans not approved by security holders |
N/A | N/A | N/A | |||||||||
| Total |
0 | N/A | 500,000 | |||||||||
Use of Proceeds from Initial Public Offering
We closed our initial public offering on November 16, 2013. The effective date of our registration statement was October 23, 2012, and the file number assigned to it was 333-177262. After deducting the placement fee and commissions and other expenses of the initial public offering, we received net proceeds of approximately $13.46 million. Capitol Securities Management, Inc. and Wellington Shields & Co., LLC served as our placement agents for the offering. As of December 31, 2012, we spent proceeds from the offering in accordance with the following table:
| Description of Use |
Proposed Expenditure Amount |
Actual Expenditures through December 31, 2012 |
||||||
| Repayment of outstanding indebtedness |
500,000 | 840,500 | ||||||
| General working capital, including funding of dividend payments |
2,000,000 | 321,000 | ||||||
| Reimbursement of Operating Partnership for purchase of membership interests of DF-1 Carrollton, LLC |
1,780,000 | 1,782,337 | ||||||
| Cash payments to prior investors who have elected to receive cash instead of Operating Partnership Units for their contribution of membership interests in the Ownership Entities |
4,180,000 | 4,204,000 | ||||||
| Future Acquisitions |
5,000,000 | 5,035,000 | ||||||
|
|
|
|
|
|||||
| Total |
$ | 13,460,000 | $ | 12,182,837 | ||||
|
|
|
|
|
|||||
22
Recent Sales of Unregistered Securities
On August 2, 2011, we completed a private offering of 126,250 shares of our Series A Convertible Preferred Stock at an offering price of $4.00 per share. There were no underwriting discounts or commissions in connection with such issuance and we received proceeds of $505,000. Such shares were purchased by 16 investors, all of whom are “accredited investors” as defined under Regulation D of the Securities Act of 1933. The issuance of such shares was effected in reliance upon exemptions from registration provided by Section 4(2) of the Securities Act of 1933, as amended and Rule 506 of Regulation D promulgated thereunder.
On January 26, 2012, we completed a private offering of 57,250 shares of our Series A Convertible Preferred Stock at an offering price of $4.00 per share. There were no underwriting discounts or commissions in connection with such issuance and we received proceeds of $229,000. Such shares were purchased by 10 investors, all of whom are “accredited investors” as defined under Regulation D of the Securities Act of 1933. The issuance of such shares was effected in reliance upon exemptions from registration provided by Section 4(2) of the Securities Act of 1933, as amended and Rule 506 of Regulation D promulgated thereunder.
On April 12, 2012, we completed a private offering of 66,250 shares of our Series A Convertible Preferred Stock at an offering price of $4.00 per share. There were no underwriting discounts or commissions in connection with such issuance and we received proceeds of $265,000. Such shares were purchased by 3 investors, all of whom are “accredited investors” as defined under Regulation D of the Securities Act of 1933. The issuance of such shares was effected in reliance upon an exemption from registration provided by Section 4(2) of the Securities Act of 1933, as amended and Rule 506 of Regulation D promulgated thereunder.
In connection with the formation transactions associated with our initial public offering, our Operating Partnership issued an aggregate of 1,730,129 common units with an aggregate value of approximately $9.1 million, based on the offering price of $5.25 per share, to certain persons owning interests in the entities that owned the properties comprising our portfolio as consideration for such transactions. All such persons had a substantive, pre-existing relationship with us. The issuance of such units was effected in reliance upon an exemption from registration provided by Section 4(2) of the Securities Act of 1933, as amended and corresponding state securities registration exemptions.
In connection with the Twin City Crossing and Surrey Plaza acquisitions that occurred in December 2012, our Operating Partnership issued 127,929 common units to an aggregate of 29 investors with an aggregate value of approximately $750,000 based on share prices ranging from $5.80 to $5.90. The issuance of such units was effected in reliance upon and exemption from registration provided by Section 4(2) of the Securities Act of 1933, as amended, and corresponding state securities registration exemptions.
| Item 6. | Selected Financial Data |
Not applicable.
| Item 7. | Management’s Discussion and Analysis of Financial Condition and Results of Operations |
You should read the following discussion of our financial condition and results of operations in conjunction with our audited consolidated financial statements and the notes thereto included in this Form 10-K, and the consolidated financial statements and the notes thereto and “Management’s Discussion and Analysis of Financial Condition and Results of Operations” contained in our Registration Statement. For more detailed information regarding the basis of presentation for the following information, you should read the notes to the audited consolidated financial statements included in this Form 10-K.
Company Overview
On November 16, 2012, we closed our initial public offering (IPO) by selling 3,016,045 shares of common stock at $5.25 per share, generating approximately $15.83 million in gross proceeds. Additionally, the formation transactions as described in our Registration Statement on Form S-11 filed with the SEC were executed.
We were formed with the principle objective of acquiring, financing, developing, leasing, owning and managing income producing, strip centers, neighborhood centers, grocery-anchored centers, community centers and free-standing retail properties. Our strategy is to opportunistically acquire quality, well-located, predominantly retail
23
properties in secondary and tertiary markets that generate attractive risk-adjusted returns. We generally target competitively protected properties located within developed areas, commonly referred to as in-fill, that possess minimal competition risk and are surrounded by communities that have strong demographics and dynamic, diversified economies that will continue to generate jobs and future demand for commercial real estate. Our primary target markets include the Mid-Atlantic, Southeast and Southwest.
Our portfolio is comprised of seven retail shopping centers, three free-standing retail properties and one office building. Five of these properties are located in Virginia, one is located in North Carolina, one is located in South Carolina, one is located in Georgia, one is located in Florida and two are located in Oklahoma. Our portfolio has a total GLA of 470,350 square feet and an occupancy level of approximately 94%. Our portfolio consists of the following entities and their related properties:
Original Formation Properties:
| • | The Shoppes at Eagle Harbor (Carrollton, VA) |
| • | Monarch Bank Building (Virginia Beach, VA) |
| • | Amscot Building (Tampa, FL) |
| • | Riversedge North (Virginia Beach, VA) |
| • | Walnut Hill Plaza (Petersburg, VA) |
| • | Lumber River Village (Lumberton, NC) |
| • | Perimeter Square (Tulsa, OK) |
| • | Shoppes at TJ Maxx (Richmond, VA) |
Properties Acquired Subsequent to Formation:
| • | Harps at Harbor Point (Grove, OK) |
| • | Twin City Crossing (Leesville-Batesburg, SC) |
| • | Surrey Plaza (Hawkinsville, GA) |
We acquired Harps at Harbor Point, Twin City Crossing and Surrey Plaza during December 2012. Details regarding these acquisitions can be found in the “Recent Trends and Activities – Property Acquisitions” section below.
Recent Trends and Activities
Since completing the IPO and formation transactions, there have been several significant events that have positively impacted our company. These events are summarized below.
Property Acquisitions
On December 14, 2012, we purchased a 31,500 square foot free-standing retail property located in Grove, Oklahoma for a purchase price of approximately $4.55 million. Referred to as Harps at Harbor Point, the property is 100% occupied by Harps Food Stores (Harps) through a stabilized 20-year, triple-net lease expiring in June 2032 with four five-year options available. Harps is one of the grocery industry’s most recognized independent chains with over 65 locations throughout Oklahoma, Arkansas, and Missouri.
On December 18, 2012, we purchased a 47,680 square foot grocery-anchored shopping center located in Batesburg-Leesville, South Carolina for a purchase price of approximately $4.50 million. Referred to as Twin City Crossing, the property is 100% occupied and is anchored by a Bi-Lo grocery store. Bi-Lo occupies 88% of the total rentable square feet of the center through a 10-year lease expiring in December 2021 with six five-year options available.
On December 21, 2012, we purchased a 42,680 square foot grocery-anchored shopping center located in Hawkinsville, Georgia for a purchase price of approximately $2.30 million. Referred to as Surrey Plaza, the property is 100% occupied and is anchored by a Harvey’s Supermarket and a Rite-Aid pharmacy. Harvey’s and Rite-Aid occupy approximately 86% of the total rentable square feet of the center through a 10-year leases expiring in January 2018. Harvey’s lease includes three five-year options while Rite-Aid’s lease includes one five-year option.
24
Financing Activities
On December 20, 2012, the mortgage term loan for the Monarch Bank building was modified as follows: the loan was termed out to include monthly principal and interest payments of $9,473 based on a 20 year amortization period; the interest rate was lowered from 7% to 4.15%; and the maturity date was extended from December 2012 to December 2017. Additionally, we made a principal curtailment of approximately $511,100, reducing the outstanding balance to $1,533,346.
The Shoppes at Eagle Harbor loan matured on February 28, 2013. We have refinanced the loan with another financial institution for $4.0 million at a 4.34% fixed interest rate. The loan calls for monthly principal and interest payments of $24,692 based on a 20 year amortization and a maturity date of February 28, 2018.
Leasing Renewals and Expirations
Effective October 1, 2012, we leased a 14,000 square foot previously vacant space at the Shoppes at TJ Maxx at a base rent of $7,000 per month, expiring on September 30, 2015.
On October 25, 2012, TJ Maxx elected to exercise their next five year option at the Shoppes at TJ Maxx which will take effect in May 2014. As a condition for exercising the option early, we agreed to keep their base rent at the same rate during the option period as it is now. Additionally, we granted TJ Maxx another five year option that will be available to them in 2019.
On November 13, 2012, Food Lion elected to exercise their first five year option at Lumber River Plaza which will begin on July 1, 2013. Per the original lease, annual rent will remain at $155,260. They have three five year options remaining to exercise if they so choose.
Renewals during 2012, including those that occurred at the properties we acquired during the year and the TJ Maxx and Food Lion options discussed above, were comprised of ten deals totaling 79,233 square feet with a weighted average increase of $0.13 per square foot. There were no tenant improvement concessions offered for these deals, and the commission rate per square foot equated to $1.25. The rates on negotiated renewals resulted in a weighted average increase of $0.52 per square foot on five renewals, no per square foot rate changes on six renewals and a $1.25 per square foot decrease on one renewal. Eight of these renewals represented options being exercised.
We signed three new leases during the year, including the Harps Food Store lease, totaling 50,000 square feet with a weighted average rate of $9.60 per square foot. One of these new leases filled a previous 14,000 square foot vacancy at TJ Maxx. The commission rate per square foot equated to $0.34, primarily due to the fact that the Harps lease did not result in a commission being paid since it occurred in conjunction with the acquisition. The weighted average lease term for these three leases is 13.89 years.
Two leases that expired during the year were not renewed by the tenant. These spaces totaled 7,708 square feet and carried a $14.31 per square foot rate. We are actively marketing these spaces to be backfilled with new tenants.
Approximately 5.68% of our gross leasable area is subject to leases that expire during the year ending December 31, 2013. Based on recent market trends, we believe that these leases will be renewed at amounts and terms comparable to existing lease agreements.
Critical Accounting Policies
The following discussion and analysis of our financial condition and results of operations are based upon our consolidated financial statements included in this Form 10-K, which have been prepared in accordance with accounting principles generally accepted in the United States. The preparation of these consolidated financial statements requires us to make estimates and judgments that affect the reported amounts of assets, liabilities, revenues and expenses. On an on-going basis, we evaluate our estimates based on historical experience and on various other assumptions that are believed to be reasonable under the circumstances, the results of which form the basis for making judgments about the carrying values of assets and liabilities that are not readily apparent from other sources. Actual results may differ from these estimates under different assumptions or conditions.
The critical accounting policies summarized in this section are discussed in further detail in the notes to the financial statements appearing elsewhere in this Form 10-K. Management believes that the application of these policies on a consistent basis enables us to provide useful and reliable financial information about our operating results and financial condition.
25
Revenue Recognition
Principal components of our total revenues include base and percentage rents and tenant reimbursements. We accrue minimum (base) rent on a straight-line basis over the terms of the respective leases which results in an unbilled rent asset or deferred rent liability being recorded on the balance sheet. Certain lease agreements contain provisions that grant additional rents based on tenants’ sales volumes (contingent or percentage rent) which we recognize when the tenants achieve the specified targets as defined in their lease agreements. We periodically review the valuation of the asset/liability resulting from the straight-line accounting treatment of our leases in light of any changes in lease terms, financial condition or other factors concerning our tenants.
Receivables
We record a tenant receivable for amounts due from tenants such as base rents, tenant reimbursements and other charges allowed under the lease terms. We periodically review tenant receivables for collectability and determine the need for an allowance for the uncollectible portion of accrued rents and other accounts receivable based upon customer creditworthiness (including expected recovery of a claim with respect to any tenants in bankruptcy), historical bad debt levels and current economic trends. We consider a receivable past due once it becomes delinquent per the terms of the lease; our standard lease form considers a rent charge past due after five days. A past due receivable triggers certain events such as notices, fees and other allowable and required actions per the lease.
Acquired Properties and Lease Intangibles
We allocate the purchase price of the acquired properties to land, building and improvements, identifiable intangible assets and to the acquired liabilities based on their respective fair values. Identifiable intangibles include amounts allocated to acquired out-of-market leases and the value of in-place leases. We determine fair value based on estimated cash flow projections that utilize appropriate discount and capitalization rates and available market information. Estimates of future cash flows are based on a number of factors including the historical operating results, known trends and specific market and economic conditions that may affect the property. Management also estimates costs to execute similar leases including leasing commissions, tenant improvements, legal and other related expenses. Such amounts are based on estimates and forecasts which, by their nature, are highly subjective and may result in future changes in the event forecasts are not realized.
Impairment of Long-Lived Assets
We periodically review investment properties for impairment on a property-by-property basis whenever events or changes in circumstances indicate that the carrying value of investment properties may not be recoverable, with an evaluation performed at least annually. These circumstances include, but are not limited to, declines in the property’s cash flows, occupancy and fair market value. We measure any impairment of investment property when the estimated undiscounted operating income before depreciation and amortization, plus its residual value, is less than the carrying value of the property. To the extent impairment has occurred, we charge to income the excess of carrying value of the property over its estimated fair value. We estimate fair value using unobservable data such as operating income, estimated capitalization rates or multiples, leasing prospects and local market information. We may decide to sell properties that are held for use and the sale prices of these properties may differ from their carrying values. We did not record any impairment charges during the years ended December 31, 2012 and 2011.
26
Liquidity and Capital Resources
At December 31, 2012, our consolidated cash and cash equivalents totaled $2.05 million compared to consolidated cash and cash equivalents of $104,007 at December 31, 2011. Cash flows from operating activities, investing activities and financing activities for the years ended December 31, 2012 and 2011 (the “2012 period” and “2011 period”, respectively) are as follows:
| Years Ended December 31, | Period Over Period Change | |||||||||||||||
| 2012 | 2011 | $ | % | |||||||||||||
| Operating activities |
$ | (289,884 | ) | $ | 349,712 | $ | (639,596 | ) | (182.89 | %) | ||||||
| Investing activities |
$ | (8,802,055 | ) | $ | (33,346 | ) | $ | (8,768,709 | ) | (26,296.13 | %) | |||||
| Financing activities |
$ | 11,041,124 | $ | (411,996 | ) | $ | 11,453,120 | 2,779.91 | % | |||||||
Operating Activities
During the 2012 period, our cash flows used in operating activities were $289,884, compared to cash flows from operating activities of $349,712 during the 2011 period. Operating cash flows were primarily impacted by the $651,058 decrease in net income due to the factors discussed in the Results of Operations section below, specifically the $918,491 increase in corporate general and administrative expenses associated with forming and operating the REIT, offset by approximately $106,280 of Funds from Operations (“FFO”), which is a non-GAAP measurement, contributed by the properties acquired in the fourth quarter and normal fluctuations in operations. See “Management’s Discussion and Analysis of Financial Condition and Results of Operations-Year Ended December 31, 2012 compared to the Year Ended December 31, 2011-Results of Operations-Funds from Operations.”
Investing Activities
During the 2012 period, our cash flows used in investing activities were $8.80 million, compared to cash flows used in investing activities of $33,346 during the 2011 period. The increase primarily related to the $8.80 million used to acquire investment properties in conjunction with ($5.99 million) and subsequent to ($2.81 million) the REIT formation
Financing Activities
During the 2012 period, our cash flows from financing activities were $11.04 million, compared to $411,996 of cash flows used in financing activities during the 2011 period. During the 2012 period, we received $13.37 million of net proceeds from our initial public offering and $494,000 of proceeds from the sale of preferred stock used to cover expenses related to our formation and the offering, compared to $505,000 of preferred stock proceeds for the 2011 period. Distributions to members were $126,084 and $281,395 during the 2012 and 2011 periods, respectively, with the decrease primarily related to us ceasing dividends during the second half of 2012 on REIT properties in anticipation of the formation transactions.
Mortgage indebtedness activity during the 2012 and 2011 periods included principal payments of $2.83 million and $214,494, respectively. The increase is primarily related to approximately $1.75 million being used to repay the Surrey Plaza property note contemporaneously with the acquisition, approximately $518,600 applied as a principal curtailment on the Monarch Bank building loan in conjunction with its loan modification and approximately $321,900 being used to repay the Amscot building note.
We intend to continue managing our debt prudently so as to maintain a conservative capital structure and minimize leverage within our company. As of December 31, 2012 and 2011, our debt balances consisted of the following:
| December 31, | ||||||||
| 2012 | 2011 | |||||||
| Fixed-rate mortgages |
$ | 31,843,503 | $ | 12,136,083 | ||||
|
|
|
|
|
|||||
27
The increase in total mortgage indebtedness at December 31, 2012 is primarily due to debt incurred during our formation in November 2012 and from acquisitions made during December 2012. The weighted average interest rate and term of our fixed-rate debt are 5.70% and 2.57 years, respectively, at December 31, 2012. We have $12.40 million of debt maturing during the 12 year ending December 31, 2013, comprised primarily of a $6.40 million fixed-rate loan for the Shops at TJ Maxx and a $2.10 million fixed-rate loan on the Riversedge Office Building, both of which mature in April 2013. We have received a commitment letter dated March 20, 2013 to refinance the Shoppes at TJ Maxx loan, subject to normal underwriting procedures. The terms include a 7 year maturity date and require monthly principal and interest payments based on a 25 year amortization and a 3.88% fixed interest rate. Additionally, a $3.90 million fixed-rate loan on The Shoppes at Eagle Harbor property matured in April 2012 and was extended until February 28, 2018 to accommodate the refinancing process. We have refinanced the Shoppes at Eagle Harbor loan for $4.0 million at a 4.34% fixed interest rate. The loan calls for monthly principal and interest payments of $24,692 based on a 20 year amortization and a maturity date of February 28, 2018. While we anticipate being able to refinance all the loans at reasonable market terms upon maturity, our inability to do so may materially impact our financial position and results of operations. See the financial statements included elsewhere in this Form 10-K for additional mortgage indebtedness details.
Future Liquidity Needs
The remaining $8.50 million in debt maturities, ongoing debt service and the $0.42 per share targeted dividend we intend to pay for the next 12 months represent the most significant factors outside of normal operating activities impacting cash flow over the year. Our success in refinancing the debt and executing on the acquisition strategy discussed below will dictate our liquidity needs going forward. If we are unable to execute in these areas, our ability to grow and pay future dividends may be limited without additional capital. Additionally, distributions paid in excess of earnings and profits may represent a return of capital for U.S. federal income tax purposes.
We believe significant opportunities exist in the current commercial real estate environment that will enable us to sufficiently leverage the funds received in the offering to fund planned distributions. Several factors are contributing to an increased supply in available properties for acquisition, including a significant level of maturities of commercial mortgage backed securities (“CMBS”) debt, strategic shifts by larger REITs to reduce debt levels and exit certain markets, and the negative impact on the real estate industry as a result of the economic downtown experienced over the past four years. We believe the public REIT model provides a unique growth vehicle whereby we can either acquire properties through traditional third party acquisitions using a combination of cash generated in the capital markets and debt financing; contributions of properties by third parties in exchange for common units issued by the Operating Partnership; and contributions of existing properties owned and managed by Mr. Wheeler and his affiliates in exchange for common units issued by the Operating Partnership. Additionally, access to public market capital enhances our ability to formulate acquisition structures and terms that better meet our growth strategies.
We envision acquiring properties during the next twelve months, consisting primarily of a blend of traditional acquisitions using equity capital provided by the offering and external financing, and property contributions in exchange for common units and debt assumption. Based on our knowledge of the property acquisition markets, there appears to be an ample inventory of properties available to enable us to meet our acquisition goals over the next twelve months, especially as it relates to those in the secondary and tertiary markets where we have historically excelled. Current cap rates in these markets have typically ranged from 8% to 10% and beyond. We believe that acquisitions at these price ranges, assuming a reasonable blend of traditional acquisition strategies and property contributions in exchange for common units and external debt financing, will produce excess cash flow sufficient to fund current and future dividends to our stockholders and common unit holders. We intend to aggressively pursue acquisitions that fit these parameters and that will generate sufficient cash flow to support our operating model. Since 1999, Jon S. Wheeler and his affiliates have acquired in excess of 60 properties. We believe our experience and success in acquiring and managing these properties will enable us to execute on our strategies.
In addition to liquidity required to fund debt payments, distributions and acquisitions, we may incur some level of capital expenditures during the year for the existing eleven properties that cannot be passed on to our tenants. The majority of these expenditures occur subsequent to acquiring a new property that requires significant improvements to maximize occupancy and lease rates, with an existing property that needs a facelift to improve its marketability or when tenant improvements are required to make a space fit a particular tenant’s needs.
28
Year Ended December 31, 2012 Compared to the Year Ended December 31, 2011
Results of Operations
The following table presents a comparison of the consolidated statements of operations for the years ended December 31, 2012 and 2011, respectively.
| For the Years Ended December 31, | Period Over Period Changes | |||||||||||||||
| 2012 | 2011 | $ | % | |||||||||||||
| REVENUE: |
||||||||||||||||
| Minimum rent |
$ | 1,954,321 | $ | 1,458,083 | $ | 496,238 | 34.03 | % | ||||||||
| Percentage of sales rent |
9,360 | 6,525 | 2,835 | 43.44 | % | |||||||||||
| Tenant reimbursements |
452,110 | 329,452 | 122,658 | 37.23 | % | |||||||||||
| Other income |
18,188 | 131,217 | (113,029 | ) | (86.14 | %) | ||||||||||
|
|
|
|
|
|
|
|
|
|||||||||
| Total Revenue |
2,433,979 | 1,925,277 | 508,702 | 26.42 | % | |||||||||||
|
|
|
|
|
|
|
|
|
|||||||||
| EXPENSES: |
||||||||||||||||
| Property operating |
311,042 | 352,508 | (41,466 | ) | (11.76 | %) | ||||||||||
| Real estate taxes |
134,301 | 104,555 | 29,746 | 28.45 | % | |||||||||||
| Repairs and maintenance |
73,877 | 63,253 | 10,624 | 16.80 | % | |||||||||||
|
|
|
|
|
|
|
|
|
|||||||||
| Total Property Operating Expenses |
519,220 | 520,316 | (1,096 | ) | (0.21 | %) | ||||||||||
|
|
|
|
|
|
|
|
|
|||||||||
| Depreciation and amortization |
822,152 | 744,931 | 77,221 | 10.37 | % | |||||||||||
| Provision for credit losses |
25,000 | 20,000 | 5,000 | 25.00 | % | |||||||||||
| Corporate general & administrative |
1,307,151 | 388,660 | 918,491 | 236.32 | % | |||||||||||
|
|
|
|
|
|
|
|
|
|||||||||
| Total Other Operating Expenses |
2,154,303 | 1,153,591 | 1,000,712 | 86.75 | % | |||||||||||
|
|
|
|
|
|
|
|
|
|||||||||
| Interest expense |
966,113 | 805,969 | 160,144 | 19.87 | % | |||||||||||
|
|
|
|
|
|
|
|
|
|||||||||
| Net Loss |
(1,205,657 | ) | (554,599 | ) | (651,058 | ) | (117.39 | %) | ||||||||
| Net loss attributable to noncontrolling interests |
(43,880 | ) | — | (43,880 | ) | N/A | ||||||||||
|
|
|
|
|
|
|
|
|
|||||||||
| Net Loss Attributable to Wheeler REIT |
$ | (1,161,777 | ) | $ | (554,599 | ) | $ | (607,178 | ) | (109.48 | %) | |||||
|
|
|
|
|
|
|
|
|
|||||||||
Same Store and New Store Operating Income
The following table provides same store and new store financial information. The discussion below focuses on same store results of operations since all our acquisitions (new stores) occurred during the fourth quarter of 2012 and there were no acquisitions during the 2011 period. Same store date includes the twelve month results of the following entities that were part of the original REIT formation transaction:
| • | The Shoppes at Eagle Harbor |
| • | Monarch Bank Building |
| • | Amscot Building |
| • | Riversedge North |
| • | Walnut Hill Plaza |
New store financial information reflects the activity from the acquisition date to year-end for the following entities:
| • | Lumber River Village (acquired November 16, 2012)) |
| • | Perimeter Square (acquired November 16, 2012) |
29
| • | Shoppes at TJ Maxx (acquired November 16, 2012) |
| • | Harps at Harbor Point (acquired December 14, 2012) |
| • | Twin City Crossing (acquired December 18, 2012) |
| • | Surrey Plaza (acquired December 21, 2012) |
| Year Ended December 31, | ||||||||||||||||||||||||
| Same Store | New Store | Total | ||||||||||||||||||||||
| 2012 | 2011 | 2012 | 2011 | 2012 | 2011 | |||||||||||||||||||
| Property revenues |
$ | 2,008,460 | $ | 1,925,277 | $ | 425,519 | $ | — | $ | 2,433,979 | $ | 1,925,277 | ||||||||||||
| Property expenses |
425,660 | 520,316 | 93,560 | — | 519,220 | 520,316 | ||||||||||||||||||
|
|
|
|
|
|
|
|
|
|
|
|
|
|||||||||||||
| Property Net Operating Income |
1,582,800 | 1,404,961 | 331,959 | — | 1,914,759 | 1,404,961 | ||||||||||||||||||
|
|
|
|
|
|
|
|
|
|
|
|
|
|||||||||||||
| Depreciation and amortization |
653,215 | 744,931 | 168,937 | — | 822,152 | 744,931 | ||||||||||||||||||
| Provision for credit losses |
— | 20,000 | 25,000 | — | 25,000 | 20,000 | ||||||||||||||||||
| Corporate general & administrative |
1,267,517 | 388,660 | 39,634 | — | 1,307,151 | 388,660 | ||||||||||||||||||
|
|
|
|
|
|
|
|
|
|
|
|
|
|||||||||||||
| Total Other Operating Expenses |
1,920,732 | 1,153,591 | 233,571 | — | 2,154,303 | 1,153,591 | ||||||||||||||||||
|
|
|
|
|
|
|
|
|
|
|
|
|
|||||||||||||
| Interest expense |
805,068 | 805,969 | 161,045 | — | 966,113 | 805,969 | ||||||||||||||||||
|
|
|
|
|
|
|
|
|
|
|
|
|
|||||||||||||
| Net Loss |
$ | (1,143,000 | ) | $ | (554,599 | ) | $ | (62,657 | ) | $ | — | $ | (1,205,657 | ) | $ | (554,599 | ) | |||||||
|
|
|
|
|
|
|
|
|
|
|
|
|
|||||||||||||
Property Revenues
Total same store property revenues for the 2012 period increased $83,183, or 4.32%, to $2.01 million, compared to $1.93 million for the 2011 period. Improvements in base rents, primarily at The Shoppes at Eagle Harbor and Walnut Hill Plaza, accounted for the majority of the increase, while higher tenant reimbursements also contributed to the increase. Excluding the impact of approximately $97,000 of non-recurring income items included in other income for the 2011 period, total revenues would have increased approximately 9.86%.
Rent revenues at The Shoppes at Eagle Harbor increased approximately $72,000, consisting of $36,000 in base rent increases and $36,000 related to straight-line rent amortization. The base rent increase was primarily due to the property being 100% lease for the entire 2012 period compared to being 100% leased for only six months during the 2011 period. Additionally, we benefited from a significant rent increase related to the expansion and subsequent stabilization of a large tenant at the property. Rent revenues at Walnut Hill Plaza increased approximately $68,000 for the 2012 period as compared to the 2011 period, consisting of $74,000 of base rent increases and a $6,000 negative impact due to straight-line rent amortization. The base rent increases were primarily due to contractual rent adjustments.
Same store tenant reimbursements increased $58,000, or 17.26%, during the 2012 period as compared to the 2011 period, primarily due to an increase of approximately $21,000 in the prior year CAM, tax and insurance reconciliation adjustments and an increase of approximately $43,000 in regular monthly reimbursement charges for the 2012 period versus the 2011 period.
The fourth quarter 2012 acquisitions (the new stores) contributed $425,519 of property revenues during the 2012 period which contributed to our total revenues increasing $508,702 to $2.43 million as compared to $1.93 million during the 2011 period. We estimate that property revenues for these new stores would have been approximately $4.0 million, excluding below market lease intangible amortization, during the year ending December 31, 2012 if the properties had been part of our portfolio for all of 2012.
Property Expenses
Total same store operating expenses for the 2012 period declined $94,656, or 18.19%, to $425,660, compared to $520,316 for the 2011 period. The 2011 period included approximately $65,000 of accounting, auditing and other professional fees related to preparing the properties for the REIT formation process. During the 2012 period and in future periods, the majority of these types of costs will be classified as corporate general and administrative expenses as they will primarily relate corporate overhead. Other factors effecting property expenses
30
included an $11,200 reduction in landscaping expenses, primarily at The Shoppes at Eagle Harbor and Walnut Hill Plaza, a $15,500 decrease in utility expenses, a $3,000 reduction in real estate taxes and a $4,000 reduction in repairs and maintenance expenses.
The Shoppes at Eagle Harbor was constructed during 2009 and Walnut Hill Plaza was significantly renovated in 2009, both processes resulting in a significant amount of landscaping being required. The decline in utilities expense occurred because the Riversedge property tenant began paying their utilities directly during 2012 as opposed to handling them through the CAM reimbursement process. Additionally, the 2011 utilities expense for The Shoppes at Eagle Harbor included prior period amounts due to a billing error by the utility company. The increases in real estate taxes and repairs and maintenance resulted from normal tax adjustments and fluctuations occurring during the year.
The new stores acquired incurred $93,560 of property expenses during the 2012 period which offset most of the decline in same store property expenses realized, resulting in our total property expenses remaining relatively flat at $519,220 as compared to $520,316 during the 2011 period. We estimate that property expenses for these new stores would have been approximately $900,000 during the year ending December 31, 2012 if the properties had been part of our portfolio on all of 2012.
Other Operating Expenses
Total same store other operating expenses increased $767,141 to $1.92 million during the 2012 period, primarily resulting from an $878,857 increase in corporate general and administrative expenses. The additional corporate general and administrative expenses were primarily associated with our REIT formation process that concluded in November 2012 and fees associated with the December property acquisitions. The REIT expenses consisted of professional fees, additional personnel and other required internal and external resources required to complete the formation of the REIT. Corporate general and administrative expenses will continue to be at a similar level as a result of operating a publicly traded company.
Same store depreciation and amortization expense for the 2012 period decreased $91,715, or 12.31%, resulting from more assets becoming fully depreciated and amortized. The same store provision for loan loss decreased $20,000 during the 2012 period. The 2011 period amount related to a specific receivable and all same store amounts outstanding are deemed collectible.
The new stores acquired incurred $233,571 of other operating expenses during the 2012 period which contributed to our total other operating expenses increasing $1.0 million to $2.15 million as compared to $1.15 million during the 2011 period. We estimate that other operating expenses for these new stores would have been approximately $2.4 million during the year ending December 31, 2012, primarily consisting of approximately $2.1 million of depreciation and amortization, if the properties had been part of our portfolio for all of 2012.
Same store interest expense remained flat at $805,068 during the 2012 period. Additional interest expense on the Amscot loan resulting from the property being refinanced during 2011 offset the impact of declining balances on outstanding debt. We estimate that interest expense for these new stores would have been approximately $1.19 million during the year ending December 31, 2012 if the properties had been part of our portfolio for all of 2012.
31
Funds from Operations
Below is a comparison of same store FFO, which is a non-GAAP measurement, for the year ended December 31, 2012 and 2011:
| Years Ended December 31, | ||||||||||||||||||||||||||||||||
| Same Stores | New Stores | Total | Period Over Period Changes |
|||||||||||||||||||||||||||||
| 2012 | 2011 | 2012 | 2011 | 2012 | 2011 | $ | % | |||||||||||||||||||||||||
| Net income (loss) |
$ | (1,143,000 | ) | $ | (554,599 | ) | $ | (62,657 | ) | $ | — | $ | (1,205,657 | ) | $ | (554,599 | ) | $ | (651,058 | ) | (117.39 | %) | ||||||||||
| Depreciation of real estate assets |
653,215 | 744,931 | 168,937 | — | 822,152 | 744,931 | 77,221 | 10.37 | % | |||||||||||||||||||||||
|
|
|
|
|
|
|
|
|
|
|
|
|
|
|
|
|
|||||||||||||||||
| Total FFO |
$ | (489,785 | ) | $ | 190,332 | $ | 106,280 | $ | — | $ | (383,505 | ) | $ | 190,332 | $ | (573,837 | ) | (301.49 | %) | |||||||||||||
|
|
|
|
|
|
|
|
|
|
|
|
|
|
|
|
|
|||||||||||||||||
During the 2012 period, FFO decreased $573,837 as compared to the 2011 period. The primary factors impacting FFO included the $878,857 increase in same store corporate general and administrative expenses which was partially offset by the $177,839 increase in same store property net operating income and the $106,280 of FFO contributed by the properties acquired during the fourth quarter of 2012. We estimate that these new stores would have generated approximately $1.6 million in total FFO during the year ending December 31, 2012 if the properties had been part of our portfolio for all of 2012.
Off-Balance Sheet Arrangements
As of December 31, 2012, we were not involved in any significant off-balance sheet arrangements that are likely to have a material effect on our financial condition, revenues or expenses, results of operations, liquidity, capital resources or capital expenditures.
New Accounting Pronouncements
In July 2012, the FASB issued Accounting Standards Update, or ASU, 2012-02 “Impairment Goodwill and Other (Topic 350).” This amendment would give us the option to first assess qualitative factors to determine whether the existence of an event or circumstance indicates that it is more likely than not that intangible assets are impaired before having to determine the fair value using the current quantitative approach. This ASU is effective for annual and interim goodwill impairment tests performed for fiscal years beginning after September 15, 2012, early adoption permitted. We adopted this ASU during the year ended December 31, 2012. We evaluate intangibles for impairment annually unless factors arise that would create the need to perform an evaluation during interim periods. For the year ended December 31, 2012, there were no factors that indicated any impairment.
| Item 7A. | Quantitative and Qualitative Disclosures About Market Risk. |
Not applicable.
| Item 8. | Financial Statements and Supplementary Data |
The information required by this Item 8 is incorporated by reference to our Financial Statements beginning on page F-1 of this Annual Report on Form 10-K.
| Item 9. | Changes in and Disagreements with Accountants on Accounting and Financial Disclosure |
Not applicable.
32
| Item 9A. | Controls and Procedures. |
Evaluation of Disclosure Controls and Procedures
Our management, under the supervision and with the participation of our principal executive and financial officer, has evaluated the effectiveness of our disclosure controls and procedures in ensuring that the information required to be disclosed in our filings under the Securities Exchange Act of 1934, as amended, is recorded, processed, summarized and reported within the time periods specified in the SEC’s rules and forms, including ensuring that such information is accumulated and communicated to our company’s management, as appropriate, to allow timely decisions regarding required disclosure. Based on such evaluation, our principal executive and financial officer have concluded that such disclosure controls and procedures were effective as of December 31, 2012 (the end of the period covered by this Annual Report).
Changes in Internal Control Over Financial Reporting
During the fiscal quarter ended December 31, 2012, there were no changes in our internal control over financial reporting that have materially affected, or are reasonably likely to materially affect, our internal control over financial reporting.
| Item 9B. | Other Information |
None.
| Item 10. | Directors, Executive Officers and Corporate Governance |
Our Directors and Executive Officers
Our board of directors consists of seven members, including a majority of directors who are independent within the meaning of the listing standards of the Nasdaq Capital Market. Pursuant to our charter, each of our directors will be elected by our stockholders to serve until the next annual meeting of our stockholders and until his or her successor is duly elected and qualifies. Subject to rights pursuant to any employment agreements, officers serve at the pleasure of our board of directors.
The following table sets forth certain information concerning our directors, executive officers and certain other officers:
| Name | Age | Position | ||
| Jon S. Wheeler |
52 | Chairman, Chief Executive Officer and Director | ||
| Steven M. Belote |
47 | Chief Financial Officer | ||
| Robin Hanisch |
55 | Secretary | ||
| Christopher J. Ettel |
53 | Director | ||
| David Kelly |
48 | Director | ||
| William W. King |
73 | Director | ||
| Sanjay Madhu |
46 | Director | ||
| John McAuliffe |
58 | Director | ||
| Ann L. McKinney |
64 | Director |
Biographical Summaries of Directors and Executive Officers
The following are biographical summaries of the experience of our directors, executive officers and certain other officers.
Jon S. Wheeler has served as our Chairman since our formation in June of 2011. In addition, Mr. Wheeler served as our President from our formation until January 2013 when his title was changed from President to Chief Executive Officer. Mr. Wheeler has also served as the President and CEO of Wheeler Interests since its inception in 1999. Mr. Wheeler has several years of experience as a real estate executive with an extensive background in strategic financial and market analyses and assessments of new or existing properties to maximize returns, which are then positioned for acquisition, growth and disposition. Since founding Wheeler Interests in 1999, Mr. Wheeler has
33
helped Wheeler Interests to acquire over sixty shopping centers in New York, Maryland, Virginia, West Virginia, North Carolina, South Carolina, Tennessee, Georgia, Florida, Oklahoma and Texas, representing over four million square feet of improved real estate property. Mr. Wheeler holds a B.A. degree in political science from Southern Methodist University. Mr. Wheeler was selected as our Chairman because of his experience in retail leasing, marketing, acquisition, development, financing, management and disposition of strip centers, neighborhood centers, community centers, power centers and mixed-use retail space in both the urban and suburban markets within the Northeast, Mid-Atlantic, Southeast and Southwest regions of the United States.
Steven M. Belote, a Certified Public Accountant, has served as our Chief Financial Officer (CFO) since August 2011. After receiving a Bachelor’s of Science Degree in Accounting from Virginia Tech University, he spent seven years working in Washington, DC with BDO Seidman, LLP, a large international public accounting and consulting firm. In June 1995, he joined Shore Bank as their CFO, subsequently playing a significant role in taking the bank public in 1997. Mr. Belote served as CFO for the bank’s publicly-traded bank holding company, Shore Financial Corporation, until the company was purchased in June 2008. Mr. Belote continued as the bank’s CFO until becoming its president in June 2009; a role he held until December 2010. Mr. Belote has been affiliated with and held various roles in many organizations, including: the Melfa Rotary Club from 2006-2010, serving as the club’s president from 2008-2009; the Eastern Shore of Virginia Chamber of Commerce Board of Directors from 2004-2010, serving as treasurer from 2009-2010; the Eastern Shore of Virginia United Way from 2000-2008, serving as campaign chair during 2000 and serving on the board of directors from 2001-2008, including the role of president from 2004-2006; the Virginia Bankers Association CFO Committee from 1999-2009, serving as chair from 2003-2006; a member of the Maryland Financial Bank advisory board from 2005-present; and as a member of the Bay Beyond, Inc. (Blue Crab Bay Co.) advisory board from 1997 through 2005, among others.
Robin A. Hanisch has served as the Secretary of our Board of Directors since August 2011. Ms. Hanisch has served as an Associate at Wheeler Interests since 2000, where she oversees Human Resources and Investor Relations. Ms. Hanisch has been the main point of contact for investors in Wheeler Interests and will serve as the main point of contact for our investors. Prior to joining Wheeler Interests, Ms. Hanisch worked in fund development and marketing for a national non-profit organization. She graduated from the University of Hawaii with a degree in merchandising.
Christopher J. Ettel serves as a director of our company. In 1988, Mr. Ettel founded VB Homes, LLC, a residential design-build firm, specializing in high quality residential renovations and additions as well as new construction. Mr. Ettel has served as the Managing Partner of VB Homes, LLC since its inception. Mr. Ettel has been a Virginia Real Estate Broker since 1990. He currently serves on the Board of Directors of the Tidewater Builders Association and the Virginia Beach Advisory Board of Monarch Bank. He also previously served as the Chairman of the Tidewater Builders Association Remodeler’s Council and the President of the Board for the Virginia Beach Public Schools Education Foundation. Mr. Ettel received his Bachelor of Science degree from James Madison University in 1982. Mr. Ettel was selected as a director because of his years of experience in the real estate and construction industries as well as his management experience.
David Kelly serves as a director of our company. Mr. Kelly has over twenty five years of experience in the real estate industry. Mr. Kelly currently serves as a Principal with Kelly Development, LLC, a real estate development firm he founded in March 2011, which specializes in the acquisition and management of retail properties in the Mid-Atlantic region. Prior to founding Kelly Development, Mr. Kelly served as the Director of Real Estate for Supervalu, Inc., a Fortune 100 supermarket retailer, from 1998 through 2011. Prior to his time with Supervalu, Mr. Kelly served as an Asset Manager from 1993 through 1998. Mr. Kelly currently serves on the Board of Directors of the Norfolk, Virginia SPCA. He earned a Bachelor of Science in Finance degree from Bentley College (now Bentley University). Mr. Kelly was selected as a director because of his years of experience in the real estate industry as well as his real estate management experience within a publicly traded company.
William W. King serves as a director of our company. Mr. King currently serves, on a volunteer basis, as Executive Director of the Virginia Maritime Heritage Foundation, a 501(c)(3) corporation that owns and operates the schooner Virginia. He was appointed to that position in September of 2009. From 1988 through 2008 Mr. King served as the headmaster of Norfolk Collegiate School, an independent, co-educational, K-12 college preparatory day school. He also remained employed by the Norfolk Collegiate School until June 2009 as a special assistant to the headmaster and served on its board of trustees from 1984-2009. Prior to his service at Norfolk Collegiate School, Mr. King was Executive Vice President of SRMS, a management consulting corporation that primarily contracted for services with the U.S. Navy and the U.S. Air Force. Mr. King served in the United States Navy from 1962 until 1984, when he
34
retired in the grade of Captain. During his time in the United States Navy, he served in seven combatant ships, two of which he commanded, did several combat tours in Vietnam, served two tours in the Pentagon, including two years as aide to the Chief of Naval Operations, and was a Deputy Chief of Staff to the Commander of the United States Atlantic Command and the Commander-in-Chief of the United States Atlantic Fleet. Mr. King graduated from the University of Virginia in 1963 with a Bachelor of Science Degree in Finance, the Navy Postgraduate School in 1977 with a Master of Science in Financial Management, and from Old Dominion University in 1995 with a Certificate of Advanced Studies in Education Leadership and Administration. He currently serves on the Board of Directors of Chesapeake Bay Academy, the Future of Hampton Roads, Inc. and Horizons Hampton Roads. Mr. King was selected as a director because of his leadership experience.
Sanjay Madhu serves as a director of our company. Mr. Madhu has, since May 2007, served as a director of Homeowners Choice, Inc. a NASDAQ-listed insurance holding company headquartered in Tampa, Florida. He became an executive officer of Homeowners Choice in February 2008 and as such has served in various capacities, including vice president of marketing, vice president of investor relations, and president of real estate operations. In July 2011, he relinquished his role as vice president of marketing and took on the role of president of real estate operations. He continues to serve as vice president of investor relations. Mr. Madhu is the principal of two companies that own and operate commercial real estate in the Tampa Florida area. Since 2002, he has served president of 5th Avenue Group LC and, since 1999, he has served as president of Forrest Terrace LC. From 1995 to 2010, Mr. Madhu served as president of J&S Development Group, Inc., doing business as The Mortgage Corporation Network, which was a correspondent mortgage lender. From 1994 to 1996, he was vice president, mortgage division, First Trust Mortgage & Finance; from 1993 to 1994, he was vice president, residential first mortgage division, Continental Management Associates Limited, Inc.; and from 1991 to 1993; he was president, S&S Development, Inc. Mr. Madhu attended Northwest Missouri State University, where he studied marketing and management. Mr. Madhu was selected as a director because of his years of executive management experience and his experience managing a public company.
John McAuliffe serves as a director of our company. Since May 2012, Mr. McAuliffe has served as the managing director of investment banking of Newbridge Securities Corp. Mr. McAuliffe was a senior banker at Financial West Securities from September 2010 through December 2011. From 2005 to 2010, Mr. McAuliffe served as a Managing Director of the Investment Banking Department of Newbridge Securities Corp. During this time, he was the lead banker and finder for Nexcera Medical, and the banker and finder of Chemrx Corp. Mr. McAuliffe was also the lead banker for Able Labs, M-Systems, U.S.Teleconstructors, MRV Communications and Videospection. From 1990 to 2000, Mr. McAuliffe was a head of Institutional Sales and branch manager of H.J. Meyers. From 1990 until 1998 H.J. Meyers did over $1 billion in financing primarily for technology and biotechnology companies whose road shows were led by Mr. McAuliffe. Since 1990, Mr. McAuliffe has been an investment banker, and has participated and led in excess of 200 financing transactions in his career. Mr. McAuliffe earned his Bachelor of Science degree from the State University of New York at Brockport. Mr. McAuliffe was chosen as a director nominee because of his extensive experience in corporate financing. Mr. McAuliffe serves as a director of Tri-Tech Holding, Inc., a Nasdaq-listed business focusing on water resource management and environmental protection.
Ann L. McKinney serves as a director of our company. Ms. McKinney was appointed President and Principal Broker of Wheeler Real Estate Company upon its formation in March, 2000. First licensed in 1974, Ms. McKinney currently holds a Real Estate Broker’s license in Virginia, North Carolina, South Carolina, Florida, Mississippi, Alabama, Oklahoma and Tennessee. Her responsibilities with Wheeler Real Estate Company include dispositions, marketing and public relations, and the management of all real estate licenses. Ms. McKinney was chosen as a director because of her leadership and management expertise.
Corporate Governance Profile
Our board consists of seven directors, five of whom are independent as determined in accordance with the listing standards established by the Nasdaq Capital Market, and our board will make an affirmative determination as to the independence of each of our directors on an annual basis. We will also adopt a code of business ethics and corporate governance principles.
Role of the Board in Risk Oversight
One of the key functions of our board of directors is informed oversight of our risk management process. Our board of directors administers this oversight function directly, with support from its three standing committees,
35
the audit committee, the nominating and corporate governance committee and the compensation committee, each of which addresses risks specific to their respective areas of oversight. In particular, our audit committee has the responsibility to consider and discuss our major financial risk exposures and the steps our management has taken to monitor and control these exposures, including guidelines and policies to govern the process by which risk assessment and management is undertaken. The audit committee also monitors compliance with legal and regulatory requirements, in addition to oversight of the performance of our internal audit function. Our nominating and corporate governance committee monitors the effectiveness of our corporate governance guidelines, including whether they are successful in preventing illegal or improper liability-creating conduct. Our compensation committee assesses and monitors whether any of our compensation policies and programs has the potential to encourage excessive risk-taking.
Board Committees
Our board of directors has established three standing committees: an audit committee, a compensation committee and a nominating and corporate governance committee. The principal functions of each committee are briefly described below. Each of these committees is comprised exclusively of independent directors. Additionally, our board of directors may from time to time establish certain other committees to facilitate the management of our company.
Audit Committee
Our audit committee consists of three of our independent directors: Jon McAuliffe, William W. King and Sanjay Madhu. Mr. McAuliffe, the chairman of our audit committee, qualifies as an “audit committee financial expert” as that term is defined by the applicable SEC regulations and Nasdaq Capital Market corporate governance requirements. In addition, each of the audit committee members is “financially sophisticated” as that term is defined by the Nasdaq Capital Market corporate governance requirements. The audit committee has adopted a charter which details the principal functions of the audit committee, including oversight related to:
| • | our accounting and financial reporting processes; |
| • | the integrity of our consolidated financial statements and financial reporting process; |
| • | our systems of disclosure controls and procedures and internal control over financial reporting; |
| • | our compliance with financial, legal and regulatory requirements; |
| • | the evaluation of the qualifications, independence and performance of our independent registered public accounting firm; |
| • | the performance of our internal audit function; and |
| • | our overall risk profile. |
The audit committee is also be responsible for engaging an independent registered public accounting firm, reviewing with the independent registered public accounting firm the plans and results of the audit engagement, approving professional services provided by the independent registered public accounting firm, including all audit and non-audit services, reviewing the independence of the independent registered public accounting firm, considering the range of audit and non-audit fees and reviewing the adequacy of our internal accounting controls. The audit committee also prepares the audit committee report required by SEC regulations to be included in our annual proxy statement. As we only recently became a publicly-reporting company, the Audit Committee did not meet in 2012.
Compensation Committee
Our compensation committee consists of three of our independent directors: Christopher J. Ettel, William W. King and David Kelly. The Compensation Committee has adopted a charter which details the principal functions of the compensation committee, including:
| • | reviewing and approving on an annual basis the corporate goals and objectives relevant to our executive officers’ compensation, evaluating our executive officers’ performance in light of such goals and objectives and determining and approving the remuneration of our executive officers based on such evaluation; |
| • | reviewing and approving the compensation, if any, of all of our other officers; |
| • | reviewing our executive compensation policies and plans; |
| • | implementing and administering our incentive compensation equity-based remuneration plans; |
36
| • | assisting management in complying with our proxy statement and annual report disclosure requirements; |
| • | producing a report on executive compensation to be included in our annual proxy statement; and |
| • | reviewing, evaluating and recommending changes, if appropriate, to the remuneration for directors. |
Mr. Kelly has been designated as chair of the Compensation Committee and Christopher J. Ettel and William W. King have been appointed as members of the compensation committee. As we only recently became a publicly-reporting company, the Compensation Committee did not meet in 2012.
Nominating and Corporate Governance Committee
Our nominating and corporate governance committee consists of three of our independent directors: Sanjay Madhu, William W. King and Christopher J. Ettel. The Nominating and Corporate Governance Committee has adopted a committee charter which details the principal functions of the nominating and corporate governance committee, including:
| • | identifying and recommending to the full board of directors qualified candidates for election as directors and recommending nominees for election as directors at the annual meeting of stockholders; |
| • | developing and recommending to the board of directors corporate governance guidelines and implementing and monitoring such guidelines; |
| • | reviewing and making recommendations on matters involving the general operation of the board of directors, including board size and composition, and committee composition and structure; |
| • | recommending to the board of directors nominees for each committee of the board of directors; |
| • | annually facilitating the assessment of the board of directors’ performance as a whole and of the individual directors, as required by applicable law, regulations and the Nasdaq Capital Market corporate governance requirements; and |
| • | overseeing the board of directors’ evaluation of management. |
In identifying and recommending nominees for directors, the nominating and corporate governance committee may consider diversity of relevant experience, expertise and background. Mr. Madhu has been designated as chair of this committee. As we only recently became a publicly-reporting company, the Nominating and Corporate Governance Committee did not meet in 2012.
Section 16(a) Beneficial Ownership Reporting Compliance
Based solely on a review of Forms 3 and 4 and any amendments thereto furnished us pursuant to Rule 16a-3(e) under the Securities Exchange Act of 1934, or representations that no Forms 5 were required, we believe that with respect to fiscal 2012 our officers, directors, and beneficial owners of more than 10% of our equity timely complied with all applicable Section 16(a) filing requirements.
Code of Business Conduct and Ethics
Our board of directors has established a code of business conduct and ethics that applies to our officers, directors and employees. Among other matters, our code of business conduct and ethics is designed to deter wrongdoing and to promote:
| • | honest and ethical conduct, including the ethical handling of actual or apparent conflicts of interest between personal and professional relationships; |
| • | full, fair, accurate, timely and understandable disclosure in our SEC reports and other public communications; |
| • | compliance with laws, rules and regulations; |
| • | prompt internal reporting of violations of the code to appropriate persons identified in the code; and |
| • | accountability for adherence to the code of business conduct and ethics. |
Any waiver of the code of business conduct and ethics for our executive officers or directors must be approved by a majority of our independent directors, and any such waiver shall be promptly disclosed as required by law or Nasdaq Capital Market regulations. Copies of our code of business conduct and ethics are available without charge on our website, www.whlr.us or by writing or calling Robin Hanisch, Secretary, Wheeler Real Estate Investment Trust, Inc., 2529 Virginia Beach, Virginia 23452, (757) 627-9088.
37
Limitation of Liability and Indemnification
We have entered into indemnification agreements with each of our directors and executive officers that obligate us, if a director or executive officer is or is threatened to be made a party to any proceeding by reason of such director’s or executive officer’s status as a present or former director, officer, employee or agent of our company or as a director, trustee, officer, partner, manager, managing member, fiduciary, employee or agent of another enterprise that the director or executive officer served in such capacity at our request, to indemnify such director or executive officer, and advance expenses actually and reasonably incurred by him or her, or on his or her behalf, unless it has been established that:
| • | the act or omission of the director or executive officer was material to the matter giving rise to the proceeding and was committed in bad faith or was the result of active and deliberate dishonesty; |
| • | the director or executive officer actually received an improper personal benefit in money, property or services; or |
| • | with respect to any criminal action or proceeding, the director or executive officer had reasonable cause to believe his or her conduct was unlawful. |
In addition, except as described below, our directors and executive officers are not entitled to indemnification pursuant to the indemnification agreement:
| • | if the proceeding was one brought by us or in our right and the director or executive officer is adjudged to be liable to us; |
| • | if the director or executive officer is adjudged to be liable on the basis that personal benefit was improperly received in a proceeding charging improper personal benefit to the director or executive officer; or |
| • | in any proceeding brought by the director or executive officer other than to enforce his or her rights under the indemnification agreement, and then only to the extent provided by the agreement, and except as may be expressly provided in our charter, our bylaws, a resolution of our board of directors or of our stockholders entitled to vote generally in the election of directors or an agreement approved by our board of directors. |
Notwithstanding the limitations on indemnification described above, on application by a director or executive officer of our company to a court of appropriate jurisdiction, the court may order indemnification of such director or executive officer if the court determines that such director or executive officer is fairly and reasonably entitled to indemnification in view of all the relevant circumstances, whether or not the director or executive officer (1) has met the standards of conduct set forth above or (2) has been adjudged liable for receipt of an “improper personal benefit”; however, our indemnification obligations to such director or executive officer will be limited to the expenses actually and reasonably incurred by him or her, or on his or her behalf, in connection with any proceeding by or in the right of our company or in which the officer or director shall have been adjudged liable for receipt of an improper personal benefit. If the court determines the director or executive officer is so entitled to indemnification, the director or executive officer will also be entitled to recover from us the expenses of securing such indemnification.
Notwithstanding, and without limiting, any other provisions of the indemnification agreements, if a director or executive officer is or is threatened to be made a party to any proceeding by reason of such director’s or executive officer’s status as a director, officer, employee or agent of our company or as a director, trustee, officer, partner, manager, managing member, fiduciary, employee or agent of another entity that the director or executive officer served in such capacity at our request, and such director or executive officer is successful, on the merits or otherwise, as to one or more (even if less than all) claims, issues or matters in such proceeding, we must indemnify such director or executive officer for all expenses actually and reasonably incurred by him or her, or on his or her behalf, in connection with each successfully resolved claim, issue or matter, including any claim, issue or matter in such a proceeding that is terminated by dismissal, with or without prejudice.
In addition, the indemnification agreements require us to advance reasonable expenses incurred by the indemnitee within ten days of the receipt by us of a statement from the indemnitee requesting the advance, provided the statement evidences the expenses and is accompanied by:
| • | a written affirmation of the indemnitee’s good faith belief that he or she has met the standard of conduct necessary for indemnification; and |
| • | a written undertaking to reimburse us if a court of competent jurisdiction determines that the director or executive officer is not entitled to indemnification. |
38
The indemnification agreements also provide for procedures for the determination of entitlement to indemnification, including a requirement that such determination be made by independent counsel after a change of control of us.
Our charter permits us and our bylaws obligate us, to the maximum extent permitted by Maryland law, to indemnify and to pay or reimburse reasonable expenses in advance of final disposition of a proceeding to (1) any of our present or former directors or officers who is made or threatened to be made a party to the proceeding by reason of his service in that capacity or (2) any individual who, while serving as our director or officer and at our request, serves or has served as a director, officer, partner, trustee, member or manager of another corporation, real estate investment trust, limited liability company, partnership, joint venture, trust, employee benefit plan or other enterprise, and who is made or threatened to be made a party to the proceeding by reason of his service in that capacity.
Generally, Maryland law permits a Maryland corporation to indemnify its present and former directors and officers except in instances where the person seeking indemnification acted in bad faith or with active and deliberate dishonesty, actually received an improper personal benefit in money, property or services or, in the case of a criminal proceeding, had reasonable cause to believe that his or her actions were unlawful. Under Maryland law, a Maryland corporation also may not indemnify a director or officer in a suit by or in the right of the corporation in which the director or officer was adjudged liable to the corporation or for a judgment of liability on the basis that a personal benefit was improperly received. A court may order indemnification if it determines that the director or officer is fairly and reasonably entitled to indemnification, even though the director or officer did not meet the prescribed standard of conduct; however, indemnification for an adverse judgment in a suit by us or in our right, or for a judgment of liability on the basis that personal benefit was improperly received, is limited to expenses.
Insofar as indemnification for liabilities arising under the Securities Act may be permitted to directors, officers or persons controlling our company pursuant to the foregoing provisions, we have been informed that, in the opinion of the SEC, such indemnification is against public policy as expressed in the Securities Act and is therefore unenforceable.
| Item 11. | Executive Compensation |
Our Compensation Committee compensation policies are based on factors such as the desire to retain our named executive officers’ services over the long term, aligning their interests with those of our stockholders, incentivizing them over the near, medium and long term, rewarding them for exceptional performance and such other factors as our compensation committee may consider in shaping its compensation philosophy. Our compensation strategy focuses on providing a total compensation package that will not only attract and retain high-caliber executive officers, but will also be utilized as a tool to align employee contributions with our corporate objectives and stockholder interests. We aim to provide a competitive total compensation package and will share our success with our executive officers when our objectives are met.
The following is a non-exhaustive list of items that our compensation committee considers in applying our compensation philosophy to the implementation of our overall compensation program for executive officers:
| • | goals of the compensation program; |
| • | role of our compensation committee; |
| • | engagement and role(s) of an external compensation consultant and other advisors; |
| • | involvement of management in compensation decisions; |
| • | components of compensation, including equity, cash, incentive, fixed, short-, medium- and long-term compensation, and the interaction of these various components with one another; |
| • | equity grant guidelines with regard to timing, type, vesting and other terms and conditions of equity grants; |
| • | stock ownership guidelines and their role in aligning the interests of named executive officers with our stockholders; |
| • | severance and change of control protections; |
| • | perquisites, enhanced benefits and insurance; |
39
| • | deferred compensation and other tax-efficient compensation programs; |
| • | retirement and other savings programs; |
| • | peer compensation, benchmarking and survey data; and |
| • | risk mitigation and related protective and remedial measures. |
Employment Agreements
Generally
We have entered into employment agreements with each of our executive officers. We believe that the protections contained in these employment agreements help to ensure the day-to-day stability necessary to our executives to enable them to properly focus their attention on their duties and responsibilities with the company and provide security with regard to some of the most uncertain events relating to continued employment, thereby limiting concern and uncertainty and promoting productivity. Each of our employment agreements with our executive officers provides for an initial term of one year. Upon a termination of employment by reason of death or disability, such terminated executive officer or his estate will be entitled to regular base salary payments for a period of two (2) months. Such employment agreements also contain customary confidentiality and non-solicitation provisions. The following is a summary of the material terms of the agreements.
Jon S. Wheeler
Under the terms of Mr. Wheeler’s employment agreement, Mr. Wheeler is required to devote his best efforts and a significant portion of his time to our business and affairs and in return will be entitled to the following:
| • | Base compensation of $18,750 per month, which is paid by our Administrative Service Company. |
| • | Reimbursement of reasonable expenses including but not limited to cell phone, mileage, toll and travel expenses, as well as travel expenses necessary to enhance Mr. Wheeler’s skills and visibility in the real estate industry. |
| • | Various benefits equal to the benefits provided to similar situated employees of the Services Companies. |
Under Mr. Wheeler’s employment agreement, if he is terminated without “cause” (as defined in the employment agreement) then, in addition to accrued amounts, Mr. Wheeler shall be entitled to his regular base salary payable in regular periodic installments (i) for a period of twenty-six (26) weeks, if during the initial term of the employment agreement, or (ii) a period of eight (8) weeks if the initial term of the employment agreement has been completed.
If Mr. Wheeler is terminated for “cause” (as defined in his employment agreement), Mr. Wheeler shall be entitled to receive any base salary earned and benefits accrued as of the date of his termination, and our company shall have no further obligation to Mr. Wheeler.
Steven M. Belote
Under the terms of Mr. Belote’s employment agreement, Mr. Belote is required to devote his best efforts and a significant portion of his time to our business and affairs and in return will be entitled to the following:
| • | Mr. Belote’s base compensation is $12,000 per month, which is paid by our Administrative Service Company. |
| • | Reimbursement of reasonable expenses including but not limited to cell phone, mileage, toll and travel expenses, as well as travel expenses necessary to enhance Mr. Belote’s skills and visibility in the real estate industry. |
| • | Various benefits equal to the benefits provided to similar situated employees of the Services Companies, not to include healthcare. |
Under Mr. Belote’s employment agreement, if he is terminated without “cause” (as defined in the employment agreement) then, in addition to accrued amounts, Mr. Belote shall be entitled to his regular base salary payable in regular periodic installments (i) for a period of twenty-six (26) weeks, if during the initial term of the employment agreement, or (ii) a period of eight (8) weeks if the initial term of the employment agreement has been completed.
40
If Mr. Belote is terminated for “cause” as defined in his employment agreement, Mr. Belote shall be entitled to receive any base salary earned and benefits accrued as of the date of his termination, and our company shall have no further obligation to Mr. Belote.
Robin Hanisch
Under the terms of Ms. Hanisch’s employment agreement, Ms. Hanisch is required to devote her best efforts and a significant portion of her time to our business and affairs and in return will be entitled to the following:
| • | Base compensation of $1,250 per month, which will be paid by our Administrative Service Company. |
| • | Reimbursement of reasonable expenses including but not limited to cell phone, mileage, toll and travel expenses, as well as travel expenses necessary to enhance Ms. Hanisch’s skills and visibility in the real estate industry. |
| • | Various benefits equal to the benefits provided to similar situated employees of the Services Companies, not to include healthcare. |
Under Ms. Hanisch’s employment agreement, if she is terminated without “cause” (as defined in the employment agreement) then, in addition to accrued amounts, Ms. Hanisch shall be entitled to her regular base salary payable in regular periodic installments (i) for a period of twenty-six (26) weeks, if during the initial term of the employment agreement, or (ii) a period of eight (8) weeks if the initial term of the employment agreement has been completed. If Ms. Hanisch is terminated for “cause” as defined in her employment agreement, Ms. Hanisch shall be entitled to receive any base salary earned and benefits accrued as of the date of his termination, and our company shall have no further obligation to Ms. Hanisch.
Share Incentive Plan
Pursuant to our 2012 Share Incentive Plan, we may award incentives covering our aggregate of 500,000 shares of our common stock. The options will vest at a rate of 20% per year for five years and have a per share exercise price equal to the fair market value of one of our common shares on the date of grant. We have not yet determined the recipients of any such grants.
Compensation Committee Interlocks and Insider Participation
None of our executive officers serves as a member of a board of directors or compensation committee, or other committee serving an equivalent function, of any other entity that has one or more of its executive officers serving as a member of our board of directors or compensation committee.
Compensation Tables
Summary Compensation Table
We did not conduct business in 2010 and, accordingly, we did not pay any compensation during or in respect of that year. Additionally, our executive officers are compensated by our Administrative Service Company. Because we have no 2010 compensation to report, the table below only shows compensation received by our Chief Executive Officer and Chief Financial Officer in 2011 and 2012. No other officers received compensation in excess of $100,000 in any year.
| Name and Principal Position |
Fiscal Year |
Salary ($) | Bonus | Stock Awards |
Option Awards |
Non-Equity Incentive Plan Compensation |
All Other Compensation |
Total ($) | ||||||||||||||||||||||||
| Jon S. Wheeler |
2012 | 225,000 | — | — | — | — | — | 225,000 | ||||||||||||||||||||||||
| Principal Executive Officer |
2011 | 98,147 | — | — | — | — | — | 98,147 | ||||||||||||||||||||||||
| Steven M. Belote |
2012 | 121,846 | — | — | — | — | — | 121,846 | ||||||||||||||||||||||||
| Chief Financial Officer |
2011 | 46,154 | — | — | — | — | — | 46,154 | ||||||||||||||||||||||||
Director Compensation
Employee directors do not receive any compensation for their services. Non-employee directors are entitled to receive $15,000 per year for serving as directors and may receive option grants from our company. We intend to reimburse each of our directors for his or her travel expenses incurred in connection with his or her attendance at full board of directors and committee meetings. We did not make any payments to any of our non-employee directors in 2012.
41
| Item 12. | Security Ownership of Certain Beneficial Owners and Management and Related Shareholder Matters |
The following table sets forth certain information regarding the beneficial ownership of shares of our common stock and shares of common stock into which common units are exchangeable for (1) each person who is the beneficial owner of 5% or more of our outstanding common stock, (2) each of our directors and named executive officers, and (3) all of our directors and executive officers as a group. Each person named in the table has sole voting and investment power with respect to all of the shares of our common stock shown as beneficially owned by such person, except as otherwise set forth in the notes to the table. The extent to which a person will hold shares of common stock as opposed to units is set forth in the footnotes below.
The SEC has defined “beneficial ownership” of a security to mean the possession, directly or indirectly, of voting power and/or investment power over such security. A stockholder is also deemed to be, as of any date, the beneficial owner of all securities that such stockholder has the right to acquire within 60 days after that date through (1) the exercise of any option, warrant or right, (2) the conversion of a security, (3) the power to revoke a trust, discretionary account or similar arrangement or (4) the automatic termination of a trust, discretionary account or similar arrangement. In computing the number of shares beneficially owned by a person and the percentage ownership of that person, common shares subject to options or other rights (as set forth above) held by that person that are exercisable as of this filing or will become exercisable within 60 days thereafter, are deemed outstanding, while such shares are not deemed outstanding for purposes of computing percentage ownership of any other person. As of March 22, 2013, we had 29 stockholders of record. This number excludes our common shares owned by shareholders holding under nominee security position listings.
Unless otherwise indicated, the address of each named person is c/o Wheeler Real Estate Investment Trust, Inc., Riversedge North, 2529 Virginia Beach Blvd., Suite 200, Virginia Beach, Virginia 23452. No shares beneficially owned by any executive officer, director or director nominee have been pledged as security.
| Number of Shares and Common Units Beneficially Owned |
Percentage of All Shares(1) |
Percentage of All Shares and Common Units(2) |
||||||||||
| Jon S. Wheeler |
446,674 | (3) | 12.19 | % | 8.66 | % | ||||||
| Steven M. Belote |
0 | * | * | |||||||||
| Robin Hanisch |
28,185 | (4) | * | * | ||||||||
| John McAuliffe |
0 | * | * | |||||||||
| Ann L. McKinney |
7,863 | (5) | * | * | ||||||||
| Christopher J. Ettel |
0 | * | * | |||||||||
| David Kelly |
0 | * | * | |||||||||
| William W. King |
0 | * | * | |||||||||
| Sanjay Madhu |
0 | * | * | |||||||||
| All directors, director nominees and executive officers as a group (9 persons) |
482,719 | (6) | 13.13 | % | 9.36 | % | ||||||
| * | Less than 1.0% |
| (1) | Based upon 3,301,502 shares of common stock outstanding on December 31, 2012. In addition, amounts for individuals assume that all common units held by the person are exchanged for shares of our common stock, and amounts for all directors, director nominees and executive officers as a group assume all common units held by them are exchanged for shares of our common stock in each case, regardless of when such common units are currently exchangeable. The total number of shares of our common stock outstanding used in calculating this percentage assumes that none of the common units held by other persons are exchanged for shares of our common stock. |
| (2) | Based upon 3,301,502 shares of our common stock and 1,858,068 common units, which units may be redeemed for cash or, at our option, exchanged for shares of our common stock outstanding on December 31, 2012, subject to certain lock-up agreements. |
42
| (3) | Includes 82,572 shares of common stock and 364,102 common units. |
| (4) | Includes 25,000 shares of common stock and 3,185 common units. |
| (5) | Represents 7,863 common units. |
| (6) | Includes 107,572 shares of common stock and 375,150 common units. |
| Item 13. | Certain Relationships and Related Transactions, and Director Independence |
Partnership Agreement
In connection with the completion of our initial public offering, we entered into a partnership agreement with the various persons receiving common units in the formation transactions, including Mr. Wheeler, his affiliates and certain other executive officers of our company. As a result, these persons became limited partners of our Operating Partnership. Upon completion of the initial public offering and the formation transactions, Mr. Wheeler and his affiliates and our other directors and executive officers own 20.19% of the outstanding common units.
Pursuant to the Partnership Agreement, limited partners of our Operating Partnership and some assignees of limited partners will have the right, beginning 12 months after the completion of the initial public offering, to require our Operating Partnership to redeem part or all of their common units for cash equal to the then-current market value of an equal number of shares of our common stock (determined in accordance with and subject to adjustment under the Partnership Agreement), or, at our election, to exchange their common units for shares of our common stock on a one-for-one basis, subject to certain adjustments and the restrictions on ownership and transfer of our stock set forth in our charter.
Employment Agreements
We have entered into employment agreements with each of our executive officers, which provide for salary, bonus and other benefits, and severance upon a termination of employment under certain circumstances. The material terms of the agreements with our named executive officers are described under “Executive Compensation—Employment Agreements” and “Executive Compensation—Compensation Tables.”
Share Incentive Plan
We adopted our 2012 Share Incentive Plan. Such plan authorized the issuance of up to 500,000 shares of our common stock. As of December 31, 2012, we have not issued any securities under the plan.
Indemnification of Officers and Directors
Our charter and bylaws provide for certain indemnification rights for our directors and officers and we will enter into an indemnification agreement with each of our executive officers and directors, providing for procedures for indemnification and advancements by us of certain expenses and costs relating to claims, suits or proceedings arising from their service to us or, at our request, service to other entities, as officers or directors to the maximum extent permitted by Maryland law.
Other Related Party Transactions
Mr. Wheeler, when combined with his affiliates, represents the Company’s largest stockholder. Our Administrative Service Company, which is wholly owned by Mr. Wheeler, provides administrative services to the Company, including management, administrative, accounting, marketing, development and design services. The Company also benefits from Mr. Wheeler’s current organization and platform that specializes in retail real estate investment and management.
Wheeler Interests, LLC, a company controlled by Mr. Wheeler, leases our Riversedge property under a 10 year operating lease expiring in November 2017, with four five-year renewal options available. The lease currently requires monthly base rental payments of $23,600 and provides for annual increases throughout the term of the lease and subsequent option periods. Additionally, Wheeler Interests, LLC reimburses us for a portion of the property’s operating expenses and real estate taxes. We consider the terms of the lease agreement with Wheeler Interests, LLC to be comparable to those received by other nonrelated third parties.
The following summarizes related party activity of the combined Ownership Entities for the year ended December 31, 2012 and 2011.
| December 31, | ||||||||
| 2012 | 2011 | |||||||
| Amounts paid to Wheeler Interests and its affiliates: |
||||||||
| Wheeler Interests |
$ | 691,636 | $ | 337,292 | ||||
| Wheeler Development |
57,774 | 11,672 | ||||||
| Wheeler Real Estate |
50,998 | 76,220 | ||||||
| Site Applications |
67,746 | 73,314 | ||||||
| Creative Retail Works |
— | 5,621 | ||||||
| TESR |
22,011 | 19,152 | ||||||
|
|
|
|
|
|||||
| $ | 890,165 | $ | 523,271 | |||||
|
|
|
|
|
|||||
| Amounts due to Wheeler Interests and its affiliates: |
||||||||
| Wheeler Interests |
$ | 51,417 | $ | 9,738 | ||||
| Wheeler Development |
3,962 | — | ||||||
| Wheeler Real Estate |
31,496 | 15,719 | ||||||
| Site Applications |
1,150 | 6,096 | ||||||
| TESR |
— | 9,704 | ||||||
| WHLR Management |
15,308 | — | ||||||
| Jon Wheeler and affiliates |
86,836 | 1,131,489 | ||||||
|
|
|
|
|
|||||
| $ | 190,169 | $ | 1,172,746 | |||||
|
|
|
|
|
|||||
| Rent and reimbursement income received from Wheeler Interests |
$ | 406,300 | $ | 396,500 | ||||
|
|
|
|
|
|||||
| Rent and other tenant receivables due from Wheeler Interests |
$ | 250,063 | $ | 128,790 | ||||
|
|
|
|
|
|||||
43
| Item 14. | Principal Accounting Fees and Services |
Cherry Bekaert LLP (“CB”) was appointed by the Company to serve as its independent registered public accounting firm for fiscal year 2012. Audit services provided by CB for fiscal 2012 included the examination of the consolidated financial statements of the Company; and services related to periodic filings made with the SEC.
Fees Paid To Independent Registered Public Accounting Firm
| Fees Billed |
2012 | |||
| Audit * |
$ | 120,000 | ||
| Audit Related ** |
145,800 | |||
| Tax *** |
1,100 | |||
| Other |
— | |||
|
|
|
|||
| Total |
$ | 266,900 | ||
|
|
|
|||
| * | Audit fees included annual audits and quarterly review |
| ** | Audit Related fees for services related to the REIT’s IPO and associated filings |
| *** | Tax relates primarily to tax advisory services related to REIT status |
Audit Committee Pre-Approval Policies
Before CB was engaged by the Company to render audit or non-audit services, the engagement was approved by the Company’s audit committee. All services rendered by CB have been so approved.
| Item 15. | Exhibits and Financial Statement Schedules |
1. Financial Statements. The list of our financial statements filed as a part of this Annual Report on Form 10-K is set forth on page F-1 herein.
2. Financial Statement Schedules.
| a. | Schedule II- Valuation and Qualifying Accounts |
| b. | Schedule III- Real Estate and Accumulated Depreciation |
All other financial statements schedules have been omitted because the required information of such schedules is not present, is not present in amounts sufficient to require a schedule or is included in the consolidated financial statements.
3. Exhibits. The list of exhibits filed as a part of this Annual Report on Form 10-K in response to Item 601 of Regulation S-K is submitted on the Exhibit Index attached hereto and incorporated herein by reference.
44
SIGNATURE
Pursuant to the requirements of the Securities Exchange Act of 1934, the Registrant has duly caused this report to be signed on its behalf by the undersigned thereunto duly authorized.
| WHEELER REAL ESTATE INVESTMENT TRUST, INC. | ||||||
| By: | /s/ STEVEN M. BELOTE | |||||
| Steven M. Belote | ||||||
| Chief Financial Officer | ||||||
| Date: March 29, 2013 | ||||||
Wheeler Real Estate Investment Trust, Inc. and Subsidiaries
INDEX TO CONSOLIDATED AND COMBINED FINANCIAL STATEMENTS
F-1
Report of Independent Registered Public Accounting Firm
To the Board of Directors and Stockholders of
Wheeler Real Estate Investment Trust, Inc. and Subsidiaries
Virginia Beach, Virginia
We have audited the accompanying consolidated and combined balance sheets of Wheeler Real Estate Investment Trust, Inc. and Subsidiaries (the “Company”) as of December 31, 2012 and 2011 and the related consolidated and combined statements of operations, equity and cash flows for each of the years in the two-year period ended December 31, 2012. In connection with our audits of the consolidated and combined financial statements, we have also audited the financial statement schedules as listed in the accompanying index. The Company’s management is responsible for these consolidated and combined financial statements and the financial statement schedules. Our responsibility is to express an opinion on these consolidated and combined financial statements and financial statement schedules based on our audits.
We conducted our audits in accordance with the standards of the Public Company Accounting Oversight Board (United States). Those standards require that we plan and perform the audit to obtain reasonable assurance about whether the financial statements are free of material misstatement. The Company is not required to have, nor were we engaged to perform, an audit of its internal control over financial reporting. Our audits included consideration of internal control over financial reporting as a basis for designing audit procedures that are appropriate in the circumstances, but not for the purpose of expressing an opinion on the effectiveness of the Company’s internal control over financial reporting. Accordingly, we express no such opinion. An audit also includes examining, on a test basis, evidence supporting the amounts and disclosures in the consolidated and combined financial statements, assessing the accounting principles used and significant estimates made by management, as well as evaluating the overall financial statement presentation. We believe that our audits provide a reasonable basis for our opinion.
In our opinion, the consolidated and combined financial statements referred to above present fairly, in all material respects, the financial position of Wheeler Real Estate Investment Trust, Inc. and Subsidiaries as of December 31, 2012 and 2011 and the results of its operations and its cash flows for each of the years in the two-year period ended December 31, 2012, in conformity with accounting principles generally accepted in the United States of America. Also, in our opinion, the related financial statement schedules, when considered in relation to the basic consolidated and combined financial statements taken as a whole, present fairly, in all material respects, the information set forth therein.
/s/ Cherry Bekaert LLP
Virginia Beach, Virginia
March 29, 2013
F-2
Wheeler Real Estate Investment Trust, Inc. and Subsidiaries
Consolidated and Combined Balance Sheets
| December 31, | ||||||||
| 2012 | 2011 | |||||||
| ASSETS: |
||||||||
| Investment properties, at cost |
$ | 46,637,221 | $ | 15,774,838 | ||||
| Less accumulated depreciation and amortization |
3,291,556 | 2,618,324 | ||||||
|
|
|
|
|
|||||
| 43,345,665 | 13,156,514 | |||||||
| Cash and cash equivalents |
2,053,192 | 104,007 | ||||||
| Receivables: |
||||||||
| Rents and other tenant receivables, net |
183,021 | 82,849 | ||||||
| Rents and other tenant receivables due from related parties, net |
250,063 | 128,790 | ||||||
| Unbilled rent |
328,030 | 360,952 | ||||||
| Deferred costs and other assets |
6,527,906 | 991,784 | ||||||
|
|
|
|
|
|||||
| Total Assets |
$ | 52,687,877 | $ | 14,824,896 | ||||
|
|
|
|
|
|||||
| LIABILITIES: |
||||||||
| Mortgages and other indebtedness |
$ | 31,843,503 | $ | 12,136,083 | ||||
| Below market lease intangible, net |
3,673,019 | — | ||||||
| Accounts payable, accrued expenses and other liabilities |
748,727 | 846,742 | ||||||
| Due to related parties |
190,169 | 1,172,746 | ||||||
|
|
|
|
|
|||||
| Total Liabilities |
36,455,418 | 14,155,571 | ||||||
|
|
|
|
|
|||||
| Commitments and contingencies (Note 7) |
— | — | ||||||
| EQUITY: |
||||||||
| Convertible preferred stock (no par value, 500,000 shares authorized, 0 and 126,250 shares issued and outstanding, respectively) |
— | 505,000 | ||||||
| Common stock ($0.01 par value, 15,000,000 shares authorized, 3,301,502 and 0 shares issued and outstanding, respectively) |
33,015 | — | ||||||
| Additional paid-in capital |
14,097,453 | — | ||||||
| Capital contributions |
— | 2,755,675 | ||||||
| Accumulated deficit |
(5,443,099 | ) | (2,591,350 | ) | ||||
|
|
|
|
|
|||||
| Total Shareholders’ Equity |
8,687,369 | 669,325 | ||||||
| Noncontrolling interests |
7,545,090 | — | ||||||
|
|
|
|
|
|||||
| Total Equity |
16,232,459 | 669,325 | ||||||
|
|
|
|
|
|||||
| Total Liabilities and Equity |
$ | 52,687,877 | $ | 14,824,896 | ||||
|
|
|
|
|
|||||
See accompanying notes to consolidated and combined financial statements.
F-3
Wheeler Real Estate Investment Trust, Inc. and Subsidiaries
Consolidated and Combined Statements of Operations
| Years Ended December 31, | ||||||||
| 2012 | 2011 | |||||||
| REVENUE: |
||||||||
| Minimum rent |
$ | 1,954,321 | $ | 1,458,083 | ||||
| Percentage of sales rent |
9,360 | 6,525 | ||||||
| Tenant reimbursements |
452,110 | 329,452 | ||||||
| Other income |
18,188 | 131,217 | ||||||
|
|
|
|
|
|||||
| Total Revenue |
2,433,979 | 1,925,277 | ||||||
|
|
|
|
|
|||||
| OPERATING EXPENSES: |
||||||||
| Property operating |
311,042 | 352,508 | ||||||
| Real estate taxes |
134,301 | 104,555 | ||||||
| Repairs and maintenance |
73,877 | 63,253 | ||||||
| Depreciation and amortization |
822,152 | 744,931 | ||||||
| Provision for credit losses |
25,000 | 20,000 | ||||||
| Corporate general & administrative |
1,307,151 | 388,660 | ||||||
|
|
|
|
|
|||||
| Total Operating Expenses |
2,673,523 | 1,673,907 | ||||||
|
|
|
|
|
|||||
| Operating Income (Loss) |
(239,544 | ) | 251,370 | |||||
| Interest expense |
(966,113 | ) | (805,969 | ) | ||||
|
|
|
|
|
|||||
| Net Loss |
(1,205,657 | ) | (554,599 | ) | ||||
| Less: Net loss attributable to noncontrolling interests |
(43,880 | ) | — | |||||
|
|
|
|
|
|||||
| Net Loss Attributable to Wheeler REIT |
$ | (1,161,777 | ) | $ | (554,599 | ) | ||
|
|
|
|
|
|||||
| Loss per share: |
||||||||
| Basic |
$ | (0.35 | ) | |||||
|
|
|
|||||||
| Diluted |
$ | (0.35 | ) | |||||
|
|
|
|||||||
| Weighted-average number of shares: |
||||||||
| Basic |
3,301,502 | |||||||
|
|
|
|||||||
| Diluted |
3,301,502 | |||||||
|
|
|
|||||||
See accompanying notes to consolidated and combined financial statements.
F-4
Wheeler Real Estate Investment Trust, Inc. and Subsidiaries
Consolidated and Combined Statements of Equity
| Preferred Stock | Common Stock | Additional Paid-in |
Capital | Accumulated | Total Stockholders’ |
Noncontrolling Interests | Total | |||||||||||||||||||||||||||||||||||||
| Shares | Value | Shares | Value | Capital | Contributions | Deficit | Equity | Units | Value | Equity | ||||||||||||||||||||||||||||||||||
| Balance, December 31, 2010 |
— | $ | — | — | $ | — | $ | — | $ | 2,755,675 | $ | (1,755,356 | ) | $ | 1,000,319 | — | $ | — | $ | 1,000,319 | ||||||||||||||||||||||||
| Net proceeds from issuance of preferred stock |
126,250 | 505,000 | — | — | — | — | — | 505,000 | — | — | 505,000 | |||||||||||||||||||||||||||||||||
| Distributions |
— | — | — | — | — | — | (281,395 | ) | (281,395 | ) | — | — | (281,395 | ) | ||||||||||||||||||||||||||||||
| Net loss |
— | — | — | — | — | — | (554,599 | ) | (554,599 | ) | — | — | (554,599 | ) | ||||||||||||||||||||||||||||||
|
|
|
|
|
|
|
|
|
|
|
|
|
|
|
|
|
|
|
|
|
|
|
|||||||||||||||||||||||
| Balance, December 31, 2011 |
126,250 | 505,000 | — | — | — | 2,755,675 | (2,591,350 | ) | 669,325 | — | — | 669,325 | ||||||||||||||||||||||||||||||||
| Net proceeds from issuance of preferred stock |
123,500 | 494,000 | — | — | — | — | — | 494,000 | — | — | 494,000 | |||||||||||||||||||||||||||||||||
| Issuance of common stock (1) |
— | — | 3,016,045 | 30,160 | 13,101,308 | — | — | 13,131,468 | — | — | 13,131,468 | |||||||||||||||||||||||||||||||||
| Issuance of common units in conjunction with REIT formation transactions |
— | — | — | — | — | (2,755,675 | ) | (1,311,068 | ) | (4,066,743 | ) | 1,730,129 | 6,838,549 | 2,771,806 | ||||||||||||||||||||||||||||||
| Issuance of common units in conjunction with acquisitions |
— | — | — | — | — | — | — | — | 127,939 | 750,421 | 750,421 | |||||||||||||||||||||||||||||||||
| Conversion of preferred stock to common stock |
(249,750 | ) | (999,000 | ) | 285,457 | 2,855 | 996,145 | — | — | — | — | — | — | |||||||||||||||||||||||||||||||
| Dividends and distributions |
— | — | — | — | — | — | (378,904 | ) | (378,904 | ) | — | — | (378,904 | ) | ||||||||||||||||||||||||||||||
| Net loss |
— | — | — | — | — | — | (1,161,777 | ) | (1,161,777 | ) | — | (43,880 | ) | (1,205,657 | ) | |||||||||||||||||||||||||||||
|
|
|
|
|
|
|
|
|
|
|
|
|
|
|
|
|
|
|
|
|
|
|
|||||||||||||||||||||||
| Balance, December 31, 2012 |
— | $ | — | 3,301,502 | $ | 33,015 | $ | 14,097,453 | $ | — | $ | (5,443,099 | ) | $ | 8,687,369 | 1,858,068 | $ | 7,545,090 | $ | 16,232,459 | ||||||||||||||||||||||||
|
|
|
|
|
|
|
|
|
|
|
|
|
|
|
|
|
|
|
|
|
|
|
|||||||||||||||||||||||
| (1) | Net of offering costs of $2.7 million. |
See accompanying notes to consolidated and combined financial statements.
F-5
Wheeler Real Estate Investment Trust, Inc. and Subsidiaries
Consolidated and Combined Statements of Cash Flows
| For the Years Ended December 31, | ||||||||
| 2012 | 2011 | |||||||
| CASH FLOWS FROM OPERATING ACTIVITIES: |
||||||||
| Net loss |
$ | (1,205,657 | ) | $ | (554,599 | ) | ||
| Adjustments to reconcile combined net loss to net cash provided by operating activities |
||||||||
| Depreciation and amortization |
833,713 | 744,931 | ||||||
| Provision for doubtful accounts |
25,000 | 20,000 | ||||||
| Changes in assets and liabilities |
||||||||
| Tenant receivables and accrued revenue, net |
(246,445 | ) | (98,503 | ) | ||||
| Unbilled rent |
32,922 | 63,501 | ||||||
| Other assets |
88,211 | (37,161 | ) | |||||
| Accounts payable, accrued expenses and other liabilities |
182,372 | 211,543 | ||||||
|
|
|
|
|
|||||
| Net cash from operating activities |
(289,884 | ) | 349,712 | |||||
|
|
|
|
|
|||||
| CASH FLOWS FROM INVESTING ACTIVITIES: |
||||||||
| Investment property acquisitions |
(8,754,718 | ) | — | |||||
| Capital expenditures |
(47,337 | ) | (33,346 | ) | ||||
|
|
|
|
|
|||||
| Net cash from investing activities |
(8,802,055 | ) | (33,346 | ) | ||||
|
|
|
|
|
|||||
| CASH FLOWS FROM FINANCING ACTIVITIES: |
||||||||
| Distributions paid |
(126,084 | ) | (281,395 | ) | ||||
| Proceeds from sales of preferred stock |
494,000 | 505,000 | ||||||
| Proceeds from sales of common stock |
13,370,984 | — | ||||||
| Deferred offering costs |
— | (239,515 | ) | |||||
| Net proceeds from related parties |
128,855 | (181,592 | ) | |||||
| Mortgage indebtedness principal payments |
(2,826,631 | ) | (214,494 | ) | ||||
|
|
|
|
|
|||||
| Net cash from financing activities |
11,041,124 | (411,996 | ) | |||||
|
|
|
|
|
|||||
| INCREASE (DECREASE) IN CASH AND CASH EQUIVALENTS |
1,949,185 | (95,630 | ) | |||||
| CASH AND CASH EQUIVALENTS, beginning of year |
104,007 | 199,637 | ||||||
|
|
|
|
|
|||||
| CASH AND CASH EQUIVALENTS, end of year |
$ | 2,053,192 | $ | 104,007 | ||||
|
|
|
|
|
|||||
| Supplemental Disclosures: |
||||||||
| Noncash Transactions: |
||||||||
| Debt assumed in conjunction with investment property acquisitions |
$ | 22,541,179 | $ | — | ||||
|
|
|
|
|
|||||
| Noncontrolling interests resulting from the issuance of common units |
$ | 7,588,970 | $ | — | ||||
|
|
|
|
|
|||||
| Other Cash Transactions: |
||||||||
| Cash paid for interest |
$ | 941,185 | $ | 803,791 | ||||
|
|
|
|
|
|||||
See accompanying notes to consolidated and combined financial statements.
F-6
Wheeler Real Estate Investment Trust, Inc. and Subsidiaries
Notes to Consolidated and Combined Financial Statements
| 1. | Organization and Basis of Presentation and Consolidation |
Wheeler Real Estate Investment Trust, Inc. (the “Trust” or “REIT”) is a Maryland corporation formed on June 23, 2011 to acquire the entities owning various controlling and noncontrolling interests in real estate assets owned and/or managed by Jon S. Wheeler and/or his affiliates, including certain entities controlled by Plume Street Financial, LLC (“PSF Entities”). In conjunction with acquiring these entities, the Trust filed a Registration Statement with the Securities and Exchange Commission (“SEC”) on Form S-11 in order to complete an initial public offering. On October 23, 2012, the Trust’s Registration Statement became effective and the common stock was priced at $5.25. On November 16, 2012, the Trust closed the formation and offering transactions by acquiring the ownership interests of the entities described below and by selling 3,016,045 shares of common stock at $5.25 per share, generating approximately $15.83 million in gross proceeds. The Company used approximately $2.70 million to cover offering expenses, approximately $4.18 million to cash-out prior investors in the properties, approximately $1.78 million to directly purchase The Shoppes at Eagle Harbor and approximately $322,000 to repay the outstanding indebtedness on the Amscot Building.
The formation transactions consisted of acquiring the ownership interests of five entities controlled by Jon S. Wheeler and/or his affiliates (“Controlled Entities”) and three entities controlled by Plume Street Financial, of which Mr. Wheeler is a 50% partner (“Noncontrolled Entities”). The entities and respective properties party to the transactions are as follows:
Controlled Entities (Predecessor):
Wheeler Real Estate Investment Trust, Inc.
Wheeler Real Estate Investment Trust, L.P.
DF-1 Carrollton, LLC – The Shoppes at Eagle Harbor (Carrollton, VA)
Lynnhaven Parkway Associates, LLC – Monarch Bank Building (Virginia Beach, VA)
North Pointe Investors, LLC – North Pointe Crossing/Amscot Building (Tampa, FL)
Riversedge Office Associates, LLC – Riversedge North (Virginia Beach, VA)
Walnut Hill Plaza Associates, LLC – Walnut Hill Plaza (Petersburg, VA)
Noncontrolled Entities (PSF Entities):
Lumber River Associates, LLC – Lumber River Village (Lumberton, NC)
Perimeter Associates, LLC – Perimeter Square (Tulsa, OK)
Tuckernuck Associates, LLC – Shoppes at TJ Maxx (Richmond, VA)
The contribution of or acquisition by merger of interests in the Controlled Entities was accounted for as a transaction between entities under common control and, therefore, the acquisition of interests in each of the Controlled Entities was recorded at our historical cost. We determined that Walnut Hill Plaza Associates, LLC was the acquirer for accounting purposes as it represented the largest of the five entities in both asset size and total revenues and the exchange of equity interests related to this entity resulted in the largest number of common units being received by Mr. Wheeler and its other investors. Since Mr. Wheeler did not own a controlling interest in the PSF Entities, the acquisition of the Noncontrolled Entities listed above were accounted for as an acquisition under the purchase accounting method and recognized at the fair value of acquired assets and assumed liabilities on the date of such contribution or acquisition. The fair value of these assets and liabilities was allocated in accordance with ASC section 805-10, Business Combinations. Our methodology of allocating the cost of acquisitions to assets acquired and liabilities assumed was based on fair values, replacement cost and appraised values. We determined the fair value of acquired tangible assets (consisting of land, building and improvements), identified intangible lease assets and liabilities (consisting of acquired above-market leases, acquired in-place lease value, and acquired below-market leases) and assumed debt. The value of the consideration paid to each of the PSF Entities’ prior investors was based upon the terms of the applicable contribution agreement among the Operating Partnership and the PSF Entities’ investor or investors and was determined based on a relative equity valuation analysis of the PSF Entities. In exchange for contributing their interests in the PSF Entities, the PSF Entities’ investors received an aggregate of $2.98 million and 916,923 common units.
F-7
Wheeler Real Estate Investment Trust, Inc. and Subsidiaries
Notes to Consolidated and Combined Financial Statements (Continued)
| 1. | Organization and Basis of Presentation and Consolidation (continued) |
The following summarizes the consideration paid and the preliminary fair values of assets acquired and liabilities assumed in conjunction with the Trust acquiring the PSF Entities, along with a description of the methods used to determine fair value. In determining fair values, we considered many factors including, but not limited to, cash flows, market cap rates, location, occupancy rates, appraisals, other acquisitions and our knowledge of the current acquisition market for similar properties.
| Estimated fair value of assets acquired and liabilities assumed: |
||||
| Investment property (a) |
$ | 20,769,328 | ||
| Tenant and other receivables and other assets (b) |
1,209,811 | |||
| Other lease intangibles (c) |
3,250,840 | |||
| Mortgage debt (d) |
(14,004,098 | ) | ||
| Accounts payable, accrued expenses and other liabilities (e) |
(211,997 | ) | ||
| Above/(below) market leases (f) |
(3,220,166 | ) | ||
|
|
|
|||
| Fair value of net assets acquired |
$ | 7,793,718 | ||
|
|
|
|||
| Less estimated purchase consideration: |
||||
| Estimated consideration paid with common units |
$ | 4,813,848 | ||
| Estimated consideration paid with cash |
2,979,870 | |||
|
|
|
|||
| Total estimated consideration (g) |
$ | 7,793,718 | ||
|
|
|
| a. | Represents the fair value of the net investment properties acquired which includes land, buildings, site improvements, tenant improvements and in place leases. The fair value was determined using following approaches: |
| i. | the market approach valuation methodology for land by considering similar transactions in the markets; |
| ii. | a combination of the cost approach and income approach valuation methodologies for buildings, including replacement cost evaluations, “go dark” analyses and residual calculations incorporating the land values; |
| iii. | the cost approach valuation methodology for site and tenant improvements, including replacement costs and prevailing quoted market rates; and |
| iv. | the income approach valuation methodology for in place leases which considered estimated market rental rates, expenses reimbursements and time required to replace leases. |
| b. | Represents the fair value of tenant and other receivables and other current assets. It was determined that carrying value approximated fair value for all amounts in these categories. |
| c. | Represents the fair value of other lease intangibles which includes leasing commissions and legal and marketing fees associated with replacing existing leases. The income approach was used to determine the fair value of these intangible assets which included estimated market rates and expenses. |
| d. | Represents the fair value of mortgages payable which was calculated by performing a discounted cash flow analysis on debt service using current prevailing market interest on comparable debt. |
| e. | Represents the fair value of accounts payable, accrued expenses and other liabilities. It was determined that carrying value approximated fair value for all amounts in these categories. |
| f. | Represents the fair value of above/(below) market leases. The income approach was used to determine the fair value of above/(below) market leases using market rental rates for similar properties. |
| g. | Represents the components of purchase consideration paid. |
F-8
Wheeler Real Estate Investment Trust, Inc. and Subsidiaries
Notes to Consolidated and Combined Financial Statements (Continued)
| 1. | Organization and Basis of Presentation and Consolidation (continued) |
Wheeler Real Estate Investment Trust, L.P., our “Operating Partnership”, was formed as a Virginia limited partnership on April 5, 2012. All operations are primarily carried out through our Operating Partnership. The Trust, as the sole general partner of our Operating Partnership, controls our Operating Partnership. Accordingly, the accompanying consolidated financial statements include the assets, liabilities and results of operations of the Trust and our Operating Partnership. The Trust contributed substantially all of the net proceeds from the offering to the Operating Partnership in exchange for Operating Partnership units therein. The Trust’s interest in the Operating Partnership will generally entitle it to share in cash distributions from, and in the profits and losses of, the Operating Partnership in proportion to the Trust’s percentage ownership. As the sole general partner of the Operating Partnership, the Trust will generally have the exclusive power under the partnership agreement to manage and conduct the Operating Partnership’s business and affairs, subject to certain limited approval and voting rights of the limited partners.
Wheeler Real Estate Investment Trust, Inc. and Subsidiaries (the “Company”) includes the Trust, the Operating Partnership, the original eight entities included in the REIT formation and the three entities acquired during December 2012 (See Note 3 “Investment Properties”). The Company prepared the accompanying consolidated financial statements in accordance with accounting principles generally accepted in the United States of America, or GAAP. Accordingly, the Company relied on GAAP applicable to transactions between entities under common control and business combinations when preparing consolidated and combined financial statements. In accordance with these principles, the Company combined the historical accounting records for the original Controlled Entities and has included their historical financial position, results of operations and cash flows through the closing date of the formation transactions. The Company recorded the financial position of the original Noncontrolled Entities and the three entities acquired subsequent to the formation transactions at fair value on the acquisition date. Accordingly, the consolidated financial statements only include the results of operations and cash flows of these entities since they were acquired. From the closing of the formation and offering transaction, and the applicable acquisition dates, the Company has consolidated the financial position, results of operation, and cash flows of the aforementioned entities. All material balances and transactions between the consolidated and combined entities of the Company have been eliminated.
The following unaudited pro forma condensed consolidated financial information is presented to illustrate the estimated impact on the results of operations of the Company assuming the formation transactions discussed above occurred on January 1, 2011.
| Year Ended December 31, 2012 | ||||||||||||
| WHLR and Subsidiaries (1) |
PSF Entities (2) |
Consolidated | ||||||||||
| Total Revenues |
$ | 2,433,979 | $ | 2,883,035 | $ | 5,317,014 | ||||||
| Total Operating Expenses |
2,673,523 | 2,154,303 | 4,827,826 | |||||||||
|
|
|
|
|
|
|
|||||||
| Net Operating Income (Loss) |
(239,544 | ) | 728,732 | 489,188 | ||||||||
| Interest Expense |
(966,113 | ) | (784,930 | ) | (1,751,043 | ) | ||||||
|
|
|
|
|
|
|
|||||||
| Net Loss |
$ | (1,205,657 | ) | $ | (56,198 | ) | $ | (1,261,855 | ) | |||
|
|
|
|
|
|
|
|||||||
| (1) | Includes the operations of the PSF Entities for the period from November 16, 2012 (date of formation transactions) through December 31, 2012. |
| (2) | Represents the estimated operations of the PSF Entities for the period from January 1, 2012 until November 16, 2012. |
| Year Ended December 31, 2011 | ||||||||||||
| WHLR and Subsidiaries |
PSF Entities | Consolidated | ||||||||||
| Total Revenues |
$ | 1,925,277 | $ | 3,080,563 | $ | 5,005,840 | ||||||
| Total Operating Expenses |
1,673,907 | 2,437,503 | 4,111,410 | |||||||||
|
|
|
|
|
|
|
|||||||
| Net Operating Income |
251,370 | 643,060 | 894,430 | |||||||||
| Interest Expense |
(805,969 | ) | (951,916 | ) | (1,757,885 | ) | ||||||
|
|
|
|
|
|
|
|||||||
| Net Loss |
$ | (554,599 | ) | $ | (308,856 | ) | $ | (863,455 | ) | |||
|
|
|
|
|
|
|
|||||||
F-9
Wheeler Real Estate Investment Trust, Inc. and Subsidiaries
Notes to Consolidated and Combined Financial Statements (Continued)
| 1. | Organization and Basis of Presentation and Consolidation (continued) |
The Company was formed with the principle objective of acquiring, financing, developing, leasing, owning and managing income producing, strip centers, neighborhood, grocery-anchored, community and free-standing retail properties. Its strategy is to acquire high quality, well-located, dominant retail properties that generate attractive risk-adjusted returns. The Company targets competitively protected properties in communities that have stable demographics and have historically exhibited favorable trends, such as strong population and income growth. The Company considers competitively protected properties to be located in the most prominent shopping districts in their respective markets, ideally situated at major “Main and Main” intersections. The Company generally leases its properties to national and regional supermarket chains and select retailers that offer necessity and value oriented items and generate regular consumer traffic. The Company’s tenants carry goods that are less impacted by fluctuations in the broader U.S. economy and consumers’ disposable income, which it believes generates more predictable property-level cash flows.
The Company’s portfolio is comprised of seven retail shopping centers, three free-standing retail properties and one office building. Five of these properties are located in Virginia, one is located in Florida, one is located in North Carolina, one is located in South Carolina, one is located in Georgia and two are located in Oklahoma. The Company’s portfolio had total net rentable space of 470,350 square feet and an occupancy level of approximately 94% at December 31, 2012.
| 2. | Summary of Significant Accounting Policies |
Investment Properties
The Company records investment properties and related intangibles at cost or fair value upon acquisition less accumulated depreciation and amortization. Investment properties include both acquired and constructed assets. Improvements and major repairs and maintenance are capitalized when the repair and maintenance substantially extends the useful life, increases capacity or improves the efficiency of the asset. All other repair and maintenance costs are expensed as incurred. The Company capitalizes interest on projects during periods of construction until the projects reach the completion point that corresponds with their intended purpose.
The Company allocates the purchase price of acquisitions to the various components of the acquisition based upon the fair value of each component which may be derived from various observable or unobservable inputs and assumptions. Also, the Company may utilize third party valuation specialists. These components typically include buildings, land and any intangible assets related to out-of the market leases and in-place leases the Company determines to exist. We determine fair value based on estimated cash flow projections that utilize appropriate discount and capitalization rates and available market information. Estimates of future cash flows are based on a number of factors including the historical operating results, known trends and specific market and economic conditions that may affect the property. Factors considered by management in our analysis of determining the as-if-vacant property value include an estimate of carrying costs during the expected lease-up periods considering market conditions, and costs to execute similar leases. In estimating carrying costs, management includes real estate taxes, insurance and estimates of lost rentals at market rates during the expected lease-up periods, tenant demand and other economic conditions. Management also estimates costs to execute similar leases including leasing commissions, tenant improvements, legal and other related expenses. Intangibles related to out-of-market leases and in-place lease value are recorded as acquired lease intangibles and are amortized as an adjustment to rental revenue or amortization expense, as appropriate, over the remaining terms of the underlying leases. Premiums or discounts on acquired out-of-market debt are amortized to interest expense over the remaining term of such debt.
The Company records depreciation on buildings and improvements utilizing the straight-line method over the estimated useful life of the asset, generally 5 to 40 years. The Company reviews depreciable lives of investment properties periodically and makes adjustments to reflect a shorter economic life, when necessary. Tenant allowances, tenant inducements and tenant improvements are amortized utilizing the straight-line method over the term of the related lease or occupancy term of the tenant, if shorter.
Amounts allocated to building are depreciated over the estimated remaining life of the acquired building or related improvements. The Company amortizes amounts allocated to tenant improvements, in-place lease assets and other lease-related intangibles over the remaining life of the underlying leases. The Company also estimates the value of other acquired intangible assets, if any, and amortizes them over the remaining life of the underlying related intangibles.
The Company reviews investment properties for impairment on a property-by-property basis whenever events or changes in circumstances indicate that the carrying value of investment properties may not be recoverable, but at least annually. These circumstances include, but are not limited to, declines in the property’s cash flows, occupancy and fair market value. The Company measures any impairment of investment property when the estimated undiscounted operating income before depreciation and amortization, plus its residual value, is less than the carrying value of the property. To the extent impairment has occurred, the Company charges to income the excess of carrying value of the property over its estimated fair value. The Company estimates fair value using unobservable data such as operating income, estimated capitalization rates, or multiples, leasing prospects and local market information. The Company may decide to sell properties that are held for use and the sale prices of these properties may differ from their carrying values. The Company did not record any impairment adjustments to its properties during the years ended December 31, 2012 and 2011.
F-10
Wheeler Real Estate Investment Trust, Inc. and Subsidiaries
Notes to Consolidated and Combined Financial Statements (Continued)
| 2. | Summary of Significant Accounting Policies (continued) |
Conditional Asset Retirement Obligation
A conditional asset retirement obligation represents a legal obligation to perform an asset retirement activity in which the timing and/or method of settlement depends on a future event that may or may not be with the Company’s control. Currently, the Company does not have any conditional asset retirement obligations. However, any such obligations identified in the future would result in the Company recording a liability if the fair value of the obligation can be reasonably estimated. Environmental studies conducted at the time the Company acquired its properties did not reveal any material environmental liabilities, and the Company is unaware of any subsequent environmental matters that would have created a material liability. The Company believes that its properties are currently in material compliance with applicable environmental, as well as non-environmental, statutory and regulatory requirements. The Company did not record any conditional asset retirement obligation liabilities during the years ended December 31, 2012 and 2011.
Cash and Cash Equivalents
The Company considers all highly liquid investments purchased with an original maturity of 90 days or less to be cash and cash equivalents. Cash equivalents are carried at cost, which approximates fair value. Cash equivalents consist primarily of bank operating accounts and money markets. Financial instruments that potentially subject the Company to concentrations of credit risk include its cash and cash equivalents and its trade accounts receivable. The Company places its cash and cash equivalents with institutions of high credit quality.
The Company places its cash and cash equivalents on deposit with financial institutions in the United States. Beginning December 31, 2010, through December 31, 2012, all noninterest-bearing transaction accounts were fully insured by the Federal Deposit Insurable Company (“FDIC”), regardless of the balance of the account, at all FDIC-insured institutions. However, this provision expired on December 31, 2012 and beginning January 1, 2013, resulting in noninterest-bearing deposits now receiving the same $250,000 insurance coverage provided to a depositor’s other deposit accounts held at an FDIC-insured institution.
The Company’s bank deposits were fully insured by the FDIC at December 31, 2012, based on specified coverage.
Tenant Receivables and Unbilled Rent
Tenant receivables include base rents, tenant reimbursements and receivables attributable to recording rents on a straight-line basis. The Company determines an allowance for the uncollectible portion of accrued rents and accounts receivable based upon customer credit-worthiness (including expected recovery of a claim with respect to any tenants in bankruptcy), historical bad debt levels, and current economic trends. The Company considers a receivable past due once it becomes delinquent per the terms of the lease. Our standard lease form considers a rent charge past due after five days. A past due receivable triggers certain events such as notices, fees and other allowable and required actions per the lease. As of December 31, 2012 and 2011, the Company’s allowance for uncollectible accounts totaled $75,250 and $72,200, respectively. During the years ended December 31, 2012 and 2011, the Company recorded bad debt expenses in the amount of $25,000 and $20,000, respectively, related to tenant receivables that were specifically identified as potentially uncollectible based on the an assessment of the tenant’s credit-worthiness. During the years ended December 31, 2012 and 2011, the Company did not realize any recoveries related to tenant receivables previously charged off.
Deferred Costs and Other Assets
The Company’s deferred costs and other assets consists primarily of internal and external leasing commissions, fees incurred in order to obtain long-term financing, capitalized legal and marketing costs associated with acquisitions, and various property escrow accounts for real estate taxes, insurance and tenant improvements and replacements. The Company records amortization of financing costs using the effective interest method over the terms of the respective loans or agreements. The Company’s lease origination costs consist primarily of commissions paid in connection with lease originations. The Company records amortization of lease origination costs on a straight-line basis over the terms of the related leases. Details of these deferred costs, net of amortization and other assets are as follows:
| December 31, | ||||||||
| 2012 | 2011 | |||||||
| Lease origination costs, net |
$ | 1,941,457 | $ | 178,140 | ||||
| Leases in place, net |
2,916,084 | 14,704 | ||||||
| Financing costs, net |
779,969 | 18,072 | ||||||
| Property escrows |
253,969 | — | ||||||
| Legal and marketing costs, net - acquisitions |
260,146 | — | ||||||
| Deferred REIT offering costs |
— | 772,722 | ||||||
| Other |
376,281 | 8,146 | ||||||
|
|
|
|
|
|||||
| Total Deferred Costs and Other Assets |
$ | 6,527,906 | $ | 991,784 | ||||
|
|
|
|
|
|||||
F-11
Wheeler Real Estate Investment Trust, Inc. and Subsidiaries
Notes to Consolidated and Combined Financial Statements (Continued)
| 2. | Summary of Significant Accounting Policies (continued) |
Amortization of lease origination costs and in place leases represents a component of depreciation and amortization expense. The Company reports amortization of financing costs, amortization of premiums and accretion of discounts as part of interest expense. The Company accounts for in place lease assets as a component of the investment properties’ cost basis (See Note 4 “Investment Properties”). Future amortization of lease origination costs, financing costs, legal and marketing costs and in place leases is as follows:
| For the Years Ending December 31, |
Lease Origination Costs |
Financing Costs |
Legal & Marketing Costs |
In Place Leases |
||||||||||||
| 2013 |
$ | 323,041 | $ | 302,334 | $ | 86,793 | $ | 764,614 | ||||||||
| 2014 |
229,458 | 126,697 | 45,581 | 382,047 | ||||||||||||
| 2015 |
206,949 | 113,468 | 32,105 | 322,149 | ||||||||||||
| 2016 |
188,735 | 43,094 | 27,053 | 289,568 | ||||||||||||
| 2017 |
177,383 | 34,487 | 20,052 | 263,477 | ||||||||||||
| Thereafter |
815,891 | 159,889 | 48,562 | 894,229 | ||||||||||||
|
|
|
|
|
|
|
|
|
|||||||||
| $ | 1,941,457 | $ | 779,969 | $ | 260,146 | $ | 2,916,084 | |||||||||
|
|
|
|
|
|
|
|
|
|||||||||
Revenue Recognition
The Company retains substantially all of the risks and benefits of ownership of the investment properties and accounts for its leases as operating leases. The Company accrues minimum rents on a straight-line basis over the terms of the respective leases. Additionally, certain of the lease agreements contain provisions that grant additional rents based on tenants’ sales volumes (contingent or percentage rent). Percentage rents are recognized when the tenants achieve the specified targets as defined in their lease agreements. During the years ended December 31, 2012 and 2011, the Company recognized percentage rents of $9,360 and $6,525, respectively.
The Company’s leases generally require the tenant to reimburse the Company for a substantial portion of its expenses incurred in operating, maintaining, repairing, insuring and managing the shopping center and common areas (collectively defined as Common Area Maintenance or “CAM” expenses). This significantly reduces the Company’s exposure to increases in costs and operating expenses resulting from inflation or other outside factors. The Company accrues reimbursements from tenants for recoverable portions of all these expenses as revenue in the period the applicable expenditures are incurred. The Company calculates the tenant’s share of operating costs by multiplying the total amount of the operating costs by a fraction, the numerator of which is the total number of square feet being leased by the tenant, and the denominator of which is the average total square footage of all leasable buildings in the property. The Company also receives escrow payments for these reimbursements from substantially all its tenants throughout the year. The Company recognizes differences between estimated recoveries and the final billed amounts in the subsequent year. These differences were not material in any period presented.
The Company recognizes lease termination fees in the period that the lease is terminated and collection of the fees is reasonably assured. Upon early lease termination, the Company provides for losses related to unrecovered intangibles and other assets. The Company did not recognize any lease termination fees during the years ended December 31, 2012 and 2011.
Income Taxes
The Company intends to elect to be taxed as a REIT under Sections 856 through 860 of the Internal Revenue Code and applicable Treasury regulations relating to REIT qualification. In order to maintain this REIT status, the regulations require the Company to distribute at least 90% of its taxable income to stockholders and meet certain other asset and income tests, as well as other requirements. The Company made no provision for federal income taxes for the REIT in the accompanying consolidated financial statements. If the Company fails to qualify as a REIT, it will be subject to tax at regular corporate rates for the years in which it fails to qualify. If the Company loses its REIT status it could not elect to be taxed as a REIT for four years unless the Company’s failure to qualify was due to reasonable cause and certain other conditions were satisfied.
Management has evaluated the effect of the guidance provided by GAAP on Accounting for Uncertainty of Income Taxes and has determined that the Company had no uncertain income tax positions that could have a significant effect on the financial statements for the years ended December 31, 2012 and 2011.
As the REiT was formed in November 2012, it is subject to examination by the Internal Revenue Service and state tax authorities from the date of formation.
Financial Instruments
The carrying amount of financial instruments included in assets and liabilities approximates fair market value due to their immediate or short-term maturity.
F-12
Wheeler Real Estate Investment Trust, Inc. and Subsidiaries
Notes to Consolidated and Combined Financial Statements (Continued)
| 2. | Summary of Significant Accounting Policies (continued) |
Use of Estimates
The Company has made estimates and assumptions that affect the reported amounts of assets and liabilities, disclosure of contingent assets and liabilities at the date of the financial statements, and revenues and expenses during the reported period. The Company’s actual results could differ from these estimates.
Advertising Costs
The Company expenses advertising and promotion costs as incurred. The Company incurred advertising and promotion costs of $35,765 and $27,580 for the years ended December 31, 2012 and 2011, respectively.
Noncontrolling Interests
Noncontrolling interests is the portion of equity in the Operating Partnership not attributable to a parent. The ownership interests not held by the parent are considered noncontrolling interests. Accordingly, we have reported noncontrolling interests in equity on the consolidated balance sheets but separate from the Company’s equity. On the consolidated statements of operations, the subsidiaries are reported at the consolidated amount, including both the amount attributable to the Company and noncontrolling interests. Consolidated statements of changes in equity include beginning balances, activity for the period and ending balances for shareholders’ equity, noncontrolling interests and total equity.
Recent Accounting Pronouncements
In July 2012, the FASB issued Accounting Standards update, or ASU, 2012-02 “Impairment Goodwill and Other (Topic 350).” This amendment would give us the option to first assess qualitative factors to determine whether the existence of an event or circumstance indicates that it is more likely than not that intangible assets are impaired before having to determine the fair value using the current quantitative approach. This ASU is effective for annual and interim goodwill impairment tests performed for fiscal years beginning after September 15, 2012, early adoption permitted. We adopted this ASU during the year ended December 31, 2012. We evaluate intangibles for impairment annually unless factors arise that would create the need to perform an evaluation during interim periods. For the year ended December 31, 2012 there were no factors that indicated any impairment.
Other accounting standards that have been issued or proposed by the FASB or other standard-setting bodies are not currently applicable to the Company or are not expected to have a significant impact on the Company’s financial position, results of operations and cash flows.
F-13
Wheeler Real Estate Investment Trust, Inc. and Subsidiaries
Notes to Consolidated and Combined Financial Statements (Continued)
| 3. | Investment Properties |
Investment properties consist of the following:
| December 31, | ||||||||
| 2012 | 2011 | |||||||
| Land |
$ | 9,681,750 | $ | 2,925,277 | ||||
| Buildings and improvements |
36,955,471 | 12,849,561 | ||||||
|
|
|
|
|
|||||
| Investment properties at cost |
46,637,221 | 15,774,838 | ||||||
| Less accumulated depreciation and amortization |
(3,291,556 | ) | (2,618,324 | ) | ||||
|
|
|
|
|
|||||
| Investment properties at cost, net |
$ | 43,345,665 | $ | 13,156,514 | ||||
|
|
|
|
|
|||||
The Company’s depreciation and amortization expense was $822,152 and $744,931 for the years ended December 31, 2012 and 2011, respectively.
All of the Company’s land, buildings and improvements serve as collateral for its mortgage loans payable portfolio. Accordingly, restrictions exist as to each property’s transferability, use and other common rights typically associated with property ownership.
Property Acquisitions
On December 14, 2012, we purchased a 31,500 square foot free-standing grocery store located in the Harbor Point shopping center in Grove, Oklahoma for a purchase price of approximately $4.55 million. Referred to as Harps at Harbor Point, the property is 100% occupied by Harps Food Stores (Harps) through a stabilized 20-year, triple-net lease expiring in June 2032 with four five-year options available.
On December 18, 2012, we purchased a 47,680 square foot grocery-anchored shopping center located in Batesburg-Leesville, South Carolina for a purchase price of approximately $4.50 million. Referred to as Twin City Crossing, the property is 100% occupied and is anchored by a Bi-Lo grocery store. Bi-Lo occupies 88% of the total rentable square feet of the center through a 10-year lease expiring in December 2021 with six five-year options available.
On December 21, 2012, we purchased a 42,680 square foot grocery-anchored shopping center located in Hawkinsville, Georgia for a purchase price of approximately $2.30 million. Referred to as Surrey Plaza, the property is 100% occupied and is anchored by a Harvey’s Supermarket and a Rite-Aid pharmacy. Harvey’s and Rite-Aid occupy approximately 86% of the total rentable square feet of the center through a 10-year leases expiring in January 2018. Harvey’s lease includes three five-year options while Rite-Aid’s lease includes one five-year option.
The following summarizes the consideration paid and the preliminary estimated fair values of assets acquired and liabilities assumed in conjunction with the acquisitions described above, along with a description of the methods used to determine fair value. In determining fair values, we considered many factors including, but not limited to, cash flows, market cap rates, location, occupancy rates, appraisals, other acquisitions and our knowledge of the current acquisition market for similar properties.
| Harbor Point | Twin City | Surry Plaza | Total | |||||||||||||
| Preliminary estimated fair value of assets acquired and liabilities assumed: |
||||||||||||||||
| Investment property (a) |
$ | 3,985,360 | $ | 3,841,227 | $ | 2,237,245 | $ | 10,063,832 | ||||||||
| Lease intangibles and other assets (b) |
641,383 | 921,433 | 217,461 | 1,780,277 | ||||||||||||
| Accounts payable, accrued expenses and other liabilities (c) |
— | — | (60,352 | ) | (60,352 | ) | ||||||||||
| Above/(below) market leases (d) |
(76,743 | ) | (262,660 | ) | (154,706 | ) | (494,109 | ) | ||||||||
|
|
|
|
|
|
|
|
|
|||||||||
| Fair value of net assets acquired |
$ | 4,550,000 | $ | 4,500,000 | $ | 2,239,648 | $ | 11,289,648 | ||||||||
|
|
|
|
|
|
|
|
|
|||||||||
| Purchase consideration: |
||||||||||||||||
| Consideration paid with cash and debt |
$ | 4,550,000 | $ | 4,500,000 | $ | 1,745,530 | $ | 10,795,530 | ||||||||
| Consideration paid with common units |
— | — | 494,118 | 494,118 | ||||||||||||
|
|
|
|
|
|
|
|
|
|||||||||
| Total consideration (e) |
$ | 4,550,000 | $ | 4,500,000 | $ | 2,239,648 | $ | 11,289,648 | ||||||||
|
|
|
|
|
|
|
|
|
|||||||||
F-14
Wheeler Real Estate Investment Trust, Inc. and Subsidiaries
Notes to Consolidated and Combined Financial Statements (Continued)
| 3. | Investment Properties (continued) |
| a. | Represents the preliminary estimated fair value of the net investment properties acquired which includes land, buildings, site improvements and tenant improvements. The fair value was determined using following approaches: |
| i. | the market approach valuation methodology for land by considering similar transactions in the markets; |
| ii. | a combination of the cost approach and income approach valuation methodologies for buildings, including replacement cost evaluations, “go dark” analyses and residual calculations incorporating the land values; and |
| iii. | the cost approach valuation methodology for site and tenant improvements, including replacement costs and prevailing quoted market rates. |
| b. | Represents the preliminary estimated fair value of lease intangibles and other assets. Lease intangibles include leasing commissions, in place leases and legal and marketing fees associated with replacing existing leases. The income approach was used to determine the fair value of these intangible assets which included estimated market rates and expenses. It was determined that carrying value approximated fair value for other asset amounts. |
| c. | Represents the preliminary estimated fair value of accounts payable, accrued expenses and other liabilities. It was determined that carrying value approximated fair value for all amounts in these categories. |
| d. | Represents the preliminary estimated fair value of above/below market leases. The income approach was used to determine the fair value of above/below market leases using market rental rates for similar properties. |
| e. | Represents the components of purchase consideration paid. |
The following unaudited pro forma condensed consolidated financial information is presented to illustrate the estimated impact on the results of operations of the Company assuming the transactions discussed above occurred on January 1, 2011.
| Year Ended December 31, 2012 | ||||||||||||
| WHLR and Subsidiaries (1) |
December 2012 Acquisitions (2) |
Consolidated | ||||||||||
| Total Revenues |
$ | 2,433,979 | $ | 1,322,250 | $ | 3,756,229 | ||||||
| Total Operating Expenses |
2,673,523 | 787,619 | 3,461,142 | |||||||||
|
|
|
|
|
|
|
|||||||
| Net Operating Income |
(239,544 | ) | 534,631 | 295,087 | ||||||||
| Interest Expense |
(966,113 | ) | (294,704 | ) | (1,260,817 | ) | ||||||
|
|
|
|
|
|
|
|||||||
| Net Income (Loss) |
$ | (1,205,657 | ) | $ | 239,927 | $ | (965,730 | ) | ||||
|
|
|
|
|
|
|
|||||||
| (1) | Includes the operations of the entities acquired for the period from their respective acquisition date through December 31, 2012. |
| (2) | Represents the estimated operations of the entities acquired for the period from January 1, 2012 until their respective acquisition dates. |
| Year Ended December 31, 2011 | ||||||||||||
| WHLR and Subsidiaries |
December 2012 Acquisitions |
Consolidated | ||||||||||
| Total Revenues |
$ | 1,925,277 | $ | 1,251,216 | $ | 3,176,493 | ||||||
| Total Operating Expenses |
1,673,907 | 805,514 | 2,479,421 | |||||||||
|
|
|
|
|
|
|
|||||||
| Net Operating Income |
251,370 | 445,702 | 697,072 | |||||||||
| Interest Expense |
(805,969 | ) | (349,862 | ) | (1,155,831 | ) | ||||||
|
|
|
|
|
|
|
|||||||
| Net Income (Loss) |
$ | (554,599 | ) | $ | 95,840 | $ | (458,759 | ) | ||||
|
|
|
|
|
|
|
|||||||
F-15
Wheeler Real Estate Investment Trust, Inc. and Subsidiaries
Notes to Consolidated and Combined Financial Statements (Continued)
| 4. | Mortgage Loans Payable |
The Company’s mortgage loans payable consist of the following:
| December 31, | ||||||||
| 2012 | 2011 | |||||||
| Mortgage term loan (The Shoppes at Eagle Harbor); payable in monthly principal and interest installments of $30,863; interest rate fixed at 6.20%; secured by real estate; matured April 2012 and has been extended to February 28, 2013 to accommodate the refinancing process. |
$ | 3,904,664 | $ | 4,024,629 | ||||
| Mortgage term loan (Lumber River Plaza); payable in monthly principal and interest installments of $18,414; interest rate fixed at 5.65%; secured by real estate; matures May 2015. |
3,050,117 | — | ||||||
| Mortgage term loan (Monarch Bank Building); monthly principal and interest installments of $9,473; interest rate fixed at 4.15%; secured by real estate; matures December 2017. |
1,533,346 | — | ||||||
| Mortgage term loan (Amscot Building); payable in monthly principal and interest installments of $4,634; interest rate fixed at 6.50%; secured by real estate; repaid in 2012. |
— | 348,171 | ||||||
| Mortgage term loan (Perimeter Square); payable in monthly principal and interest installments of $28,089; interest rate fixed at 6.38%; secured by real estate; matures June 2016. |
4,537,456 | — | ||||||
| Mortgage term loan (Riversedge North); payable in monthly principal and interest installments of $13,556; interest rate fixed at 6.00%; secured by real estate; matures April 2013. |
2,098,138 | 2,131,678 | ||||||
| Mortgage term loan (Shoppes at TJ Maxx); interest only payable monthly at a fixed interest rate of 6.00%; secured by real estate; matures April 2013. |
6,400,000 | — | ||||||
| Mortgage term loan (Walnut Hill Plaza); payable in monthly principal and interest installments of $25,269; interest rate fixed at 6.75%; secured by real estate; matures April 2014. |
3,528,232 | 3,587,143 | ||||||
| Mortgage term loan (Harps at Harbor Point); payable in monthly principal and interest installments of $18,122; interest rate was 3.99%; secured by real estate; matures December 2015. |
3,416,550 | — | ||||||
| Mortgage term loan (Twin City Commons); payable in monthly principal and interest installments of $17,827; interest rate was 4.86%; secured by real estate; matures January 2023. |
3,375,000 | — | ||||||
| Mortgage term loan (Monarch Bank Building); interest only payable monthly at a fixed rate of 7.00%; secured by real estate; matured December 2012. |
— | 2,044,462 | ||||||
|
|
|
|
|
|||||
| Total Mortgage Loans Payable |
$ | 31,843,503 | $ | 12,136,083 | ||||
|
|
|
|
|
|||||
The Shoppes at Eagle Harbor loan matured on February 28, 2013. We have refinanced the loan with another financial institution for $4.0 million at a 4.34% fixed interest rate. The loan calls for monthly principal and interest payments of $24,692 based on a 20 year amortization and a maturity date of February 28, 2018.
The Shoppes at TJ Maxx loan matures on April 19, 2013. We have received a commitment letter dated March 20, 2013 from another lender to refinance the loan, subject to normal underwriting procedures. The terms include a 7 year maturity date and require monthly principal and interest payments based on a 25 year amortization and a 3.88% fixed interest rate.
The Riversedge North loan matures on April 16, 2013. We are in discussions with the lender to extend the loan until such time that we decide our course of action on the loan. We anticipate being able to refinance this loan at terms that are at least comparable to those that currently exist.
F-16
Wheeler Real Estate Investment Trust, Inc. and Subsidiaries
Notes to Consolidated and Combined Financial Statements (Continued)
| 4. | Mortgage Loans Payable (continued) |
Debt Maturity
The Company’s scheduled principal repayments on indebtedness as of December 31, 2012 are as follows:
| Years Ending December 31, |
||||
| 2013 |
$ | 12,828,487 | ||
| 2014 |
3,874,390 | |||
| 2015 |
6,384,142 | |||
| 2016 |
4,282,410 | |||
| 2017 |
1,381,127 | |||
| Thereafter |
3,092,947 | |||
|
|
|
|||
| Total principal maturities |
$ | 31,843,503 | ||
|
|
|
|||
| 5. | Rentals under Operating Leases |
Future minimum rentals to be received under noncancelable tenant operating leases for each of the next five years and thereafter, excluding CAM and percentage rent based on tenant sales volume, as of December 31, 2012 are as follows:
| Years Ending December 31, |
||||
| 2013 |
$ | 4,790,281 | ||
| 2014 |
4,462,256 | |||
| 2015 |
4,088,263 | |||
| 2016 |
3,634,434 | |||
| 2017 |
3,206,532 | |||
| Thereafter |
8,328,208 | |||
|
|
|
|||
| $ | 28,509,974 | |||
|
|
|
|||
| 6. | Equity |
The Company has authority to issue 15,500,000 shares of stock, consisting of 15,000,000 shares of $0.01 par value Common Stock and 500,000 shares of Series A Convertible Preferred Stock. The Board of Directors, without an action by the stockholders of the Company, may amend the charter to increase or decrease the aggregate number of common shares available. Additionally, the Board of Directors may authorize the issuance of shares of its stock of any class or securities convertible into shares of its stock of any class. During the years ended December 31, 2012 and 2011, the Company issued 0 and 126,250 shares, respectively, of Series A Convertible Preferred Stock at $4.00 per share generating $999,000 in proceeds to cover anticipated offering expenses to be incurred prior to closing. All outstanding preferred stock shares were converted into 285,457 shares of common stock in conjunction with the offering at a conversion rate of $4.00 divided by 66.66% of the offering price.
Contemporaneously with executing the offering and formation transactions, the prior investors received cash or common units in exchange for their interests in the ownership entities. The value of the consideration paid to each of the prior investors in the formation transactions was based upon the terms of the applicable contribution agreement among the Operating Partnership and the prior investor(s), and was determined based on a relative equity valuation analysis of all of the properties included in the Company’s portfolio and the property management business. The common units issued in exchange for each property’s ownership interest will be convertible into common stock 180 days after the offering prospectus became effective.
In conjunction with executing the initial public offering, the Company adopted the 2012 Share Incentive Plan which established a pool for share options for the Company’s employees. This pool contains options to purchase 500,000 shares of the Company’s common stock. The options will vest at a rate of 20% per year for five years and have a per share exercise price equal to the fair market value of one of the Company’s common shares on the date of grant. No options have been awarded under this plan.
F-17
Wheeler Real Estate Investment Trust, Inc. and Subsidiaries
Notes to Consolidated and Combined Financial Statements (Continued)
| 7. | Commitments and Contingencies |
Lease Commitments
As of December 31, 2012, the Amscot property is subject to a ground lease which terminates in 2045. The ground lease requires the Company to make a fixed annual rental payment and includes escalation clauses and renewal options. The Company incurred ground lease expense included in other expense of $9,100 and $29,500 during the years ended December 31, 2012 and 2011, respectively.
Future minimum lease payments due under the ground lease, including applicable automatic extension options, are as follows (unaudited):
| Years Ending December 31, |
||||
| 2013 |
$ | 12,000 | ||
| 2014 |
12,000 | |||
| 2015 |
16,613 | |||
| 2016 |
18,150 | |||
| 2017 |
18,150 | |||
| Thereafter |
650,280 | |||
|
|
|
|||
| $ | 727,193 | |||
|
|
|
|||
Insurance
The Company carries comprehensive liability, fire, extended coverage, business interruption and rental loss insurance covering all of the properties in its portfolio under a blanket insurance policy, in addition to other coverages, such as trademark and pollution coverage, that may be appropriate for certain of its properties. Additionally, the Company carries a directors’, officers’, entity and employment practices liability insurance policy that covers such claims made against the Company and its directors and officers. The Company believes the policy specifications and insured limits are appropriate and adequate for its properties given the relative risk of loss, the cost of the coverage and industry practice; however, its insurance coverage may not be sufficient to fully cover its losses.
Concentration of Credit Risk
The Company is subject to risks incidental to the ownership and operation of commercial real estate. These risks include, among others, the risks normally associated with changes in the general economic climate, trends in the retail industry, creditworthiness of tenants, competition for tenants and customers, changes in tax laws, interest rates, the availability of financing and potential liability under environmental and other laws.
The Company’s portfolio of properties is dependent upon regional and local economic conditions and is geographically concentrated in the Mid-Atlantic, Southeast and Southwest, which markets represented approximately 62%, 17% and 21%, respectively, of the total annualized base rent of the properties in its portfolio as of December 31, 2012. The Company’s geographic concentration may cause it to be more susceptible to adverse developments in those markets than if it owned a more geographically diverse portfolio. Additionally, the Company’s retail shopping center properties depend on anchor stores or major tenants to attract shoppers and could be adversely affected by the loss of, or a store closure by, one or more of these tenants.
F-18
Wheeler Real Estate Investment Trust, Inc. and Subsidiaries
Notes to Consolidated and Combined Financial Statements (Continued)
| 7. | Commitments and Contingencies (continued) |
Regulatory and Environmental
As the owner of the buildings on our properties, the Company could face liability for the presence of hazardous materials (e.g., asbestos or lead) or other adverse conditions (e.g., poor indoor air quality) in its buildings. Environmental laws govern the presence, maintenance, and removal of hazardous materials in buildings, and if the Company does not comply with such laws, it could face fines for such noncompliance. Also, the Company could be liable to third parties (e.g., occupants of the buildings) for damages related to exposure to hazardous materials or adverse conditions in its buildings, and the Company could incur material expenses with respect to abatement or remediation of hazardous materials or other adverse conditions in its buildings. In addition, some of the Company’s tenants routinely handle and use hazardous or regulated substances and wastes as part of their operations at our properties, which are subject to regulation. Such environmental and health and safety laws and regulations could subject the Company or its tenants to liability resulting from these activities. Environmental liabilities could affect a tenant’s ability to make rental payments to the Company, and changes in laws could increase the potential liability for noncompliance. This may result in significant unanticipated expenditures or may otherwise materially and adversely affect the Company’s operations. The Company is not aware of any material contingent liabilities, regulatory matters or environmental matters that may exist.
Litigation
The Company is involved in various legal proceedings arising in the ordinary course of its business, including, but not limited to commercial disputes. The Company believes that such litigation, claims and administrative proceedings will not have a material adverse impact on its financial position or its results of operations. The Company records a liability when it considers the loss probable and the amount can be reasonably estimated.
The Company is involved in a lawsuit whereby the Company originally sued a prospective tenant for breach of contract related to an executed lease. The court found in favor of the defendant and assessed damages against the Company of $13,300. The defendant’s attorney has applied to the court to be reimbursed legal fees incurred by the defendant of approximately $368,000. The Company is responding to the litigation and intends to appeal and contest the ruling vigorously.
F-19
Wheeler Real Estate Investment Trust, Inc. and Subsidiaries
Notes to Consolidated and Combined Financial Statements (Continued)
| 8. | Related Party Transactions |
Jon S. Wheeler (“Mr. Wheeler”), the Company’s Chairman and President, when combined with his affiliates represents the Company’s second largest stockholder. Wheeler Interests, LLC and its affiliates (Wheeler Interests), controlled by Mr. Wheeler, provide administrative services to the Company, including management, administrative, accounting, marketing, development and design services. Pursuant to the terms of the Company’s administrative services agreement, Wheeler Interests’ responsibilities include administering the Company’s day-to-day business operations, identifying and acquiring targeted real estate investments, overseeing the management of the investments, and handling the disposition of the real estate investments. The Company also benefits from Wheeler Interests’ affiliates that specialize in retail real estate investment and management, including (i) Wheeler Development, LLC, a full service real estate development firm, (ii) Wheeler Capital, LLC, a capital investment firm specializing in venture capital, financing, and small business loans, (iii) Wheeler Real Estate, LLC, a real estate management and administration firm, (iv) Site Applications, LLC, a full service facility company, equipped to handle all levels of building maintenance, and (v) TESR, LLC, a tenant relations company, serving as a liaison between property management, lease administration and leasing and working to provide information on the health and fiscal viability of each tenant.
Wheeler Interests leases the Company’s Riversedge property under a 10 year operating lease expiring in November 2017, with four five year renewal options available. The lease currently requires monthly base rent payments of $24,000 and provides for annual increases throughout the term of the lease and subsequent option periods. Additionally, Wheeler Interests reimburses the Company for a portion of the property’s operating expenses and real estate taxes.
The following summarizes related party activity as of and for the years ended December 31, 2012 and 2011:
| December 31, | ||||||||
| 2012 | 2011 | |||||||
| Amounts paid to Wheeler Interests and its affiliates: |
||||||||
| Wheeler Interests |
$ | 691,636 | $ | 337,292 | ||||
| Wheeler Development |
57,774 | 11,672 | ||||||
| Wheeler Real Estate |
50,998 | 76,220 | ||||||
| Site Applications |
67,746 | 73,314 | ||||||
| Creative Retail Works |
— | 5,621 | ||||||
| TESR |
22,011 | 19,152 | ||||||
|
|
|
|
|
|||||
| $ | 890,165 | $ | 523,271 | |||||
|
|
|
|
|
|||||
| Amounts due to Wheeler Interests and its affiliates: |
||||||||
| Wheeler Interests |
$ | 51,417 | $ | 9,738 | ||||
| Wheeler Development |
3,962 | — | ||||||
| Wheeler Real Estate |
31,496 | 15,719 | ||||||
| Site Applications |
1,150 | 6,096 | ||||||
| TESR |
— | 9,704 | ||||||
| WHLR Management |
15,308 | — | ||||||
| Jon Wheeler and affiliates |
86,836 | 1,131,489 | ||||||
|
|
|
|
|
|||||
| $ | 190,169 | $ | 1,172,746 | |||||
|
|
|
|
|
|||||
| Rent and reimbursement income received from Wheeler Interests |
$ | 406,300 | $ | 396,500 | ||||
|
|
|
|
|
|||||
| Rent and other tenant receivables due from Wheeler Interests |
$ | 250,063 | $ | 128,790 | ||||
|
|
|
|
|
|||||
The amounts outstanding to Mr. Wheeler and Wheeler Interests at December 31, 2011 primarily consisted of a payable due from The Shoppes at Eagle Harbor property to its owner, a company in which Mr. Wheeler holds a substantial investment and management position. This amount primarily consisted of advances to the property for construction costs incurred to build the center in excess of what was financed through the lender, and for a subsequent $250,000 principal curtailment required by the lender in conjunction with converting the construction loan to permanent financing; the lender required this payment due to cap rate changes and other factors occurring subsequent to their original underwriting of the construction loan as a result of the economic downturn beginning in 2008. In conjunction with the formation transactions and offering, the REIT used approximately $1.78 million of the net proceeds to purchase The Shoppes at Eagle Harbor property from DF-1 Carrollton, LLC. Per the DF-1 Carrollton, LLC operating agreement, this transaction constituted a capital event, resulting in a distribution to DF- 1 Carrollton, LLC, a portion of which went towards satisfying the outstanding amounts due from the property.
| 9. | Subsequent Event |
On February 6, 2012, the Company entered into a contract to purchase a 75,000 square foot free-standing grocery store located in the Bixby Commons shopping center in Bixby, Oklahoma for a purchase price of approximately $10.60 million. The property is stabilized by a 20-year, triple-net lease expiring in 2032 with Associated Wholesale Grocers, Inc. (“Associated”), a retailer-owned cooperative serving over 1,900 retail member stores with a complete assortment of grocery and general merchandise items. Associated subleases the property to Reasor’s Foods. The Company is conducting the due diligence process and anticipates the contract will close in the second quarter.
F-20
Wheeler Real Estate Investment Trust, Inc. and Subsidiaries
Schedule II-Valuation and Qualifying Accounts
December 31, 2012
| Description |
Balance at Beginning of Year |
Charged to Costs and Expense |
Deductions from Reserves |
Balance at End of Year |
||||||||||||
| Allowance for doubtful accounts: |
||||||||||||||||
| Year ended December 31, 2012 |
$ | 72,200 | $ | 25,000 | $ | (21,950 | ) | $ | 75,250 | |||||||
| Year ended December 31, 2011 |
52,200 | 20,000 | — | 72,200 | ||||||||||||
F-21
Wheeler Real Estate Investment Trust, Inc. and Subsidiaries
Schedule III-Real Estate and Accumulated Depreciation
December 31, 2012
| Initial Cost | Costs Capitalized Subsequent to Acquisition |
Gross Amount at which Carried at End of Period |
||||||||||||||||||||||||||
| Property Name |
Land | Building and Improvements |
Improvements (net) |
Carrying Costs |
Land | Building and Improvements |
Total | |||||||||||||||||||||
| Amscot Building |
$ | — | $ | 461,700 | $ | 18,202 | $ | — | $ | — | $ | 479,902 | $ | 479,902 | ||||||||||||||
| Harps at Harbor Point |
1,093,507 | 2,891,853 | — | — | 1,093,507 | 2,891,853 | 3,985,360 | |||||||||||||||||||||
| Lumber River Village |
800,413 | 4,486,787 | — | — | 800,413 | 4,486,787 | 5,287,200 | |||||||||||||||||||||
| Monarch Bank |
496,591 | 1,908,659 | 77,704 | — | 496,591 | 1,986,363 | 2,482,954 | |||||||||||||||||||||
| Perimeter Square |
1,566,431 | 5,081,193 | — | — | 1,566,431 | 5,081,193 | 6,647,624 | |||||||||||||||||||||
| Riversedge North |
909,898 | 2,207,571 | 17,813 | — | 909,898 | 2,225,384 | 3,135,282 | |||||||||||||||||||||
| Surrey Plaza |
380,731 | 1,856,515 | — | — | 380,731 | 1,856,515 | 2,237,246 | |||||||||||||||||||||
| The Shoppes at TJ Maxx |
2,115,119 | 6,719,386 | — | — | 2,115,119 | 6,719,386 | 8,834,505 | |||||||||||||||||||||
| The Shoppes at Eagle Harbor |
785,040 | 4,219,464 | 238,339 | — | 785,040 | 4,457,803 | 5,242,843 | |||||||||||||||||||||
| Twin City Crossing |
800,272 | 3,040,956 | — | — | 800,272 | 3,040,956 | 3,841,228 | |||||||||||||||||||||
| Walnut Hill Plaza |
733,748 | 2,413,832 | 1,315,497 | — | 733,748 | 3,729,329 | 4,463,077 | |||||||||||||||||||||
|
|
|
|
|
|
|
|
|
|
|
|
|
|
|
|||||||||||||||
| Totals |
$ | 9,681,750 | $ | 35,287,916 | $ | 1,667,555 | $ | — | $ | 9,681,750 | $ | 36,955,471 | $ | 46,637,221 | ||||||||||||||
|
|
|
|
|
|
|
|
|
|
|
|
|
|
|
|||||||||||||||
F-22
Wheeler Real Estate Investment Trust, Inc. and Subsidiaries
Schedule III-Real Estate and Accumulated Depreciation
| Property Name |
Encumbrances | Accumulated Depreciation |
Date of Construction |
Date Acquired |
Depreciation Life |
|||||||||||||
| Amscot Building |
$ | 134,531 | 5/15/2004 | 5-40 years | ||||||||||||||
| Harps at Harbor Point |
(1) | 7,612 | 12/14/2012 | 5-40 years | ||||||||||||||
| Lumber River Village |
(2) | 11,168 | 11/16/2012 | 5-40 years | ||||||||||||||
| Monarch Bank |
(3) | 845,267 | 12/28/2007 | 5-40 years | ||||||||||||||
| Perimeter Square |
(4) | 18,196 | 11/16/2012 | 5-40 years | ||||||||||||||
| Riversedge North |
(5) | 628,060 | 4/17/2008 | 5-40 years | ||||||||||||||
| Surrey Plaza |
1,382 | 12/21/2012 | 5-40 years | |||||||||||||||
| The Shoppes at TJ Maxx |
(6) | 27,700 | 11/16/2012 | 5-40 years | ||||||||||||||
| The Shoppes at Eagle Harbor |
(7) | 507,242 | 9/9/2008 | 5-40 years | ||||||||||||||
| Twin City Crossing |
(8) | 1,742 | 12/18/2012 | 5-40 years | ||||||||||||||
| Walnut Hill Plaza |
(9) | 1,108,656 | 12/14/2007 | 5-40 years | ||||||||||||||
|
|
|
|||||||||||||||||
| Totals |
$ | 3,291,556 | ||||||||||||||||
|
|
|
|||||||||||||||||
| 2012 | 2011 | |||||||||||||||||
| Balance at beginning of period |
$ | 15,774,838 | $ | 15,741,491 | ||||||||||||||
| Additions during the period: |
||||||||||||||||||
| Acquisitions |
30,815,046 | — | ||||||||||||||||
| Improvements |
47,337 | 33,347 | ||||||||||||||||
|
|
|
|
|
|||||||||||||||
| Balance at end of period |
$ | 46,637,221 | $ | 15,774,838 | ||||||||||||||
|
|
|
|
|
|||||||||||||||
| (1) | This property secures a $3.42 million mortgage note. |
| (2) | This property secures a $3.19 million mortgage note. |
| (3) | This property secures a $1.53 million mortgage note. |
| (4) | This property secures a $4.50 million mortgage note. |
| (5) | This property secures a $2.24 million mortgage note. |
| (6) | This property secures a $6.40 million mortgage note. |
| (7) | This property secures a $4.00 million mortgage note. |
| (8) | This property secures a $3.38 million mortgage note. |
| (9) | This property secures a $4.30 million mortgage note. |
F-23
| Exhibit | ||
| 3.1 | Articles of Amendment and Restatement of Wheeler Real Estate Investment Trust, Inc. (1) | |
| 3.2 | Amended and Restated Bylaws of Wheeler Real Estate Investment Trust, Inc. (1) | |
| 4.1 | Form of Certificate of Common Stock of Wheeler Real Estate Investment Trust, Inc. (1) | |
| 10.1 | Agreement of Limited Partnership of Wheeler REIT, L.P. (1) | |
| 10.2 | Indemnification Agreement between Wheeler Real Estate Investment Trust, Inc. and its officers and directors (1) | |
| 10.3 | Wheeler Real Estate Investment Trust, Inc. 2012 Stock Incentive Plan (1) | |
| 10.4 | OP Contribution Agreement contributing the managing member interests of the Amscot Building, Monarch Bank and Riversedge North properties to Wheeler REIT, L.P. (1) | |
| 10.5 | Employment Agreement with Jon S. Wheeler (1) | |
| 10.6 | Employment Agreement with Steven M. Belote (1) | |
| 10.7 | Employment Agreement with Robin A. Hanisch (1) | |
| 10.8 | Administrative Services Agreement by and between Wheeler Real Estate Investment Trust, Inc. and WHLR Management, LLC (1) | |
| 10.9 | OP Contribution Agreement contributing the managing member interests of Lumber River Village, Perimeter Square, Shoppes at TJ Maxx and Walnut Hill Plaza properties to Wheeler REIT, L.P. (1) | |
| 10.10 | OP Contribution Agreement contributing the non-managing member interests of the Amscot Building, Monarch Bank and Riversedge North properties to Wheeler REIT, L.P. (1) | |
| 10.11 | OP Contribution Agreement contributing the non-managing member interests of the Lumber River Village, Perimeter Square, Shoppes at TJ Maxx and Walnut Hill Plaza properties to Wheeler REIT, L.P. (1) | |
| 10.12 | Subordination Agreement (1) | |
| 10.13 | Letter Agreement, dated March 13, 2012, by and between Jon S. Wheeler and Harrison J. Perrine (1) | |
| 10.14 | Placement Agreement, dated November 16, 2012, by and among Wheeler Real Estate Investment Trust, Inc., Wellington Shields & Co., LLC and Capitol Securities Management, Inc. (2) | |
| 10.15 | Assignment of Purchase and Sale Agreement, dated December 14, 2012, by and between HPA-1, LLC and WHLR-HPA-1. (3) | |
| 10.16 | Real Estate Purchase and Sale Agreement, dated August 30, 2012, by and between Harps Food Stores, Inc. and HPA-1, LLC (3) | |
| 10.17 | Assignment of Purchase and Sale Agreement, dated December 18, 2012, by and between Twin City Associates, LLC and WHLR-Twin City Associates, LLC (4) | |
| 10.18 | Purchase Contract, dated June 11, 2012, by and between Twin City Crossing, LLC and Wheeler Interests, Inc. (4) | |
| 10.19 | First Amendment to Purchase Contract, dated June 26, 2012, by and between Twin City Crossing, LLC and Wheeler Interests, Inc. (4) | |
| 10.20 | Second Amendment to Purchase Contract, dated August 9, 2012, by and between Twin City Crossing, LLC and Wheeler Interests, Inc. (4) | |
| 10.21 | Third Amendment to Purchase Contract, dated August 16, 2012, by and between Twin City Crossing, LLC and Wheeler Interests, Inc. (4) | |
| 10.22 | Fourth Amendment to Purchase Contract, dated August 30, 2012, by and between Twin City Crossing, LLC and Wheeler Interests, Inc. (4) | |
| 10.23 | Fifth Amendment to Purchase Contract, dated October 12, 2012, by and between Twin City Crossing, LLC and Wheeler Interests, Inc. (4) | |
| 10.24 | Sixth Amendment to Purchase Contract, dated November 9, 2012, by and between Twin City Crossing, LLC and Wheeler Interests, Inc. (4) | |
| 10.25 | Change in Terms Agreement, dated December 20, 2012, by and between TowneBank and Lynnhaven Parkway Associates LLC (5) | |
| 10.26 | Real Estate Purchase and Sale Agreement, dated February 5, 2013, by and between Supermarket Developers, Inc. and WHLR-BIXBY Commons, LLC (6) | |
| 21.1 | Subsidiaries of Registrant (7) | |
| 23.1 | Consent of Cherry Bekaert LLP (7) | |
| 31.1 | Certification of the Chief Executive Officer of Wheeler Real Estate Investment Trust, Inc. pursuant to Rule 13a-14 of the Securities Exchange Act of 1934, as amended, as adopted pursuant to Section 302 of the Sarbanes-Oxley Act of 2002 (7) | |
| 31.2 | Certification of the Chief Financial Officer of Wheeler Real Estate Investment Trust, Inc. pursuant to Rule 13a-14 of the Securities Exchange Act of 1934, as amended, as adopted pursuant to Section 302 of the Sarbanes-Oxley Act of 2002 (7) | |
| 32.1 | Certification of Chief Executive Officer pursuant to 18 U.S.C. Section 1350, as adopted pursuant to Section 906 of the Sarbanes-Oxley Act of 2002 (7) | |
| 32.2 | Certification of Chief Financial Officer pursuant to 18 U.S.C. Section 1350, as adopted pursuant to Section 906 of the Sarbanes-Oxley Act of 2002 (7) | |
| 101.INS | XBRL Instance Document (8) | |
| 101.SCH | XBRL Taxonomy Extension Schema Document (8) | |
| 101.CAL | XBRL Taxonomy Extension Calculation Linkbase (8) | |
| 101.DEF | XBRL Taxonomy Extension Definition Linkbase (8) | |
| 101.LAB | XBRL Taxonomy Extension Labels Linkbase (8) | |
| 101.PRE | XBRL Taxonomy Extension Presentation Linkbase (8) | |
| (1) | Filed as an exhibit to the Wheeler Real Estate Investment Trust Inc.’s Registration Statement on Form S-11 (Registration No. 333-177262) previously filed pursuant to the Securities Act of 1933 and hereby incorporated by reference. |
| (2) | Filed as an exhibit to the Wheeler Real Estate Investment Trust Inc.’s Quarterly Report on Form 10-Q for the quarter ended September 30, 2012 and hereby incorporated by reference. |
| (3) | Filed as an exhibit to the Wheeler Real Estate Investment Trust Inc.’s Current Report on Form 8-K filed on December 20, 2012 and hereby incorporated by reference. |
| (4) | Filed as an exhibit to the Wheeler Real Estate Investment Trust Inc.’s Current Report on Form 8-K filed on December 21, 2012 and hereby incorporated by reference. |
| (5) | Filed as an exhibit to the Wheeler Real Estate Investment Trust Inc.’s Current Report on Form 8-K filed on December 27, 2012 and hereby incorporated by reference. |
| (6) | Filed as an exhibit to the Wheeler Real Estate Investment Trust Inc.’s Current Report on Form 8-K filed on February 11, 2013 and hereby incorporated by reference. |
| (7) | Filed herewith. |
| (8) | Furnished herewith. |